HAL Id: hal-01819429
https://hal.uca.fr/hal-01819429
Submitted on 26 Mar 2021
HAL is a multi-disciplinary open access
archive for the deposit and dissemination of
sci-entific research documents, whether they are
pub-lished or not. The documents may come from
teaching and research institutions in France or
abroad, or from public or private research centers.
L’archive ouverte pluridisciplinaire HAL, est
destinée au dépôt et à la diffusion de documents
scientifiques de niveau recherche, publiés ou non,
émanant des établissements d’enseignement et de
recherche français ou étrangers, des laboratoires
publics ou privés.
Tracer redistribution by clouds in West Africa:
Numerical modeling for dry and wet seasons
M. Renard, N. Chaumerliac, S. Cautenet, E. Nickerson
To cite this version:
M. Renard, N. Chaumerliac, S. Cautenet, E. Nickerson. Tracer redistribution by clouds in West Africa:
Numerical modeling for dry and wet seasons. Journal of Geophysical Research, American Geophysical
Union, 1994, 99 (D6), �10.1029/94JD00408�. �hal-01819429�
JOURNAL OF GEOPHYSICAL RESEARCH, VOL. 99, NO. D6, PAGES 12,873-12,883, JUNE 20, 1994
Tracer redistribution by clouds in West Africa:
Numerical modeling for dry and wet seasons
M. Renard, N. Chaumerliac, and S. Cautenet
LAMP/OPGC, Universit6 Blaise Pascal, Aubiere, FranceE. C. Nickerson
National Oceanic and Atmospheric Administration/FSL, Boulder, Colorado
Abstract. The vertical transport by clouds of an inert tracer and its redistribution by
complex West African circulations are examined using a two-dimensional mesoscale
meteorological model with explicit microphysics. The model reproduces the tropical
distribution of clouds and precipitation along a meridional cross section over West
Africa, corresponding
to the position of the Intertropical Convergence
Zone (ITCZ)
during the dry and rainy seasons. The resulting redistribution of the inert tracer is
therefore closely related to the northward migration of the ITCZ between January and
July. The occurrence of biomass burning during the dry season is shown to be an
important source of tracer enrichment at upper levels in the atmosphere.
1. Introduction
Emissions from biomass burning in intertropical regions
have been shown to contribute to the global redistribution of atmospheric trace gases and hence may be expected to play an important role in global climate change [Delrnas, 1982;
Crutzen et al., 1985; Harris et al., 1988]. Tropical atmo- spheric chemistry has been studied extensively during the
Amazon Boundary Layer Experiment (ABLE 2A) (de-
scribed by Garstang et al., 1988], over West Africa during the TROPOZ I experiment (Tropospheric Ozone Experi-
ment) (Marenco et al., 1990] and also during DECAFE
(Dynamique
et Chimie
de l'Atmosphb•re
en For•t l•quatori-
ale) (reported in a special issue of the Journal of Geophysical
Research, 97(D6), 1992). These experiments, especially DE-
CAFE, have highlighted the difficulty of separating the interactive roles of fluxes, transport, and chemical reactions in the redistribution of chemical species in the troposphere.
Intertropical areas are of interest for three reasons: 1. Biogenic emissions from the equatorial forest and the occurrence of biomass burning during the dry season are sources of chemical compounds that are important in the global tropospheric chemistry budget.
2. The synoptic meteorology of West Africa is greatly influenced by the seasonal migration of the Intertropical
Convergence Zone (ITCZ) and the associated African east- erly jet (AEJ) located at an altitude of approximately 3.5 km.
The dry and wet seasons are also marked by the presence of the south tropical jet (STJ), and the tropical easterly jet
(TEJ) in January and July, respectively, at an altitude of 15
km.
3. These regions are subject to extensive convective activity associated with the shift of the ITCZ.
Both observations and theory emphasize the important
role of convective clouds in redistributing trace gases in the atmosphere [Chatfield and Crutzen, 1984; Chatfield and
Copyright 1994 by the American Geophysical Union. Paper number 94JD00408.
0148-0227/94/94JD-00408505.00
Delany, 1990]. The chemistry of West African tropics is therefore very dependent on the extensive convective activ- ity normally associated with the ITCZ and also on the intense and persistent airflow regimes that occur over West
Africa.
The aim of this paper is to examine the interactions between chemistry and meteorology over West Africa by restricting the scope of the problem to the transport of an inert tracer. The resulting trace gas concentrations and their vertical profiles are therefore due solely to dynamical pro- cesses, thereby setting aside, for the moment, processes such as wet removal, deposition, and photochemistry.
The meteorological fields were obtained from a two- dimensional primitive equation model described in section 2. Our aim here is not to study the dynamics of meteorological circulations over West Africa but rather to reproduce the primary features of the observed wind fields that are respon- sible for species transport. The meteorological fields were initialized with an analytical procedure (section 3) to obtain a coherent representation of the field gradients instead of from the sparse and irregular data available over West
Africa. Section 4 then examines the evolution of an inert
tracer distribution over West Africa for both dry and wet
seasons.
2. Model Description
To model West African circulations, we have adapted a
two-dimensional version of the three-dimensional model of
Nickerson et al. [ 1986]. The two-dimensional model domain
extends from the 10øS to the 35øN in latitude and is a cross
section around 0 ø longitude. The positive x and y axis are, respectively, toward the East and the North.
2.1. Model Equations
The model is a hydrostatic primitive equation model in which the grid system is staggered both horizontally and vertically. The vertical coordinate, •,, is defined by
(P - Pt) (4• -- /,,4)
•r = • = (•)
•r 3
12,874 RENARD ET AL.: CLOUDS TRANSPORT IN WEST AFRICA
where p = pRTv (13)
•r = Ps - Pt (2)
and p s and Pt are the pressures at the surface and at the top of the model, respectively. The vertical resolution is con-
stant in the e coordinate, thus it varies from a few meters near the surface up to a kilometer or more in the highest vertical levels of the model [Nickerson et al., 1986]. With respect to the horizontal resolution it is taken constant, equal to 40 km.
For the south-north component, e, and the west-east component, u, of the wind velocity, we define the variables
U = •ru and V = •rv. We split them into a forcing term and
a perturbed term:
V = Vaef(x, y, e)+ Vaiv(Y, e)+ V'(y, e, t) (3) U = Udcf(x, y, e) + U'(y, e, t) (4)
where U', V' correspond to the perturbed fields and Vdi v is a stationary divergent field. Udef, Vde f represent a stationary nondivergent field of the deformation satisfying the relation- ship
ox
oy
= 0. (5)
In the two-dimensional cross section, x = 0, Ude f is assumed to vanish (see the appendix for a mathematical description of the Udef, Vdef, and Vdiv).
The four prognostic equations for U', V', H, and ,r and
the five diagnostic equations used in the model or for analysis purposes are
0 U' 0 Vu 0 Vdef 1 0(U•r' b)
-
+ 2u
•
+ fy(Vdi
v + V')
Ot Oy Oy (r' 09 OV' Ot+ •rFn, v + •rFv, v
(6)
o
vv (o t o<w'
--•+V
•-fyU'
Oy
Oy /
o"
O
e
- RTv
•r • + •rFH, v + •rFv, v + •rFf
(7)
p Oy Oyo7rn
at
O
• + H Oy
V. (OVdeft
/
e'
on
Ox •r' Oe
1 O(7rno"
•)
07r
Otf• (0
Vdi
Oyv
+ 'n'FH,
H + 'n'Fv,
H
• + •' dv oy (8) (9) 0" +•Yr o"
0Vdiv
+O.V'.t
deOy
Oy ]
(10)O• -RT•,
1 +
Olnp 1+w =-
+ v
+fy •+
b
g Oy ,r (11) (12)ox
0
fyp
10Vde f
ß (14)R(1 + 0.61q,•r 2 •r'
where i• = (d Hdt) is the ve•ical velocity in the transformed coordinate system, and definitions of the other symbols am
•ven in Table 1.
The forcing defo•ation field, Udef, Vdef, is associated with a constant pe•urbation of the geopotential through geostrophic b•ance. Thus the ve•ical shear of Vde f induces a zonal •adient of the temperature (OT/Ox) (thermal wind relationship) and hence of the entropy (OH/Ox') as described
in (14).
The water loading has been included in the hydrostatic equation (11) as a function of cloud water mixing ratio q I and r•nwater mixing ratio q• [Hsie et al., 1984].
The F• horizontal d•usion terms am written as a fou•h- order operator. The F v terms represent the ve•ical turbu- lent mixing effects computed with the prediction model of
Table 1. Model Variables and Constants
Symbol Definition
H entropy
0 potential temperature
q v vapor mixing ratio
q l cloud water mixing ratio
qr rainwater mixing ratio
Tv virtual temperature (1 + 0.61qv)T
T• perturbation of virtual temperature
R gas constant for dry air
p pressure
Pt pressure at the top of the model 10 hPa
Ps pressure at the surface
,r P s-P t
p air density
ß geopotential
ß ' geopotential perturbation
fy Coriolis parameter: fi0,-yequa)
/3
2 x 10
-nm -• s -•
yequa equator position on the y axis
C p specific heat at constant pressure for dry air
Lv latent heat of evaporation for water
u West-East wind component
v South-north wind component
u' , v' u,v perturbations
U •ru
V 7rv
Udef deformation field for u Vdcf deformation field for v Vdiv divergent field for v
U' U perturbation
V' V perturbation
w vertical velocity (cm s-•)
F H horizontal diffusion term
Fv vertical turbulent mixing term
Ff forcing term
K turbulent vertical mixing coefficient
3'cg countergradient of temperature v vertical coordinate of the model
rr P s-P t / •
• drr/dv i, dv/dt
RENARD ET AL.' CLOUDS TRANSPORT IN WEST AFRICA 12,875
th• turbulent kinetic energy in the planetary boundary layer
(PBL) described by Mahfouf et al. [1987]. These terms for
any variable X are written as
rrrv,x
= B • BK
3• '] with
B = -RT---••''
The coefficients K are proportional to the square root of the turbulent kinetic energy and to the mixing length. This
mixing length and the evolution of the turbulent kinetic energy are computed, using the results of Thetry and Lac-
arrdre [1983], everywhere in the troposphere. In fact, no- ticeable values of K are only found in the PBL.
To ensure a positive heat flux in regions of neutral stratification or slightly stable conditions, a countergradient of temperature is added to the -K (OH/Oz) term. Hence the
Fv, H term is written as
,rFv, H = B •
BK
where
•/ca
is proportional
to the virtual
sensible
heat flux at
the surface [Therry and Lacarr•re, 1983]. This parameter- ization of the turbulent mixing effects enables convection to
develop in synergy with the microphysics effects, although no parameterization of the convection is included in the
model. The relative effects of the turbulence scheme versus
the microphysical scheme have previously been discussed by Chaumerliac et al. [1992] for the case of frontal rain.
For the lateral boundaries, we have applied the method of
Davies [1983], using the initial boundary values of the fields
as constant forcing boundary conditions.
In (7) the Ff term is an additional
forcing
term propor-
tional to the unperturbed meridional wind, Vde f q- Vdi v. This
term has been added to force the convergence of the
numerical evolution toward the observed meridional wind
field. In fact, a three-dimensional model is required to
properly represent the evolution of these regions. Our aim
here is to reproduce the principal features of the meteoro-
logical fields over West Africa that are responsible for the transport of an inert tracer and not to study the dynamics of
West African circulations.
To complete this basic version of the model, we have used the parameterization of the microphysics based upon the
work of Kessler [ 1969] and described by Richard and Chau-
merliac [1989]. This parameterization can be classified as explicit microphysics according to the definition given by
Hsie et al. [1984].
2.2. Initialization Procedure
We assume that the meridional wind perturbation, v', vanishes at the beginning of the simulation. Hence the meridional wind reduces to the deformation and divergent
winds, Vdef, Vdiv'
The initial vapor mixing ratio distribution is prescribed as
a function of the strong gradient of moisture of the intertrop- ical front (section 3.1).
The initial perturbations of the virtual temperature, T•,
and of the zonal component, u', of the wind are assumed to
be balanced: 25 ß 20 15 • 10 I I J I I i I I I ! I?CZ Zone A •' ß _
,,
-
•.t i ß,.• i
/ •''v . • ß--
,.-
J FNANJ JAS OND
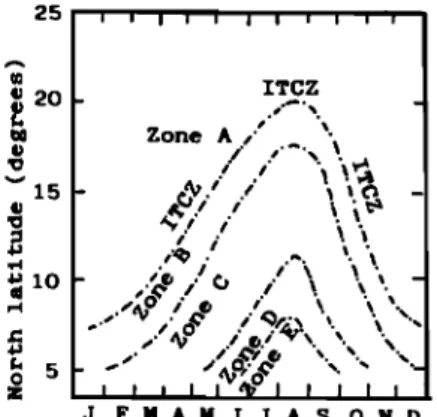
Figure 1. Intertropical convergence zone displacements in Walker's diagram: zone A, Saharan cloudless air; zone B,
W-SW winds, shallow maritime air, thunderstorms; zone C, intense rainfalls associated with SW monsoon flow; zone D,
stable, cold, and very cloudy atmosphere with continuous
weak rainfalls; zone E, above the coastal lands only for a
short period (July to September) accompanied by low tem- peratures and only few rains (reproduced from Cautenet and
Rosset [ 1989]).
RT• = (16)
0 lnp
where cI>' is the initial perturbation of the geopotential. Starting with an analytical function for u'(y, p), we
deduce from (15) and (16) the analytical expressions of
and T• in pressure
coordinate. Hence we obtain T• in the
vertical coordinate system •,. Integrating (16) with the nu-
merical scheme of the model, we deduce the numerical
values of •. Finally, the numerically balanced values of u' are computed with the horizontal discretization scheme of
the model for (15). In the following section, these initial
fields are presented in more detail.
3. Meteorological
Fields
Since meteorological processes such as the vertical trans-
port within clouds may have a profound effect on atmo- spheric chemistry, it is necessary to depict the primary circulation features over West Africa as accurately as pos-
sible.
Along longitude 0 ø, airflow near the surface over West Africa is characterized by the simultaneous occurrence of
the northeastern trade wind "Harmattan" and the monsoon
flow from the southwest (Figures 1 of Lacaux et al. [1992] and Fontan et al. [1992]). The ITCZ associated with those
two flow regimes
gives
rise to a strong
gradient
of moisture
between the dry Saharan air advected by the Harmattan and
the oceanic air of the monsoon flow. This front is located
near latitude 8øN in January and close to 20øN in July
[Lacaux et al., 1992; Fontan et al., 1992], as shown in
Walker's diagram (Figure 1) (reproduced from Cautenet and
Rosset [ 1989]).
In view of the intense seasonal variability of the West
African
circulations,
we have chosen
to study
the transport
of trace gases by means of two meteorological scenarios with initial fields corresponding to the January and July climato-
12,876 RENARD ET AL.' CLOUDS TRANSPORT IN WEST AFRICA
V•POR XIXIN• R•TIO (•tK•I i i i
S 0 10 •-0
I I
January
30 N
Figure 2. Vertical cross sections
of the initial vapor mixing ratio in January
and July.
3.1. Initial Fields
The iriitial distribution of the vapor mixing ratio deduced from Reed et al. [1977] and Cadet and Nnoli [1987] is shown in Figure 2. The initial upper limit of the saturated monsoon layer is marked by the strong horizontal gradient of mois- ture. As the front shifts southward with altitude, the mon- soon layer is thicker in the south of West Africa [Reed et al., 1977; Dettwiller, 1965]. We have also reproduced the sea- sonal variation of the ground location of the iTCZ by
analytical variations of the initial vapor mixing ratio with
latitude (Figure 2).
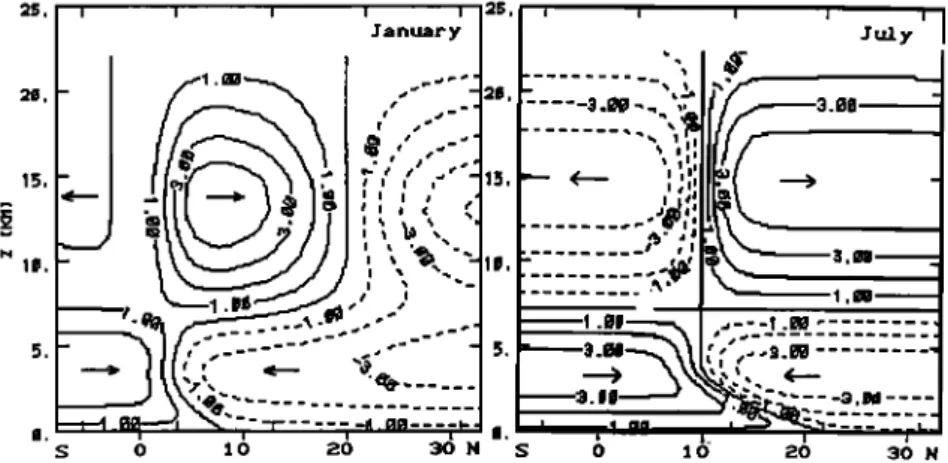
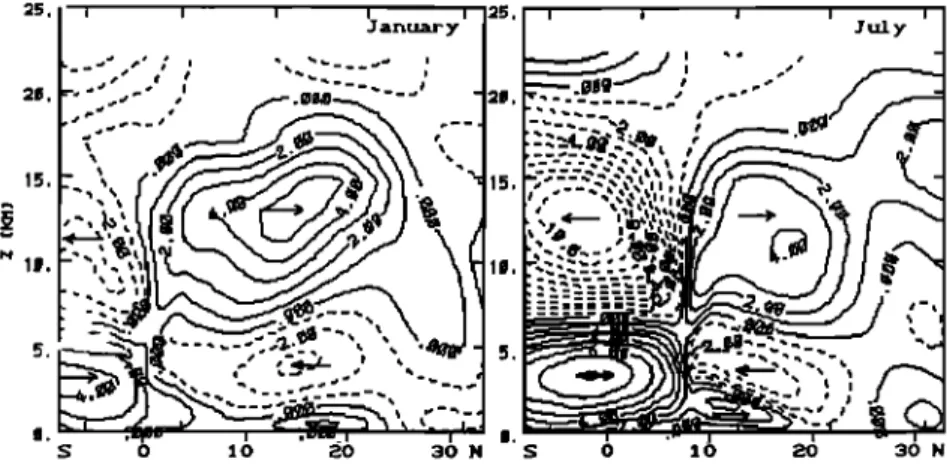
The initial meridional and zonal winds derived from
Burpee [1972], Reed et al. [1977], Newell and Kidson [1984], and Dettwiller [1965] are presented in Figures 3 and 4,
respectively. Thus we have modeled the monsoon flow (MF), characterized by western winds near the surface in
Figure 4 and southern winds in Figure 3, with a maximum western wind speed at 3øN in July and at 0øN in January. The Harmattan (H) is represented by the northeasterly winds in
the low levels of the northern part of the domain. The
low-level convergence
zone of the meridional
wind (Figure
3) coincides with the ITCZ (Figure 2) and with the limit between the monsoon flow and the Harmattan in Figure 4.
The divergence at an altitude of 15 km and the conver-
gence of the meridional wind at low levels in Figure 3 (the
ITCZ) represent the northern and southern branches of the
Hadley circulation. The northerly winds at upper levels of the right-hand part of Figure 3 represent the initial entrance zone of the subtropical jet in January.
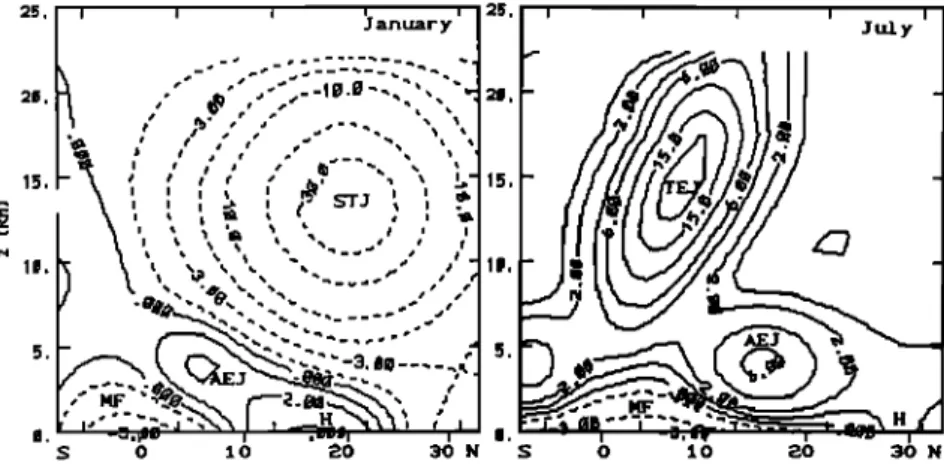
in addition to the seasonal shift of the Hadley cells and the ITCZ we have also incorporated the seasonal variations of the West African low- and high-level jets. Figure 4 shows the initial representations in July of the African easterly jet
(AEJ) (with maximum
wind speeds
of 8 m s -1 at 15øN
and an
altitude
of 4 km), the tropical
easterly
jet (TEJ) (24 m s -1,
8øN, 15 km altitude), and a low-level easterly jet in the south
(5 m s -1 5øS 4 km altitude).
In January
the TEJ is
suppressed owing to the reversal of the temperature gradient between the Indian Ocean and the Tibetan plateau, and the intensity of the AEJ is reduced and shifted southward (3 m
S
-1 maximum
wind speed
located
at 5øN and 4 km in
altitude). Also in January, the westerly subtropical jet (STJ)
makes
its appearance
over West Africa (40 m s -1 21øN 13
km in altitude).3.2. The Meteorological Situation
The simulation starts at midnight and lasts 24 hours. Following Fontan et al. [ 1992], we have distinguished among five surface zones: ocean, forest, savanna, steppe, and
desert. The associated latitudinal variations for latent and
sensible heat fluxes have been represented by analytical functions of the horizontal position. Time variations of those
25 2i•
15
RENARD ET AL.: CLOUDS TRANSPORT IN WEST AFRICA 12,877
$ 0 10 •0 :30 N
Figure 4. Vertical cross sections of the initial zonal wind showing the location of the main African jets (African easterly jet, south tropical jet, and tropical easterly jet) and the monsoon flux, the Harmattan flux
in the low levels. January and July are represented.
surface fluxes reproduce the diurnal cycle: slightly negative
values of sensible heat fluxes and vanishing latent heat fluxes are assumed during the night. A sinusoidal variation during the day leads to maximum heat fluxes at noon time. These maxima are deduced from Da Fonseca Lyra [1990] and Cautenet et al. [1992] and are indicated in Table 2.
The diurnal evolution of the meridional wind and the zonal
wind after 9 hours is presented in Figures 5 and 6. A comparison of Figures 4 and 6 shows that the essential features of the zonal wind change little during the course of
the simulation. Only some details evolve from the initial
state: the low-level easterly jet is accelerated, the high-level
jets are slowed down, and in July, high-level weak westedies
appear in the northern part of the domain.
The northern and the southern Hadley cells, represented oy the meridional wind, change very little over that time period (Figures 3 and $), and the position of the ITCZ remains stationary.
The stationarity of this meridional circulation has been
obtained
using
the forcing
term Ff in (7) in the inner
parts
of
the domain. This forcing term also regulates the intensity of
the meridional wind in the Hadley cells.
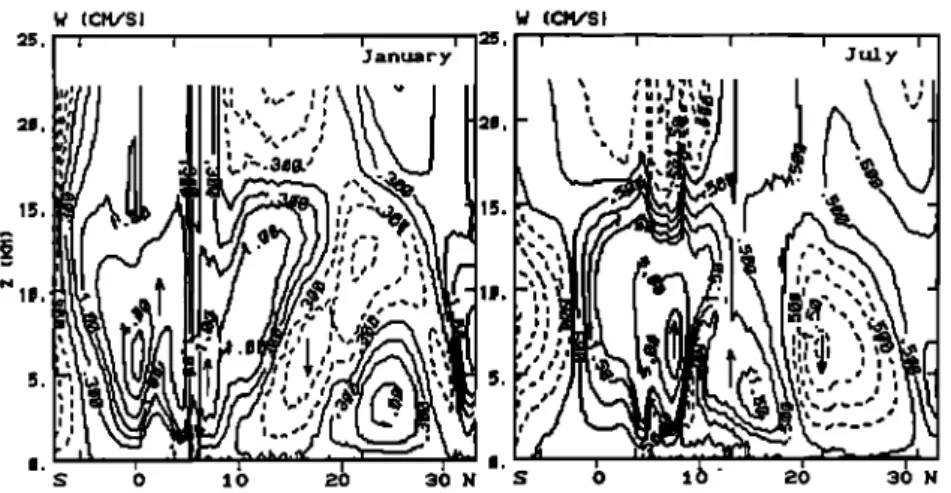
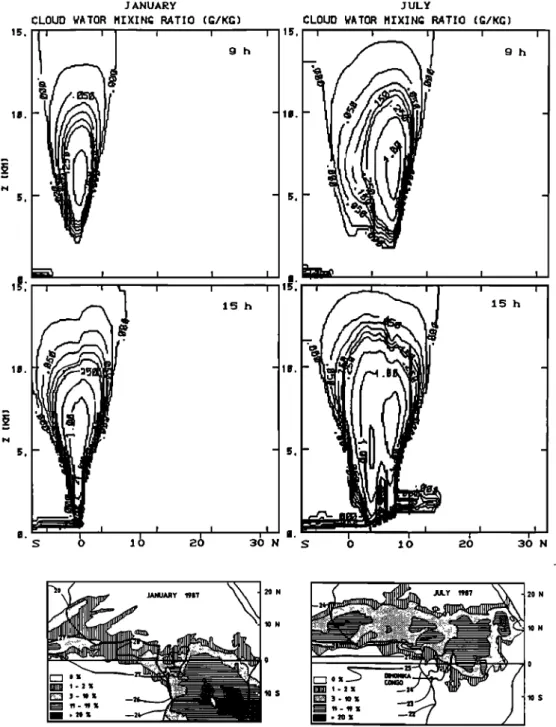
Updrafts occur near the equator in January and near 8øN in July in association with the ITCZ (Figure 7). In those
regions, cloud masses of great vertical extent begin to form
by 9 hours (Figure 8) and reach a state of maximum
development at 15 hours. The cloudy region extends latitu-
dinally from 2øS to 17øN in July and from 5øS to 5øN in
January, in good agreement with the location of cloud tops
over West Africa, as determined by IR satellite imagery [Lacaux et al., 1992]. The seasonal differences in cloud
water mixing ratios obtained at 15 hours indicate a greater cloud production mechanism in July and are consistent with
enhanced convective activity observed during the rainy
season.
In July we also notice the formation of stratified clouds at 15 hours from 5øN to 17øN at 2-km height associated with weak vertical ascents within the ITCZ at low levels (Figure
7). Moreover, the convective activity in July is not restricted
to 8øN but extends from 2øN to 8øN, as can be seen from the cloudy masses at 15 hours in Figure 8 and on vertical velocities fields in Figure 7 at 9 hours. In fact, updrafts develop in the 2øN-5øN zone in July during the afternoon in response to the PBL convergence in the low levels near the
limit between the ocean and the forest. These features are in
agreement with the location of cloud tops, as determined by
Lacaux et al. [1992]: convective activity extends farther in latitude in July than in January. This convective diurnal evolution highlights the fact that we really attempt in this
paper to reproduce the transport of an inert tracer during a
typical day of January or July with an initial state deduced from climatological averages.
Apart from a region of small upward vertical motion at 27øN in January due to friction effects and convergence of the meridional wind (Figure 6) the northern part of the
domain is dominated by subsidence within the northern
branch of the Hadley cell both in July and in January (Figure 7).
In concluding our discussion of this section, we note that the computed fields are mean values over the horizontal grid
space and do not represent the actual highly variable fields
associated with the real and individual convective clouds.
Table 2. Surface Maximum Latent and Sensible Heat Fluxes at 12 hours and Friction
Velocity for the Different Surface Zones With Indication of Their Latitudinal Locations
Zone Definition Ocean Forest Savanna Steppe Desert
Maximum sensible heat flux, W m -2 5 300 400 300 400 Maximum latent heat flux, W m -2 50 300 200 100 5
Friction
velocity,
m s -•
0.02
0.6
0.4
0.4
0.2
12,878 RENARD ET AL.' CLOUDS TRANSPORT IN WEST AFRICA
Figure 5. Vertical cross sections of the meridional wind after 9 hours of model time in January and July.
For example, the mean vertical velocity in the convective
zone in July during
the afternoon
reaches
0.5 m s -1. This
value is lower than the 10 m s -1 of each individual cumu-
lonimbus cloud but represents the mean vertical transport due to the actual clouds and is sufficient to form the cloudy
masses we obtained. Despite this fact, the computed fields (in particular the vertical velocity and the cloud fields) appear to be in agreement with the observed mean ones [Burpee, 1972; Reed et al., 1977; Dettwiller, 1965; Newell
and Kidson, 1984]. This comparison with observations sug-
gests that our model provides a reasonable depiction of the mean transport of trace gases in the convective zones of
West African circulations.
4. The Inert Tracer Experiment
4.1. ResultsWe now show how the West African circulations de-
scribed above affect the transport of a passive tracer such as
carbon monoxide which has a very long residence time in the atmosphere. The initial vertical profile of the tracer is
uniform over the entire domain and decreases exponentially with altitude, z (in meters), with an initial ground concentra- tion of 400 ppb:
(z)
C(z)
= C(0)
exp - 2000
(17)
This ground concentration has been chosen to simulate the
occurrence of savanna bush fires described by Delmas et al. [1991].
The temporal evolution of the tracer concentration C(y,
•,, t) follows the equation
acrC OUC avc 1 a(½rC•r' v)
at ax ay •r' av
+ •rFH,c + ½rFv,c
(18)
where F H, c represents
the horizontal
diffusion
term and
Fv, c the vertical turbulent
mixing effects
of the planetary
boundary layer. Hence no chemical source or sink terms appear with the tracer. The five terms from left to right on
the right-hand side in (18) will be denoted C l, C2, C3, C4,
C5 in the following to make a term analysis of the different
contributions of the tracer redistribution. Equation (18) is
solved at each time step (40 s) using the instantaneous wind
fields.
Figure 9 shows a two-dimensional cross section of the
i I I i
Ju_l. y
0 2 0 •0 30 N
RENARD ET AL.: CLOUDS TRANSPORT IN WEST AFRICA 12,879
W (CH/S I W (CM/$ I
Figure 7. Vertical cross sections of the vertical velocity after 9 hours of model time. The vertical
updrafts
have
a maximum
of 7 cm s -• in January
and 13 cm s -• in July, respectively.
inert tracer concentration after 24 hours of simulation in
January and in July. We have indicated with dashed vertical
lines two particular latitudes (2øN and 10øN) that have been
selected because of their relative location versus the ITCZ,
different between the dry and the wet seasons.
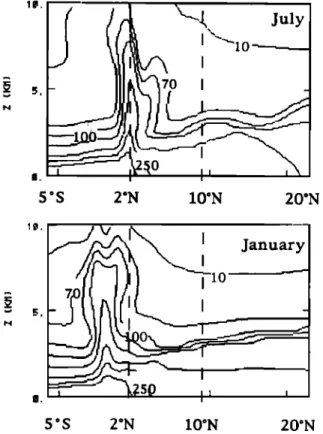
In the low levels and independently of the season the
tracer is mixed by the PBL effects (term C5). This mixing is more pronounced and more extended vertically over the continent (northward of 5øN) than over the ocean (south- ward of 5øN), as can be seen from Figure 9. This effect of
mixing is maximum, in fact, over the warm and sunny regions of the desert: in Figure 9 the concentration isocon-
tour 100 ppb reaches 4 km in altitude and isocontours
become more closely packed upward.
But the most important feature of the tracer transport in
the low levels is its horizontal advection toward the ITCZ
(term C2). This advection is due to the low-level parts of the
Hadley cells: the meridional wind (Figure 5) converges
toward the ITCZ region, advecting the tracer from the north,
southward and the tracer from the south, northward. In
Figure 9 we see that the convergence zone is characterized
by an enhancement in the tracer concentration at a constant
altitude (around 1 km) at 0øN in January and 3øN-5øN in July. This advection toward the ITCZ is also responsible for
the reduction of the tracer concentration from the initial 400
ppb value during the 24-hour simulation near the ground in the northern part of the domain (Figure 9). In the southern
regions this surface decrease even dominates the depletion
due to the vertical mixing in the PBL.
The tracer that has been horizontally advected in the ITCZ
is then transported upward by the updrafts in the boundary layer convergence zone and by the clouds. As already mentioned, the mean vertical velocity may reach up to 0.5 m
s-] in the afternoon
in July
in the cloudy
masses.
If we had
considered only the boundary layer effects (term C5), the
tracer would have remained below 3 or 4 km height, as previously described by Chaumerliac et al. [ 1992] and as can
be deduced from the contrasting vertical evolution of the
tracer between the cloudy and the noncloudy regions. The vertical transport by clouds (term C3), related to latent heat
release effects, is the most efiScient process and is shifted
northward from January to July. The term C3 in (18) is
strengthened too by the forcing convergence of the Hadley
cells (v in (10) is also due to (OVdiv/Oy)). The mean vertical
transport of the tracer is clearly indicated in Figure 9 by
enhanced values between 4 km and 8 km in altitude near the
equator in January and 2øN-5øN in July. These regions of high concentration are related to the presence of cloudy
masses (Figure 8) and are associated with the ITCZ.
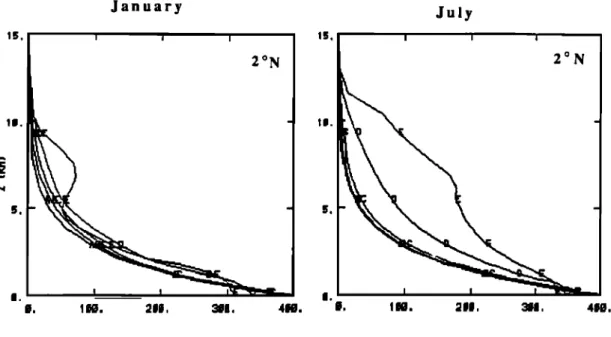
For further insights of this vertical transport, we now present in Figure 10 the associated temporal evolution of the vertical profile of the tracer for two different latitudes (2øN
and 10øN) already indicated in Figure 9.
At 2øN latitude in July the vertical profile is for the most part within the ITCZ cloudy regions where strong mean
vertical
velocities
during
the day (up to 0.5 m s-1) lead
to an
increase in the tracer concentration in the middle and upper
levels. Concentration amounts at 7-8 km in altitude are
nearly half of the initial ground concentration. Within the
ITCZ there is a strong convergence of the meridional wind
which causes horizontal advection of the tracer at lower
levels, as already observed in Figure 9, thereby resulting in no net depletion of tracer concentration in the planetary
boundary layer.
In January the computed profiles at 2øN are located close to the edge of the cloudy zone. Therefore the maximum at 8
km and the minimum at 5 km are the results of a kind of
cloud detrainment. It is inappropriate here to talk about cloud detrainment since we represent only one single cloudy
mass, but this effect is a result of the vertical shear of the meridional wind in the cloudy regions of the ITCZ (Figure 5)
and thereby has the appearance of a detrainment effect. At 5
km the meridional wind converges toward the ITCZ, carry- ing the tracer from low-concentration regions to the cloudy
region and the updraft region of the ITCZ. However, at 7 km the meridional wind diverges and just the opposite effect
occurs.
This vertical shear in the meridional wind leads in January
to a larger area of high concentration at 7 km than at 5 km
compared to July, as seen in Figure 9, and to an unusual
vertical profile of the tracer close to the edge of the cloudy
masses of the ITCZ at 2øN (Figure 10). This profile is unusual
since a maximum of concentration appears at 7-8 km just
12,880 RENARD ET AL ß CLOUDS TRANSPORT IN WEST AFRICA
15.
J ANUAi•Y
CLOUD WATOR MIXIN• RATIO (8/KG)
I I I I I g h m • I ! ! t lõh JULY
CLOUD WATOR MIXING RATIO (Q/KG)
__• • •J • 9 h
,__ ! ! i lõh S 0 10 20 30 N $ 0 10 20 30 N 20 N 10 N 0 10 SFigure 8. Vertical cross sections of the bulk cloud water mixing ratios after 9 and 15 hours of model time in January and July. The latitudinal extensions of cloudy regions are compared with satellite data (bottom
part of the figure) presented by Lacaux et al. [1992].
directly transported from the ground to 7-8 km at a constant latitude. In fact, the tracer is first advected horizontally near the ground in the ITCZ, then it is lifted upward within the
ITCZ at 0øN, and finally released from the ITCZ at 7-8 km
near 2øN by the northward meridional wind. The efficiency of this mechanism depends upon the distance from the core
of the ITCZ. The meridional wind needs more than 24 hours to advect the tracer at 10øN from the ITCZ at 7-8 km in
January, thus no maximum appears in Figure 10 at 10øN in
January. In July the northward shift of the ITCZ reduces the distance from the 10øN latitude and the core of the ITCZ,
hence a maximum in the upper part of the profile forms at
10øN but with a smaller contrast in comparison with the
situation at 2øN in January. Hence the seasonal variations of the tracer transport are primarily due to the northward shift of the ITCZ and to the increase of convective activity in July.
4.2. Discussion
The inert tracer experiment developed in the present
paper highlights the specific role of dynamics on trace gases emitted by bush fires over West African savannas. Referring to our results, these trace gases may be first advected southward into the ITCZ, then vertically transported by
RENARD ET AL.: CLOUDS TRANSPORT IN WEST AFRICA 12,881
•..,•
"•,
July
o ,
_
,2s,
o
,
I'
5 øS 2'N 10øN 20'N 10. B.January
5'S 2'N 10øN 20øNFigure 9. Vertical cross sections of the tracer concentra- tion after 24 hours of model time in January and July.
convective activity within the ITCZ clouds, and finally, ejected at the high levels of the Hadley cells in a concen- trated layer at 7-8 km in height at the edges of the ITCZ cloudy regions.
In our simulation of January at 2øN the tracer attains high concentrations in the first two kilometers, a local minimum near 5 km, and a local maximum between 6 km and 8 km. Such a vertical distribution has been reported by Marenco et
al. [1990] during the TROPOZ I experiment in December 1987, with vertical cross sections of CO and 03 between 6øS
and 45øN. Our results give a simple and possible explanation for the maximum at 6-8 km in Abidjan (5ø15N-3ø54W) observed by Marenco: this vertical profile may be due to a purely dynamical effect of the global "detrainment" of the cloudy region of the ITCZ by the vertical shear of the
meridional wind after the efficient upward transport of the
biomass burning emissions by convective clouds of the
ITCZ. The fact that 03, which is not a passive tracer,
exhibits the same behavior as CO [Marenco et al., 1990]
implies that the dynamical effects of clouds and the bound-
ary layer convergence of the meridional wind may be the
dominant mechanisms affecting the vertical redistribution of
chemical species in that region.
However, a feature often observed during DECAFE (es- pecially for ozone at low levels over the forest) is a maxi- mum at 2-3 km and a depletion of concentrations near the surface [Marenco et al., 1990; Cros et al., 1991; Andreae et al., 1992]. Such profiles have also been noticed over Ama- zonia (ABLE 2A, Garstang et al. [1988]). In that case, Pickering et al. [1991] have suggested that the existence of
storm clouds "may temporarily prevent the daytime in-
crease of ozone concentrations in the mixed layer, because deposition to the surface may exceed the net photochemical production rate under the cloud." In the African case, Cros et al. [1991] and Fontan et al. [1992] have suggested that at the juncture of the northern trade winds and the monsoon flow, the dry and polluted air advected by the northern trade winds surmounts the clean air of the monsoon flow [Cros et al., 1991]. Hence the surface depletion may also follow the sloping frontal surface of the ITCZ.
Our numerical simulations do not reproduce such deple- tion near the ground in the first two kilometers of the polluted layer. If deposition effects and photochemical ef- fects are responsible for this depletion, they cannot be accounted for since we consider only an inert tracer. For the
depletion by the sloping frontal surface of the ITCZ this
effect is inhibited by the initial uniform horizontal concen- trations of the tracer used in this paper.
5. Conclusion
In this paper our aim was to study the influence of West African circulations at 0 ø longitude on the redistribution of atmospheric chemical compounds. We used a two- dimensional primitive equation model to simulate the pri- mary features of observed meteorological fields. The loca- tion and spatial extent of cloud systems associated with the ITCZ were well represented by the model simulations, thereby providing a proper framework for the realistic transport of chemical species.
We focused on the vertical and horizontal transport of an inert tracer to highlight the specific role of dynamics, espe- cially mean cloud dynamics on the distribution of chemical species in the tropical troposphere.
We have shown that an inert tracer is transported effi- ciently from the surface to the middle and upper troposphere by the mean vertical velocity within the cloudy masses of the ITCZ. Furthermore, we found that the vertical shear of the meridional wind nominally associated with the presence of
the Hadley cell within the cloudy regions of the ITCZ lead to
a maximum in the chemical tracer concentration at an
elevation of 6 to 8 km at the edges of the ITCZ. This layer is clearly separated from the lower maxima near the ground by a layer of minimum tracer concentration at an elevation of 5 kin. These results are in good agreement with other refer- ences in the literature and suggest that the lower branch of the northern Hadley cell advects the chemical species emit- ted by bush fires during the dry season of the northern hemisphere toward the ITCZ. Later, the vertical motions
and the meridional wind associated with the ITCZ act to
increase the concentrations at higher levels in the atmo- sphere.
By comparing results obtained in January and July, we
have also shown that the redistribution of the inert tracer is
closely related to the seasonal migration of the ITCZ. This work represents merely a preliminary step in the study of the redistribution of chemical species by West African circula-
tions and ITCZ clouds. Further developments should in-
clude chemical and depositional processes in order to obtain more realistic and quantitative comparisons with experimen-
12,882 RENARD ET AL.: CLOUDS TRANSPORT IN WEST AFRICA 15. lg.
January
i i i 2øNJuly
I i "i 2øN t J, ia. :2 gg. 3gll. 4lg. l;. I •. :2 Ill. 391. 41;g. 15. Ig. I i, i IOøN i i i 10øN l;. t •. :2 II. •l. 4lg. g. I •. :2 II. 391. 41;g.(ppb)
(ppb)
Figure 10. Vertical profiles for an inert tracer with a homogeneous initial ground concentration of 400
ppb all over the model domain.
These profiles
are drawn for 2øN and 10øN
in latitudes,
in January
and July.
Curve A is the initial profile and curves B, C, D, and E are the profiles at 6, 12, 18, and 24 hours of model time, respectively.
Appendix
The forcing meridional
wind Vdcf + Vdiv
has been selected
to model two main features of the West African circulations:
the convergent and divergent zones of the Hadley cells and the entrance or exit zones of the zonal jets.
In section 3.1 and in Figure 3 the resulting meridional wind
has been already presented.
Its divergent
part, Vdiv, is, in
fact, the superposition
of two different divergent fields
associated with the low-level convergence and the high-level divergence, respectively, of the ITCZ. Each of those fields has the same following form:
Vdiv
--
Vc(t,)th(Y-Yc(:'))
•Yc (A1)where th(x) is the hyperbolic tangent of the variable x.
Vc(v) is the vertical profile of the wind intensity. Vc(v) is
negative everywhere and vanishes above 7 km in altitude forthe low-level convergence field: y c(v) is the center of
convergence or divergence at level :, and follows the vertical
slope of the ITCZ under 3.5 km (Figure 3); and •Yc is the
length of the divergent zone.RENARD ET AL.' CLOUDS TRANSPORT IN WEST AFRICA 12,883
onal wind Vde f is the superposition of two different defor-
mation fields associated with the entrance or exit zones of
the low-level jet AEJ or of the high-level jet (TEJ or STJ, depending on the season which is considered). To make each
of these meridional winds Vde f nondivergent, we have asso- ciated a zonal wind Ude f satisfying (5). Generally, the deformation field of Bergeron is chosen as Ude f = -ax, Vde f = a(y - y a), where y a is the center of deformation and
a the deformation parameter. Unfortunately, this formula-
tion leads to nonrealistic high values of V de f far from the center of deformation and prevents from variations of the intensity of the deformation with height.
To reproduce more precisely the horizontal and vertical location of the entrance or exit zones of the jets, we have chosen the following form for each deformation field:
-
th
1 th
2 y Ya(•'
= • - (A2)
,• Y a ,• Y a
= - th (A3)
where Va(v) represents the vertical profile of the wind inten- sity, hence the deformation intensity, y a(v) the center of deformation at level v,/Sxa and/Sya the longitudinal (zonal) and
the transverse (meridional) lengths of the deformation zone,
respectively. Udef, Vde f are solution of (5) in the v vertical
coordinate system for the variables U = ,ru and V = z-v.
Following the classical formulation of Bergeron and its use in the semigeostrophical approximation [Hoskins andBretherton,
1972], we have assumed that Sde f vanishes in the cross-section plane of the model (x = 0 in (A3)). This assumption ensures
simplifications in the calculation of the initial zonal wind.
Acknowledgment. The authors would like to thank R. Rosset for
many informative discussions we had concerning this work.
References
Andreae, M. O., A. Chapuis, B. Cros, J. Fontan, G. Helas, C. Justice, Y. K. Kaufman, A. Minga, and D. Nganga, Ozone and Aitken nuclei over equatorial Africa: Airborne observations dur- ing DECAFE 88, J. Geophys. Res., 97, 6137-6178, 1992. Burpee, R. W., The origin and the structure of easterly waves in the
lower troposphere of North Africa, J. Atmos. Sci., 29, 37-50,
1972.
Cadet, D., and N. O. Nnoli, Water vapour transport over West
Africa and the Atlantic Ocean during summer 1979, Q. J. R.
Meteorol. Soc., 113,581-602, 1987.
Cautenet, S., and R. Rosset, Numerical simulation of sea breezes with vertical wind shear during dry season at Cape of Three Points, West Africa, Mon. Weather Rev., 117, 329-339, 1989. Cautenet, G., M. Legrand, and S. Cautenet, Thermal impact of
Saharan dust over land, I, Simulation, J. Appl. Meteorol., 31, 166-179, 1992.
Chatfield, R. D., and P. J. Crutzen, Sulfur dioxide in remote oceanic
air: Cloud transport of reactive precursors, J. Geophys. Res., 89,
7111-7132, 1984.
Chatfield, R. D., and A. C. Delany, Convective links biomass burning to increased tropical zone: However, models will tend to overpredict 03, J. Geophys. Res., 95, 18,473-18,468, 1990. Chaumerliac, N., R. Rosset, M. Renard, and E. C. Nickerson, The
transport and redistribution of atmospheric gases in regions of frontal rain, J. Atmos. Chem., 14, 43-51, 1992.
Cros, B., D. Nganga, R. Delmas, and J. Fontan, Tropospheric
ozone and biomass burning in intertropical Africa, in Global Biomass Burning, edited by J. Levine, pp. 42-45, MIT Press, Cambridge, Mass., 1991.
Crutzen, P. J., A. C. Delany, J. Greenberg, P. P. Haagenson,
L. Heidt, R. Lueb, W. Pollock, W. Seiler, A. Wartburg, and P. Zimmerman, Photochemically produced ozone in the emission from large-scale tropical vegetation fires, J. Geophys. Res., 90, 2425-2429, 1985.
Da Fonseca Lyra, R., Dynamique et transferts dans et au-dessus des couverts forestiers, th•se d'universit•, Toulouse, France, 1990. Davies, H. C., Limitations of some common lateral boundary
schemes used in regional NWP models, Mon. Weather Rev., 111, 1002-1012, 1983.
Delmas, R., On the emission of carbon, nitrogen and sulfur in the atmosphere during bushfires in intertropical savannah zones, Geophys. Res. Lett., 9, 761-764, 1982.
Delmas, R., P. Lodjani, A. Podaire, and J. C. Menaut, Biomass
burning in Africa: An assessment of the annually burned biomass,
in Global Biomass Burning, edited by J. Levine, pp. 60-67, MIT
Press, Cambridge, Mass., 1991.
Dettwiller, I., Note sur la structure du FIT bor6al sur le Nord-Ouest de l'Afrique, La M•t•orologie, VI, 80, 337-347, 1965.
Fontan, J., A. Druilhet, B. Benech, Lyra, R., and B. Cros, The DECAFE experiments: Overview and meteorology, J. Geophys. Res., 97, 6123-6136, 1992.
Garstang, M., et al., Trace gas exchanges and convective transports over the Amazonian rain forest, J. Geophys. Res., 93, 1528-1550,
1988.
Harris, R. C., et al., The Amazon Boundary Layer Experiment (ABLE 2A), Dry season 1985, J. Geophys. Res., 93, 1351-1360,
1988.
Hoskins, B. J., and F. P. Bretherton, Atmospheric frontogenesis models' Mathematical formulation and solution, J. Atmos. Sci., 29, 11-37, 1972.
Hsie, E. Y., R. A. Anthes, and D. Keyser, Numerical simulation of frontogenesis in a moist atmosphere, J. Atmos. Sci., 41, 2581- 2594, 1984.
Kessler, E., On the redistribution and continuity of water substance
in atmospheric circulations, Meteorol. Monogr., 10(32), 84, 1969. Lacaux, J.P., R. Delmas, G. Kouadio, B. Cros, and M. O. Andreae,
Precipitation chemistry in the Mayorobe forest of equatorial
Africa, J. Geophys. Res., 97, 6195-6206, 1992.
Mahfouf, J. F., E. Richard, P. Mascart, and E. C. Nickerson, A comparative study of various parameterizations of the planetary boundary layer in a numerical mesoscale model, J. Clim. Appl. Meteorol., 26, 1671-1695, 1987.
Marenco, A., J. C. Medale, and S. Prieur, Study of tropospheric ozone in the tropical belt (Africa, America) from STRATOZ and TROPOZ campaigns, Atmos. Environ., 24(A), 2823-2834, 1990. Newell, R. E., and J. E. Kidson, African mean wind changes
between Sahelian wet and dry periods, J. Climatol., 4, 27-33,
1984.
Nickerson, E. C., E. Richard, R. Rosset, and D. R. Smith, The numerical simulation of clouds, rain and airflow over the Vosges
and Black Forest Mountains' A meso-/3 model with parameterized
microphysics, Mon. Weather Rev., 114, 398-414, 1986.
Pickering, K. E., Thompson, A.M., J. Scala, W. K. Tao,
J. Simpson, and M. Garstang, Photochemical ozone production in tropical squall lines convection during NASA Global Tropo- spheric Experiment/ABLE 2A, J. Geophys. Res., 96, 3099-3114,
1991.
Reed, R. J., D.C. Norquist, and E. E. Recker, The structure and properties of African waves disturbances as observed during phase III of GATE, Mon. Weather Rev., 105, 317-333, 1977. Richard, E., and N. Chaumerliac, Effects of different rain parame-
terizations on the simulation of mesoscale orographic precipita- tion, J. Appl. Meteorol., 28, 1197-1212, 1989.
Therry, G., and P. Lacarr•re, Improving the eddy kinetic energy model for planetary boundary layer description, Boundary Layer Meteorol., 25, 63-88, 1983.
S. Cautenet, N. Chaumerliac, and M. Renard, LAMP/OPGC, Universit6 Blaise Pascal, 24, Avenue des Landais, 63177 Aubiere Cedex, France.
E. C. Nickerson, National Oceanic and Atmospheric Administra- tion/FSL, •Boulder, CO 80303.
(Received February 25, 1993' revised February 11, 1994; accepted February 11, 1994.)