HAL Id: hal-02352299
https://hal.archives-ouvertes.fr/hal-02352299
Submitted on 6 Nov 2019HAL is a multi-disciplinary open access
archive for the deposit and dissemination of sci-entific research documents, whether they are pub-lished or not. The documents may come from teaching and research institutions in France or abroad, or from public or private research centers.
L’archive ouverte pluridisciplinaire HAL, est destinée au dépôt et à la diffusion de documents scientifiques de niveau recherche, publiés ou non, émanant des établissements d’enseignement et de recherche français ou étrangers, des laboratoires publics ou privés.
Exploring the Impact of Zeolite Porous Voids in Liquid
Phase Reactions: The Case of Glycerol Etherification by
tert-Butyl Alcohol
C Miranda, J Urresta, H Cruchade, A Tran, M Benghalem, A Astafan, P.
Gaudin, T Daou, A. Ramírez, Y Pouilloux, et al.
To cite this version:
C Miranda, J Urresta, H Cruchade, A Tran, M Benghalem, et al.. Exploring the Impact of Zeolite Porous Voids in Liquid Phase Reactions: The Case of Glycerol Etherification by tert-Butyl Alcohol. Journal of Catalysis, Elsevier, 2018, 365, pp.249-260. �10.1016/j.jcat.2018.07.009�. �hal-02352299�
Exploring the Impact of Zeolite Porous Voids in Liquid Phase
1
Reactions: The Case of Glycerol Etherification by tert-Butyl
2
Alcohol
3 4
C. Mirandaab, J. Urrestaa, H. Cruchadeb, A. Tranb, M. Benghalemb, A. Astafanb, P.
5
Gaudinb, T. J. Daouc, A. Ramírezd, Y. Pouillouxb, A. Sachse*b, L. Pinard*b
6 7
a
Catalysis and Processes Research Laboratory (LICAP) - University of Valle, Meléndez
8
University City, Calle 13 # 100-00, Cali - Colombia.
9
b
Institut de Chimie des Milieux et Matériaux de Poitiers (ICM2P), UMR 7285 CNRS, 4
10
Rue Michel Brunet, Bâtiment B27, 86073 Poitiers Cedex – France.
11
c
Université de Haute Alsace, Université de Strasbourg, Axe Matériaux à Porosité
12
Contrôlée (MPC), Institut de Science des Matériaux de Mulhouse (IS2M), UMR CNRS
13
7361, ENSCMu, 3 bis rue Alfred Werner, 68093 Mulhouse Cedex – France.
14
d
Catalysis Group, Department of Chemistry, University of Cauca, Carrera 3 No. 3N-100
15
Popayán-Colombia.
16
*Corresponding authors: alexander.sachse@univ-poitiers.fr;
ludovic.pinard@univ-17 poitiers.fr 18 19 20 21 22 23 24 25 26
Abstract
27
The role of acidity (nature, concentration, strength) and textural properties in the 28
etherification of glycerol with tert-butyl alcohol was studied for a wide range acid catalysts, 29
such as Amberlyst® 15, silica, alumina, silica alumina and four type of zeolite, i.e. FAU, 30
MOR, *BEA and MFI. The etherification of glycerol by tert-butyl alcohol is a 31
thermodynamically limited reaction that occurs through a successive reaction sequence. We 32
found major evidence that glycerol etherification is not only a function of the amount of 33
Brønsted acid sites, but that it further proceeds via a product shape selectivity mechanism. 34
Indeed, the formation of di-substituted ethers appears at very low conversions for zeolites 35
compared to meso- and macroporous acid catalysts. *BEA and MFI zeolites feature similar 36
confining voids and resulting thus in similar intrinsic acid strengths (as proved by n-hexane 37
cracking), but differ in the connectivity (4 vs. 6 channels) and access to these voids (0.54 38
vs. 0.67 nm), which leads to diffusion issues, notably for the MFI zeolite. 39
40
Key words: glycerol etherification, zeolites, confinement effect, auto-inhibition effect,
41
Brønsted acidity, product shape selectivity. 42 43 44 45 46 47 48 49 50 51 52 53
1. Introduction
54
Glycerol is employed in over 1500 industrial applications and amounts to an annual 55
production of ca 160.000 tons [1]. By the year 2020, it is estimated that glycerol production 56
will exceed global demand by a factor of six [2]. Hence, the development of efficient 57
strategies for the glycerol conversion into value-added products represents a major issue as 58
far as glycerol disposal and the dealing with surplus production is concerned. A sustainable 59
strategy to valorize the polyol is its conversion into glycerol ethers, with widespread 60
applications, such as oxygenated fuel additives, intermediates in the pharmaceutical 61
industry, and non-ionic surfactants [3-5]. 62
The etherification between two alcohols is promoted through acid catalysis. The use 63
of homogeneous catalyst such as strong acids (e.g. H2SO4) [6] represents major
64
inconveniences causing corrosion and environmental issues. Solid acid catalysts are an 65
indisputable mean to overcome these drawbacks. A prominent family of solid acid catalyst 66
are ion-exchanged resins. Yet, these resins present important limitations, such as low 67
surface area and a poor thermal stability [7]. Zeolites are a class of solid acids that feature 68
strong Brønsted acidity with high thermal and mechanical stability; making them very 69
promising solid catalysts for the glycerol etherification [7, 8]. 70
Gonzáles et al. [9] carried out the etherification of glycerol with tert-butyl alcohol 71
(TBA) at 348 K, on three commercial acidic zeolites: *BEA, MOR and MFI with 72
respective Si/Al molar ratios of 10, 6.5 and 20. The authors evidenced that *BEA zeolite 73
allowed to achieve highest conversion (75% with catalyst loadings of 5wt%) for this 74
transformation, which was further confirmed by others [10,11] and its activity can further 75
be improved through post-synthetic modifications, such as desilication (using alkaline 76
allows for higher glycerol conversions and selectivities of di- and tri-substituted ethers. The 78
most efficient way to guarantee an important access of glycerol and tert-butyl alcohol to 79
protonic sites is to decrease the diffusion path length. Indeed, Simone et al. [13] 80
synthesized MFI based nanosponge and nanosheet, featuring structured hierarchical 81
systems of connected pores on different length scales. The authors observed, that the 82
hierarchical catalysts are both more active and selective towards the formation of higher 83
substituted ethers compared to the purely microporous ones. 84
The location of protonic sites within the pore system influences the catalyst activity, 85
selectivity and stability. This is particularly the case with zeolite materials where the size of 86
micropores is often close to those of reactant(s), product(s) and reaction intermediate(s), 87
which is at the origin of what is referred as molecular shape selectivity (MSS). MSS results 88
from constraints arising from the interaction of molecules or intermediates within the 89
zeolite channels or cages of molecular size [14-15]. Reactant or product selectivity can be 90
observed when reactant or product molecules diffuse at very different rates within the 91
zeolite micropores as a function of their sizes. Moreover, the formation of bulky transition 92
states can be limited or inhibited within cages or channel intersections (restricted transition 93
state selectivity). Despite, these constraints positive interactions (such as confinement, 94
solvation [16]) can further occur between reactant and intermediate molecules and the 95
intracrystalline zeolite pore volume, which affect the rates of catalytic reactions. Therefore, 96
the differences in activity of zeolite catalysts can result from the solvating characteristics of 97
their channels, channel intersections and cages. 98
The aim of this study is to evaluate the impact of the zeolite voids and void 99
interconnections on the activity, selectivity and stability of the liquid phase glycerol 100
etherification with tert-butyl alcohol. For this purpose, various types of solid acid catalysts, 101
such as Amberlyst® 15, silica, alumina, silica alumina and four series of zeolites (i.e. MOR, 102
FAU, *BEA and MFI) with diverse Si/Al molar ratios and morphologies were compared. 103
2. Experimental section
104
2.1 Chemicals and catalysts
105
Glycerol (99%) and tert-butyl alcohol (99.4%) were obtained from Acros Organics. 106
The commercial zeolites and silica were supplied from Clariant, Zeolyst, PQ zeolites and 107
Sigma-Aldrich (Table A1 in the supporting information). The catalysts which were 108
previously synthetized [17-22] and used in other studies are resumed in Table 1 and their 109
reparation procedure reported in the supporting information section A.1 (catalyst synthesis 110
protocol). 111
2.2 Characterization
112
The structural characterization of the synthetized zeolites were carried out by X-ray 113
powder diffraction (XRD) on a PANalytical MPD X’Pert Pro diffractometer operating with 114
Cu Kα radiation (λ = 0.15418 nm) and equipped with an X’Celerator real-time multiple 115
strip detector (active length = 2.122º 2θ). The XRD patterns of the synthesized and 116
modified zeolites are shown in the supporting information (S.I. Figure A2). 117
The morphology, homogeneity and particle sizes were determined using a scanning 118
electron microscope (SEM) (Philips XL30 FEG). Samples were characterized by 119
transmission electronic microscopy (TEM) using a Philips CM 120 microscope equipped 120
with a LaB6 filament. Nitrogen adsorption and desorption measurements were carried out at
121
77 K on a Micromeritics ASAP 2420 apparatus. Prior to analysis, the samples were 122
pretreated at 573 K under vacuum for 15 h. The specific surface area (SBET) was calculated
123
according to the BET method in the relative pressure range of 2 x 10⁻⁴ < p/p0 ≤ 8 x 10⁻² and
nanocrystals), respectively. The microporous volumes (Vmicro) were calculated using the
t-126
plot method. The pore size distributions were determined using a density functional theory 127
(DFT) model applied on the adsorption branch. The total pore volume was calculated at 128
p/p0 = 0.9. The mesopore volume (Vmeso) were determined by the difference between the
129
total pore volume and the micropore volume. 130
The bulk silicon to aluminum molar ratio was determined by X-ray fluorescence 131
(XRF) spectrometry (Philips, Magic X). The framework silicon to aluminum molar ratio 132
was measured by 27Al and 29Si MAS NMR (spectra were recorded at 104.28 MHz on a 133
Bruker advance II 400 MHz spectrometer using a spinning rate of 12 kHz, a pulse length of 134
0.42 ls and a recycle time of 0.58 s) and estimated from infrared spectroscopy 135
measurements on a FT-IR Magna 550 Nicolet spectrometer. The position of the zeolite 136
structure bands (450–1250 cm-1) allows the calculation of the framework aluminum content 137
using the correlation given in the literature in ref [23, 24]. The two techniques used on the 138
*BEA zeolites gave similar results (Table 1). 139
Fourier transform Infrared spectra (FT-IR) of pyridine adsorbed samples were recorded on 140
a Nicolet Magna 550-FT-IR spectrometer with a 2 cm−1 optical resolution. The zeolites 141
were first pressed into self-supporting wafers (diameter: 1.6 cm, ≈ 20 mg) and pretreated 142
from room temperature to 723 K (heating rate of 1.5 K min-1 for 5 h under a pressure of 143
1.33 10−4 Pa) in an IR cell connected to a vacuum line. Pyridine adsorption was carried out 144
at 423 K. After establishing a pressure of 133 Pa at equilibrium, the cell is evacuated at 623 145
K to remove all physisorbed species. The amount of pyridine adsorbed on the Brønsted and 146
Lewis sites is determined by integrating the band areas at respectively 1545 cm-1 and 1454 147
cm−1 and using the following extinction coefficients measured at 293 K: 1545 = 1.13 and
1454 = 1.28 cm mol−1 (Calibration curves in the SI Figure A1). It is worth mentioning that
149
the values of the integrated molar extinction coefficients are close to those found by Dwyer 150
et al. [26], and differ from the typically applied values presented by Emeis [27] (i.e. 1545 =
151
1.67 and 1445 =2.22 cm mol-1). The difference is due to the temperature at which the
152
spectra were recorded. In our case and that presented in ref. [26], they were reordered at 153
293 K, whereas in the publication of Emeis at 423 K. According to Shi and Zhang [28] and 154
Bauer et al. [29], the temperature dependence of extinction coefficient is represented by a 155
simple power law: , where A is the temperature exponent and T0 the
156
reference temperature. It is thus important to ensure for the accurate quantification of BAS 157
and LAS that spectra are recorded at same temperatures used for the determination of molar 158
extinction coefficients.” 159
Thermogravimetric analysis was carried out using a SDT Q600 by heating samples 160
under N2/O2 (4:1) with a ramp of 10 °C/min up to 900 °C.
161
2.3 Model reactions
162
n-hexane cracking : the catalytic tests of the n-C6 cracking were performed in a fixed-bed
163
catalytic reactor. 40 mg of samples was pretreated at 813 K under nitrogen flow for 12 h. n-164
Hexane (99.99 % pure from Sigma Aldrich) was then diluted in nitrogen flow and injected 165
in the reactor at 813 K with a molar ratio of 9. The contact time was fixed to 0.04 s. 166
Injections were obtained using 6 ways valve (Valco Vici 1/16 '' fitting) and analyzed in 167
GC450 gas Chromatography equipped with a Cp-Al2O3/Na2SO4 capillary column (50 m, 10
168
µm) coupled with a FID detector. With fixed-bed catalytic reactors, an exact estimation of 169
the initial activity required extrapolation at zero time-on-stream (TOS) of measurements 170
carried out at relatively short intervals of TOS (1-5 min). However, with an on-line 171
analysis, the interval is determined by the time of this analysis (22 min). The use of a 172
multiposition valve to store the samples allowed overcoming this inconvenience [30]. In the 173
absence of zeolite, the thermal cracking of n-hexane at 813K yielded to less than 0.5% 174
conversion. 175
Glycerol etherification with tert-butyl alcohol: etherification experiments were
176
performed in a batch reactor: a glass stirred autoclave (15 mL) equipped with a temperature 177
controller and a pressure gauge. For the etherification of glycerol with tert-butyl alcohol, 178
the composition of the reaction mixture was: 2.79 g of glycerol, 9.00 g of tert-butyl alcohol 179
(glycerol/tert-butyl alcohol molar ratio of 0.25) and constant catalyst loading of 7.5wt% 180
(referred to glycerol mass). Stirring was fixed for all experiments to 1200 rpm to avoid 181
external diffusion limitations. Zeolites were activated before testing at 473 K under reduced 182
pressure during 12 h and the Amberlyst® 15 (Acros Organics) was washed with methanol 183
and dried in vacuum at 333 K. The reaction temperature was fixed at 363 K and samples 184
were taken at different times for 10 h under autogenous pressure, which can reach up to 5 185
bar. The reaction products were analyzed by gas chromatography using a chromatograph 186
model Agilent Technologies 7820A equipped with an auto-sampler G4567A, DB-WAX 187
column and a FID detector and butanol (Sigma Aldrich) as internal standard. Analyses were 188
carried out with temperature program from 313 to 513 K (with a slope of 293 K min−1), and 189
at the initial and final temperature was maintained for 5 min isothermally. Glycerol, MTBG 190
(3-tert-butoxy-1,2 propanediol and 2-tert-butoxy-1,3 propanediol) and DTBG (2,3-di-tert-191
butoxy-1-propanol and 1,3-di-tert-butoxy-2-propanol) response factors were determined by 192
calibration performed with standards. MTBG and DTBG, which were not available 193
commercially, were isolated from the products of the etherification reaction by column 194
chromatography (1:9 Ethyl Acetate/petroleum ether) and identified by 1H-NMR. 195
Glycerol conversion (%), product selectivity (%) and the molar yield (%), were calculated 196
using the following equations: 197
Glycerol conversion (%) = moles of reacted lycerol
moles of lycerol (eq.1)
198
Product selectivity (%) = moles of o tained product
total moles of product
(eq. 2)
199
Molar yield (%) = moles of o tained product
moles of initial lycerol (eq. 3)
200
The carbon balance with respect to glycerol was 95- 97% for all the catalysts except with -201
Al2O3, which was lower than 90%.
202
Catalyst regeneration and catalytic recycling: after stopping reactions, catalysts
203
were separated from reaction medium by centrifugation and spent catalysts were rinsed 204
with 55.8 mL ethanol at 373 K under 10 MPa nitrogen pressure during 14.5 min using a 205
Dionex ASE 350. The recovered rinsing solution was concentrated by evaporation on a 206
rotavap and characterized by gas chromatography. The amount of confined organic 207
molecules (after rinsing) was inferred through thermogravimetric analysis. Rinsed catalysts 208
were used directly or after calcination (773 K/8 h) in catalytic recycling experiments by 209
applying the protocol described above. 210
3. Results and discussion
211
3.1. Catalyst characterization
212
Table 1 reports the textural and the acidic properties, the crystal size and the bulk
213
and the framework Si/Al molar ratios of the commercial and synthesized acidic catalysts. 214
Catalysts are designated as follows: the type of zeolite is indicated in brackets by using the 215
IZA structural code, the range of crystal size is indicated as subscript, i.e., MC, SC, NC for 216
micrometer, sub-micrometer, nanometer-sized, and NSp, NSh for nanosponge and 217
nanosheet morphologies, respectively. The bulk Si/Al molar ratio is noted as superscript. 218
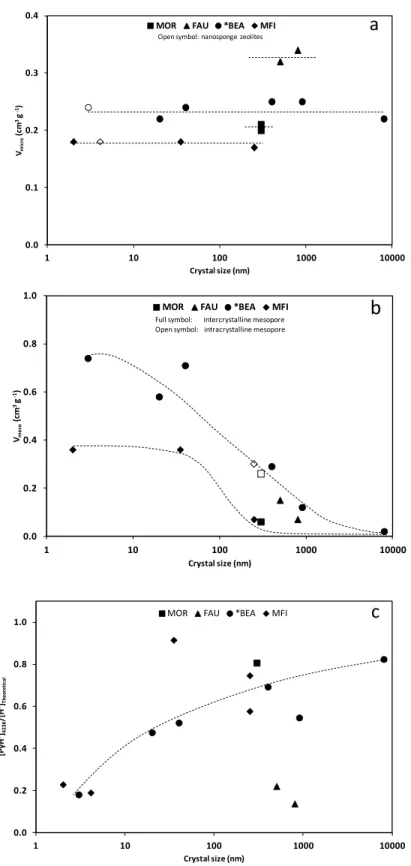
Textural properties: From nitrogen physisorption it was inferred that the silica,
219
alumina and silica-alumina exhibit almost no microporosity. The microporous volume of 220
zeolites (Vmicro) is a “fingerprint” of their framework type. Independently of their crystal
221
size (Figure 1a, Table 1), MOR, FAU, *BEA and MFI zeolites feature Vmicro of 0.20, 0.30,
222
0.23 and 0.18 cm3 g-1, respectively, which are the volumes expected for conventional well 223
crystallized zeolites for these structures. Mesopores can either be of intracrystalline or 224
intergranular nature and mesoporous volume (Vmeso) is a function of both crystal size and
225
shape. For the samples depicted in Figure 1b and Table 1 crystal size decreases with 226
increasing mesoporous volume. Hence, Vmeso is close to zero on conventional micrometer
227
zeolite samples. 228
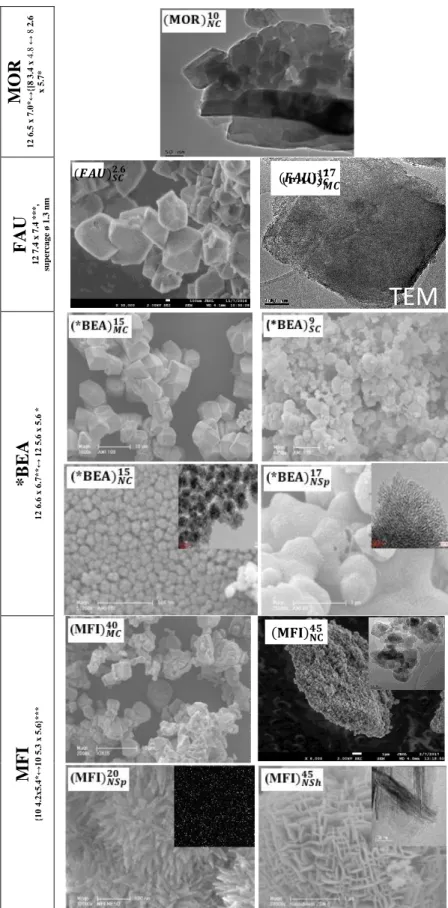
Figure 2 compares the SEM and TEM images of the MOR, FAU, *BEA and MFI
229
zeolites. features crystals with a length ranging from 100 to 500 nm. The SEM 230
image of displays large crystal (600 < ø <1000 nm) with bipyramidal shape. 231
Further, the TEM micrograph of presents large crystals (ø = 500 nm). As far as 232
(* is concerned a truncated bipyramidal shape with crystal sizes ranging from 6 to
233
10 microns can be deduced. (* features aggregated crystals with sizes ranging from 234
300 to 1500 nm. (* , synthesized in alkaline medium at 423 K, consists of crystals 235
with a smaller diameter (100–700 nm). Pseudo-spherical crystals with an average size of 236
40 nm are present for (* , the aggregation of the nanocrystals yield intercrystalline 237
mesospores. *BEA-type zeolite synthesized from a polyquaternary ammonium surfactant 238
exhibits a sponge-like morphology. These nanosponges are formed by randomly aggregated 239
nanoparticles delimited by ordered mesoporous channels. The corresponding TEM image 240
reveals nanometer-sized *BEA units with a short thickness (2 nm) separated by narrow 241
channels with a width of a few nanometers. features crystals with a diameter of 242
250 nm. For sample, the replacement of the conventional structure directing agent
243
(i.e. TPAOH) by a bifunctional organic compound allowed for the formation of lamellar 244
materials, referred as nanosheets. The overall thickness of the lamellar stacking of 245
nanosheets is approximately 20-40 nm, whilst the thickness of individual nanosheets 246
corresponds to 2 nm. The increase of the carbon chain length and the number of quaternary 247
ammonium centers in the structuring agent (C18-6-6-18) leads to a nanosponge morphology
248
(sample ), with nanocrystal sizes ranging from 3.7 to 4.6 nm, with uniform 249
distribution. 250
Acidic properties: A portion of the sulfonic acid groups on the Amberlyst® 15
(A-251
15) are strong enough to protonate and retain pyridine at 423 K. The concentration of the 252
Brønsted acid sites (BAS) amounts to 2300 µmol g-1, which corresponds to half of 253
exchange capacity (between Na+ and H+) provided by the Rohm & Hass (4.7 mmol g-1). 254
This result corresponds well to earlier reports [31], where acid site density on the dry 255
macroreticular resin was measured from calorimetry of NH3 at 353 K. The dry alumina
256
catalyst has only Lewis acid sites (321 µmol g-1) while the SiO2 based material features no
257
acidity able to retain pyridine at 423 K. Yet, the silica-alumina material features some BAS 258
(43 µmol g-1). For the zeolites, the BAS concentration depends on both the Si/Al molar 259
ratio and on their accessibility. For instance, in the case of FAU type zeolites BAS located 260
within the sodalite cages are not accessible by pyridine and do not amount to the bulk 261
probed acidity. Hence, the ratio between the probed acid sites to the theoretical, calculated 262
from the elemental composition of the zeolite ([PyH+]423K/[H+]Theoretical) depends strongly on
263
the zeolite framework (Figure 1c). This ratio is low for FAU type zeolite and 0.8 for MOR, 264
due to acid sites located on the sodalite cages and side pockets, which are inaccessible to 265
the basic probe. On *BEA and MFI zeolites, the portion of acid sites that are able to retain 266
pyridine further depends on the average crystal size and [PyH+]423K/[H+]Theoretical decreases
267
drastically with the crystal size.Yet, Ryoo et al. observed slight or no change in BAS 268
concentration with crystal downsizing [32,33]. They evidenced that a nanospongenous 269
*BEA zeolite (20 nm) contained 7 times more BAS at the external surface compare to a 270
micron-sized *BEA (2 m) [32], and almost 9 times more on MFI-based nano-sheets (2 271
nm) than on large MFI crystals (> 300 nm) [33]. The same research group moreover 272
concluded from various catalytic tests, such as Friedel-Crafts alkylation of benzene, n-273
octane cracking, Claisen-Schmidt condensation and methanol to DME conversion, that the 274
external BAS are weaker than those within the sheets (i.e. internal BAS). This suggests 275
that, the local geometry of protonic sites has a major impact on their activity since the 276
intrinsic strength of protonic sites, as demonstrated by Bokhoven et al. [34], is identical 277
regardless of the zeolite framework. 278
The amount of EFAL sites per unit cell can be concluded through comparing the 279
bulk and the framework Si/Al molar ratios. The quantity of EFAL sites is very high on 280
aluminum rich zeolite, such as FAU, which can easily be removed by thermal treatment 281
(essentially for FAU with a low Si/Al ratio) [35]. The presence of EFAL species can 282
generate Lewis acid sites (LAS). *BEA zeolite features an important portion of LAS (176 – 283
490 µmol g-1) amounting to the total acidity. The total concentration of Lewis acid sites 284
increase with the number of EFAL species. Yet, this correlation is not perfectly linear (SI. 285
Figure A.3) as not all of the EFAL species comprise LAS and can be of cationic or neutral
286
nature, such as Al(OH)2+, Al(OH)2+, AlO+, Al3+, AlO(OH), pseudobohemite and Al2O3
287
[36,37]. Moreover EFAL species can be located within or at the outer surface of the zeolite 288
microporosity. 289
3.2 n-Hexane cracking
290
The acidic properties of the mesoporous silica-alumina and zeolites (FAU, *BEA, MOR 291
and MFI) can be characterized by using the test developed by Mobil almost 40 years ago 292
(i.e. n-hexane cracking at 813 K) [38]. In Figure 3 -Ln (1-X) is plotted as a function of 293
W/F, where X is the initial conversion, W represents the moles of Brønsted acid sites in the 294
reactor and F is the total volumetric flow rate at the reaction temperature (813 K). The 295
activity plot carried out on the medium pore zeolite with large crystals ( ) shows 296
that the n-hexane conversion follows a first-order kinetic model. The main mechanism that 297
initially occurs in our operating conditions (813, K, Pn-C6 = 10 kPa) is monomolecular. The
298
bimolecular route (i.e. autocatalysis) seems limited even with a high partial pressure of n-299
hexane. Independently of the zeolite framework and crystal size, the n-hexane cracking 300
yields C1, C2, C3 C4, C5 hydrocarbons, which are formed in strictly parallel reactions, and
301
relies on a monomolecular cracking mechanism (SI. Figure B1). The initial molar ratios 302
for C5/C1, and C4/C2 (without discriminate between olefin and paraffin) on the different
303
catalysts are shown in (SI. Figure B2) as a function of the initial conversion. On all 304
zeolites, except on the nano-sponges and sheets, C4/C2 ratios are 0.75, which is slightly
305
lower than those reported by Babitz et al. [39] and Lercher et al. [40], which amount to 1-306
0.8 and 0.8, respectively. While the C5/C1 ratios are significantly lower than unity, i.e.
307
about 0.3, they are consistent with the results reported in references [39] and [40]. These 308
ratios below unity indicate the occurrence of secondary cracking. Since the catalytic 309
behavior is identical for all solid acids investigated in the study, we assume that the main 310
kinetic regime involved in n-hexane cracking is mainly monomolecular. It should be noted 311
that the most active catalysts deactivate rapidly (SI. Figure B3); The deactivation is due to 312
the formation of coke. Its kinetics increase with the partial pressure of olefins (P0): the
313
higher the conversion, the higher P0. Moreover, the partial pressure of n-hexane (PnC6) is 25
314
to 100 higher than that used by Babitz et al. [39]. Therefore, in their operating conditions, 315
no deactivation occurs. 316
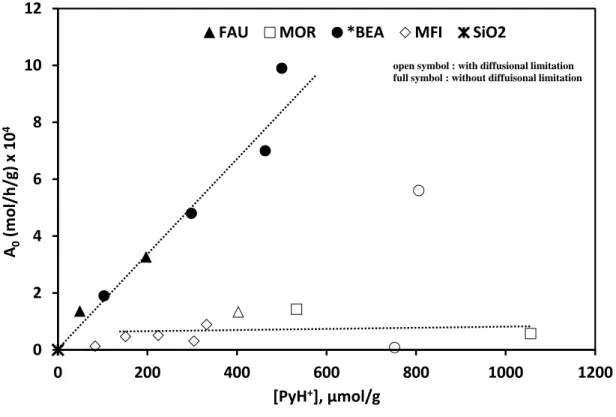
The initial activity is linear to the concentration of BAS probed by pyridine except 317
for , (*
and (*
(Figure 4), which feature a large amount of EFAL
318
species(Table 1). The higher activity on these three zeolites was ascribed to the presence 319
of EFAL through an exaltation of BAS strength [41-43]. Indeed, a study that combined 320
MAS NMR with DFT calculations evidenced the existence of a definite interaction between 321
the Brønsted and Lewis acid sites (LAS), which leads to an increase of the acid site strength 322
in the zeolite framework [44]. Yet, the presence of these "super-acid" sites has been 323
controverted by Iglesia and co-workers [45], who suggested that the apparent increased 324
strength of the BAS would not result from electronic interactions with EFAL species, but 325
rather from a higher solvation effect of zeolite voids attributable to the occlusion of the 326
void space by extraframework Al residues. 327
Despite of a more important amount of LAS on MFI nanosheets (i.e. ) 328
compared to bulk MFI samples, the turnover rate is not exalted, which suggests that on the 329
nanosheets the EFAl species are located on the external surface and not within the 330
micropores. 331
The initial activity per Brønsted acid site (TOF) was plotted as a function of 332
crystallite size (L) multiplied with square root of initial activity: L(A0)^0.5 (Figure 5), this
333
parameter corresponds to a measure of the diffusion constraint [46]. The TOF values (in 334
absence of acidity exaltation or higher solvation effect) are independent of both the zeolite 335
framework and the crystal size, which means that the Thiele modulus (ϕs=L √(k )/(√(De ),
336
even on very large crystals (L > 8000 nm ), is ≤ 1. Therefore, the effective diffusion (De) of
337
n-hexane at high temperature (813 K) within zeolite micropores, even with medium pores is
338
high. Indeed, the effective size of n-hexane (i.e. 0.43 nm) is lower than that of the pore 339
aperture of the MFI framework: 0.54 x 0.56 nm. Haag et al. [46] established that the rate 340
constant for cracking of n-hexane is proportional to the concentration active aluminum sites 341
in HZSM-5 and that it is independent of the crystal size (thus =1). The same authors 342
measured the diffusivity of linear hydrocarbons in a ZSM-5 at 811 K, which is 3 x10⁻⁴ cm2 343
s-1, and can drop by a factor 104 with branched structures [46]. 344
The TOF value on the *BEA zeolite series (except for (* and (* ) is 345
identical and independent of the crystal size (ca. 360-370 h-1). The TOF on zeolites (with 346
confined protonic sites) is more than 180 times higher than the one observed on silica-347
alumina (featuring unconfined BAS, 2 h-1) (SI. Table B.1). This finding was in the past 348
ascribed to a difference in the intrinsic BAS strength [45]. Yet, it has been evidenced that 349
the difference in activity is rather related to confinement and solvation effects within the 350
zeolite voids [47,48]. As demonstrated by Iglesia et al. [48], the strength of BAS in 351
microporous and mesoporous aluminosilicates is identical and the diverse reactivities and 352
selectivities of BAS can readily be attributed to the confining voids of different sizes and 353
connectivities [45]. The similar turnover rates on and *BEA zeolites suggest voids 354
of similar size in these two frameworks. Indeed, for *BEA zeolite (12MR 5.5 x 5.5* ↔ 12 355
7.6 x 6.4**) the pore-limiting diameter and the largest cavity diameter are 0.67 and 0.69 356
nm, respectively, and on MFI zeolite ({10MR 5.3 x 5.6 ↔ 10 5.1 x 5.5}***), channel 357
intersections lead to cage-like voids with a diameter of 0.70 nm. Iglesia et al. [49] observed 358
for *BEA and MFI zeolites identical propene dimerization turnover rates regardless of the 359
number of BAS per unit cell. The turnover rates are lower on sheet-like and nanospongeous 360
zeolites than on the bulk ones (SI. Table B1). This discrepancy is hence not attributed to a 361
different intrinsic strength of the BAS but to the presence of more or less confined BAS. 362
Therefore, assuming that the TOF is the sum of turnover rates of unconfined 363
( = 2 h-1) and confined acidic site (TOFbulk = 360 h-1), it is possible to
364
estimate the proportion of proton sites located within the microporosity: 365
(eq. 4)
366
On (* , , and the percentage of BAS in the microporous voids is 367
63%, 41% and 22%, respectively. This result compares well to what has previously been 368
reported by Ryoo et al., who quantified the amount of external and internal BAS through 369
probing with various probe molecules [32,33]. 370
3.3 Etherification of glycerol by tert-butyl alcohol
371
Thermodynamic analysis of reaction equilibrium: The glycerol etherification
372
with tert-butyl alcohol was carried out in batch reactors at 363 K under autogenous pressure 373
the reactions involved in the direct etherification of glycerol (G) and tert-butyl alcohol 374
(TBA) in mono-, di- and tri- ethers (MTBG, DTBG and TTBG, respectively) are 375
summarized as follows: 376
G(l)+ TBA(l) MTBG(l) + H2O(l) with G1°298K = -7.47 kJ mol-1 (eq. 5)
377 k1
378
MTBG(l) + TBA(l) DTBG(l) +H2O(l) with G2°298K = -1.12 kJ mol-1 (eq. 6)
379 380
DTBG(l) + TBA(l) TTBG(l) + H2O(l) with G3°298K = 7.40 kJ mol-1 (eq. 7)
381 382
TBA(l) IB(g) + H2O(l) with G4°298K = -1.52 kJ mol-1 (eq. 8)
383 384
It is worth to mention that the reverse reaction of TBA dehydration is negligible, 385
since only a small amount of IB is dissolved in the liquid solution due to the low 386
autogenous pressure (<0.5 MPa). The standard Gibbs free energy of formation used for 387
MTBG, DTBG and TTBG are those obtained by Kiatkittipong [50] y usin the Gani’s 388
method [51] (SI Table C1). The authors predicted a minimization of the Gibbs free energy 389
for an equilibrium conversion of glycerol (Xeq) at 363 K (with a supposed equimolar
390
reactant mixture) of 75%. Pico et al. found from two simplified kinetic models at 363 K 391
with a TBA:G ratio of 1:4 (i.e. similar experimental condition to ours) a slightly higher 392
value of Xeq,i.e. 80% [52]. Hence, the etherification of glycerol and tert-butyl alcohol in
393
mono-, di- and tri-ethers is a reaction limited by a thermodynamic equilibrium, and in our 394
experimental conditions the maximum glycerol conversion expected is of 80%. 395
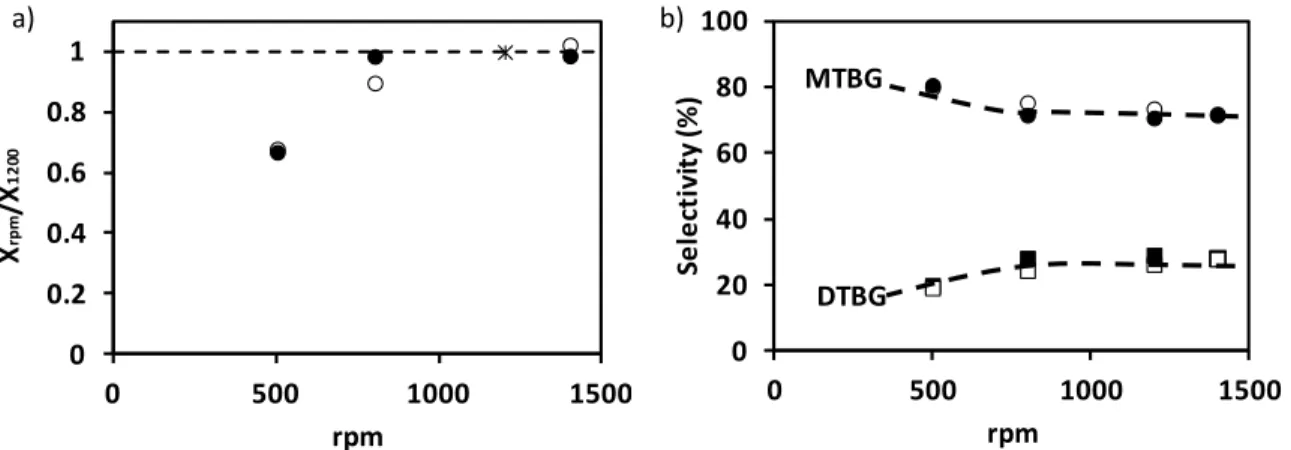
Kinetic model: The external mass transfer effect over (* shows that the
396
conversion and selectivity into MTBG and DTBG increases with increasing stirring speed 397
and levels off at speeds higher than 800 rpm (Figure 6), indicating the absence of external 398
diffusion limitations at such stirring speeds. This results compare well to those obtained by 399
Gonzáles et al. [12] and Karinen et al. [53], who observed a dependence of the product 400 k-2 k2 k-3 k3 k4 k-4
selectivity as function of the stirring rate and that at higher speeds, the reaction was more 401
selective towards the ethers, while below 1000 rpm oligomerization of isobutylene was 402
observed. Therefore, the stirring speed has been set to 1200 rpm for all experiments. 403
The order of reaction for glycerol and ter-butyl alcohol were established on the 404
(* catalyst at 363 K and estimated from the variation of the initial rate with the 405
concentration of that reactant, using the natural logarithm of the rate equation: 406
The initial rate are measured in a series of experiments at 407
different initial concentration of Gly ranged from 2 10-4 to 10 10-4 mol cm-3 with a molar 408
ratio TBA/Gly from 10 to 40. In these conditions, the concentration of the exceeding 409
reactant can be considered as almost invariant. The slope of the straight line in figure 7 of 410
lnr0 plot as a function of ln[Gly]0 then corresponds to the partial order with respect to Gly.
411
Similar experiments were carried out by maintaining the concentration of Gly constant and 412
varying that of TBA concentration from 4 10-4 to 20 10-4 mol cm-3. The partial kinetic 413
orders with respect to Gly and TBA are both close to 1. It is worth mentioning that for the 414
etherification on the solid-acid resin Amberlyst® 15, the kinetic orders found by Frusteri et 415
al. [54] are different and amount to an order of 0.3 with respect to Gly and an order of 1.7
416
with respect to tert-butyl alcohol. A possible explanation to this discrepancy might be due 417
to the ability of the macroporous resin to enable the kinetically relevant steps between 418
proximal adsorbates. Yet, Kiatkittipong et al. [50] found that on Amberslyst® 15 the 419
Langmuir-Hinshelwood (LH) activity based model is the best suited kinetic model to fit the 420
experimental results. 421
Nevertheless, a LH mechanism involving elementary steps between adsorbates on identical 422
sites is highly unlikely especially on high Si/Al zeolites due to the distance between two 423
adsorbates species (several nanometers). The coupling between such spatially dispersed 424
adsorbates to form C-O bonds in etherification is highly unlikely. Bimolecular reactions on 425
zeolites typically occur through Eley-Rideal (ER) type mechanisms, such as for alcohol 426
dehydration [55], alkane alkylation [56], olefin oligomerization [57] and aromatics 427
alkylation [58]. The partial kinetic orders with respect to glycerol and tert-butyl alcohol 428
concentration equal to 1 are consistent with an ER mechanism, where TBA reacts with the 429
adsorbed Gly. 430
Activity and stability: In figure 8, the glycerol conversion has been compared as a
431
function of the reaction time for following catalysts: Amberlyst® 15 (A-15 as reference 432
catalyst [7,59]), -Al2O3, SiO2, SiO2-Al2O3 and commercial zeolites ( , ,
433
(* , and ). By employing A-15 as the catalyst, the conversion increases 434
rapidly and reaches a plateau at 64% within 1 h. The plateau is 16% lower than the 435
predicted equilibrium value, which means that conversion is hampered by deactivation of 436
the sulfonic resin, probably due to a product inhibition effect, e.g. by H2O. The catalysts
437
based on SiO2 and -Al2O3 show no catalytic activity for the etherification (Table 2).
438
Hence, glycerol etherification at 363 K requires protonic sites. It is to note that the Lewis 439
acid sites can catalyze the etherification reaction, yet merely at higher reaction temperatures 440
(T>473 K [59-60]). At low temperatures the alcohol remains strongly adsorbed on the 441
Lewis sites [61], thus yielding an incomplete carbon balance (< 90%). On silica-alumina 442
catalyst, the glycerol conversion is extremely slow and amounts to only 2% after 10 h of 443
reaction, ascribable to the low BAS concentration (43 µmol g-1). Employing (*
444
allows to achieve an increasing conversion up to a pseudo-plateau lower than that of A-15 445
at approximately 54%. 446
Indeed, the rate decreases with time due to reactant consumption and accumulation of 447
products (MTBG) and more particularly water in the media. As there is no asymptotic 448
approach towards the value of glycerol conversion equilibrium, this suggests that the 449
catalysts deactivate (not by coking since the reaction temperature is too low, i.e. 353 K), 450
but through a product inhibiting effect [62].Using a much stronger deactivation 451
is observed, achieving a plateau at only 6% after 1 h. Indeed, such mono-dimensional 452
zeolites are extremely sensitive to deactivation [63]. Employing and as 453
catalysts, the glycerol conversion increases continuously with the reaction time, yet after 10 454
h the conversions are considerably lower than on (* , and are 33% and 20% against 455
54%, respectively (Figure 8). It is interesting to note that the catalytic behavior of both of 456
the large pores zeolites, FAU and *BEA, is significantly different. The higher efficiency of 457
*BEA could be due to either the small crystal size that favors the diffusion of reactant and 458
products or as proposed by Veiga et al. [64] to the hydrophobic/hydrophilic balance of its 459
surface. As far as the latter is concerned, the authors correlated catalytic activity and 460
hydrophobicity index (drawn from the non-competitive adsorption of water and toluene) for 461
FAU, MFI and *BEA zeolites. Yet, this relation is not consistent, as authors compared 462
zeolites featuring different crystal size, as suggested by the indicated external surface (Sext).
463
Indeed, the high-value of Sext of *BEA zeolite indicates small crystal size, whereas for FAU
464
and MFI zeolites, Sext is low and corresponds hence to larger crystal sizes. Yet, the authors
465
found *BEA to be the most active catalyst among all tested zeolites. 466
Results of the catalytic etherification of glycerol with tert-butyl alcohol further 467
compared in terms of initial activity (A0), where possible deactivation does not occur. A0
468
was estimated from the slope of the tangent at zero time fitted to the curves presented in 469
Figure 8. The initial activity of the sulfonic resin A-15 is the highest due to the important
470
amount of BAS (Table 2). On the tridimensional zeolites with large pores, i.e. FAU and 471
*BEA zeolites, A0 is proportional to the concentration of BAS, excepted for the catalyst
472
featuring large crystals, i.e. (* and
, that indicate the occurrence of
473
diffusion limitation (DL), (Figure 9). 474
The effectiveness factor () relates the observed reaction rate with the intrinsic 475
chemical rate (robs/rintrinsic) and can be calculated from the ratio of two crystal sizes ( ) and
476
the ratio of corresponding initial activities ( ) by using an iteratively resolved algebraic 477
loop [65] (the method is detailed in section C.M.2). Figure 10 reports as a function of 478
the zeolite crystal size. The diffusion path being extremely short in *BEA nanosheets 479
(* , no diffusion limitations occur (= 1). DL occur on the *BEA zeolite with
480
crystal sizes above 100 nm. For the very acid MOR zeolite (1056 mol g-1 [H+]), activity is 481
very low due to the diffusion controlled reaction induced by the long diffusion path (crystal 482
size > 200 nm), and further accentuated by the mono-dimensional channel system. 483
Although *BEA and MFI zeolites have identical acid strength [34] and similar confining 484
voids (see section 3.2), the turnover rate is very low on the medium pore zeolite (9-46 h-1) 485
compared to that with large pores (150-198 h-1). This suggests that diffusion limitations 486
occur even with a diffusion path length of a few nm. The DL is thus in this case most 487
importantly governed by zeolite pore size and the void connectivity. Indeed for *BEA the 488
void is connected by six 12 MR (0.67 nm), while for MFI by four 10 MR (0.54 nm). The 489
kinetic diameter of glycerol is 0.61 nm [66] that explains the diffusion limitation 490
encountered with the medium pore zeolite. 491
Selectivity: The etherification of glycerol with tert-butyl alcohol (TBA) proceeds
492
via a consecutive path that yields the formation of water and five different alkyl glycerol 493
ethers, which are MTBG (3-tert-butoxy-1,2 propanediol and 2-tert-butoxy-1,3 494
propanediol), DTBG (2,3-di-tert-butoxy-1-propanol and 1,3-di-tert-butoxy-2-propanol) and 495
TTBG (tri-tert-butoxy-propane). Side reactions can occur such as the dehydration of TBA 496
to isobutylene (IB) followed of its dimerization. Under the performed reaction conditions, 497
no diisobutylene is detected (Figure C1) and the isobutylene yield estimated from the 498
autogenous pressure is negligible (less than 1%). Figure 11 compares MTBG (primary 499
product) and the h-GTBG (DTBG and TTBG) molar yields as function of the overall 500
glycerol conversion employing Amberlyst® 15 and commercial zeolites as catalysts. Table 501
2 reports conversion and product selectivity obtained after 10 h of reaction.
502
Using A-15, the yield of the primary product reaches a maximum at ca. 50% 503
glycerol conversion (Table 2). The DTBG (secondary product) is starting to be formed at 504
30% glycerol conversion (extrapolated value at zero conversion). After 10 h of reaction, 505
one quarter of the products are composed of DTBG, whereas the yield of TTBG (ternary 506
product) is negligible (0.3%). Employing the large pores zeolites (*BEA, FAU and MOR) 507
the di-substituted ethers begin to be formed at a much lower glycerol conversion than for 508
A-15, i.e. below 6% (Figure 11). After 10 h of reaction, the selectivity into DTBG is 5% 509
higher for than for A-15.
, is more selective for the formation of the
di-510
substituted ether than the *BEA zeolite, the small difference provides from a higher yield 511
into 1,2,3-tri-tert-butoxy propane. For the selectivity into DTBG is low (1%), 512
ascribable to the low glycerol conversion (6%). The medium pore zeolite is almost 513
totally selective to MTBG (99 %) even for a conversion of 20% (Table C2). 514
In comparison with the sulfonic resin (A-15), which is a macroporous solid that 515
hence features no spatial constraint, the use of large pore zeolites favors at low conversions 516
successive etherification reactions ascribable to the overconcentration of ethers in the 517
micropores resulting from steric hindrance. It can thus be assumed that zeolite catalysis 518
induces "product shape selectivity" [16]. Yet, Gonzalez et al. claimed that the selectivity 519
towards di- and tri-ethers is correlates with the strength of protonic sites [9]. Nevertheless, 520
the correlation put forward is highly disputable and moreover merely valid for one zeolite 521
(*BEA). Hence, the "product shape selectivity" mechanism through zeolite catalysis is a 522
valuable mean that allows for explaining the observed selectivity. 523
Regeneration: The deactivated catalysts were regenerated either by (i) rinsing with
524
ethanol at 373 K under 10 MPa nitrogen pressure by using a Dionex ASE 350 apparatus or 525
(ii) through calcination in air at 823 K for 5 h. As expected, calcination allows to recover 526
the entire activity of zeolite catalyst (Figure 12). Furthermore, as far as MOR and *BEA 527
zeolites are concerned, rinsing with ethanol allows to recover greatly the catalytic activities, 528
which are 87 and 93%, respectively. The extracted molecules by ethanol rinsing are 529
glycerol and desired conversion products, MTBG and DTBG (only in the case of *BEA). 530
This confirms what has been put forward by Gonzales et al., who evidenced that the 531
deactivation of *BEA zeolite during glycerol etherification resulted from zeolite 532
micropores blocking with the reagent and products [9]. The retention of reactant and 533
products within the micropores is thus due to steric hindrance [67]. These confined 534
molecules are prone to limit or inhibit the bimolecular reaction. It can thus be assumed that 535
the auto-inhibition is responsible for rapid decrease of the reaction rate (as observed in 536
Figure 8). The inhibition effect is strongly pronounced for mono-dimensional pore
prevents the access to reagents to an important amount of acid sites located within the 539
crystal, leading to a very fast deactivation. 540
Rinsing the deactivated with ethanol permits to regenerate only partially 541
catalytic activity (up to 60%), despite of recovering entirely the initial Brønsted acidity. 542
Indeed, no interaction was observed between retained molecules (4.2 wt%) and zeolite –OH 543
groups located in the supercages and in the sodalite cages (Figure C3). The loss of activity 544
is thus merely due to a steric blockage of trapped molecules. The presence of the retained 545
molecules within the surpercages decreases the available space that is enough to inhibit the 546
bimolecular etherification reaction. 547
In the case of , the ethanol washing allows to recover 30% of catalytic
548
activity, as almost 5.0wt% of molecules remain retained within the micropores upon 549
rinsing. This observation can readily be attributed to the steric blocking of the pore 550
intersections through retained molecules. 551
Washing with ethanol is more efficient on the zeolite featuring straight channels, 552
such as *BEA and MOR zeolites, compared to zeolites possessing larger cavities than the 553
pore size, i.e. the FAU supercage or presenting an intersected channel system, such as MFI, 554
where the formation of large molecules is favored. The results obtained in this section thus 555
clearly support the “product shape selectivity” mechanism suggested for the glycerol 556
etherification over zeolites. 557
4. Conclusion 558
For n-hexane cracking; a reaction without internal diffusion limitations (gas phase 559
reaction at high temperature, small size of reactant and product molecules, monomolecular 560
mechanism), TOFs observed over various zeolites depend on the confinement of the BAS. 561
Confined BAS (in zeolites) are substantially more active compared to unconfined BAS (in 562
meso- or macroporous materials). The apparent activity depends on the local geometry of 563
the site. Indeed, for *BEA and MFI zeolites that feature the same confining voids (0.69 and 564
0.7 nm, respectively) and thus yield similar turnover rates and selectivity. 565
Contrariwise, in a reaction sensitive to diffusion limitation (liquid phase, low 566
temperature, bimolecular mechanism, large products molecules), such as the glycerol 567
etherification with tert-butyl alcohol the zeolite confining void is not sufficient to predict 568
activity, selectivity and stability; the accessibility to the void volume has to be taken into 569
account. As an example, *BEA and MFI zeolites feature the same confining voids but the 570
difference in their access (over 1 Å) is sufficient to generate strong diffusion limitations in 571
the case of the medium pore zeolite. For *BEA (12 MR zeolite) the activity is proportional 572
to the concentration of BAS at the condition that the crystal size is lower than 100 nm 573
(absence of internal diffusion limitations). For zeolites featuring the biggest confining voids 574
(i.e. the FAU supercage) successive etherification is favoured, yet product desorption is 575
hampered. 576
For liquid phase reactions catalyzed by zeolite active sites the porous geometry (i.e. 577
void volume, interconnection, size) has a crucial effect on confinement and shape 578
selectivity and hence on catalytic key parameters (activity, selectivity and stability). 579
580
Acknowledgements
581
C. Miranda thanks Colciencias for the financial support provided for doctoral formation 582
through the 617 convocation. A. Astafan, thanks the Programme PAUSE and the 583
University of Poitiers for their financial supports. 584
References
586 587
[1] M. Pagliaro, R. Ciriminna, H. Kimura, M. Rossi, C. Della Pina, Angew. Chem. 588
Inter. Ed., 46 (2007) 4434. 589
[2] C. Len, R. Luque, Sus. Chem. Proc., 2 (2014) 1. 590
[3] J.F. Izquierdo, M. Montiel, I. Palés, P.R. Outón, M. Galán, L. Jutglar, M. 591
Villarrubia, M. Izquierdo, M.P. Hermo, X. Ariza, Ren. and Sus. En. Rev., 16 (2012) 592
6717. 593
[4] M. Sutter, E.D. Silva, N. Duguet, Y. Raoul, E. Métay, M. Lemaire, Chem. Rev., 115 594
(2015) 8609. 595
[5] C. Cannilla, G. Bonura, L. Frusteri, F. Frusteri, Chem. Eng. J., 282 (2015) 187. 596
[6] E. Theodore, K.R. Edlund,US patent 1968033A (1934) to Shell. 597
[7] K. Klepáčová, D. Mravec, M. Bajus, Appl. Catal. A: Gen., 294 (2005) 141. 598
[8] K.Y. Nandiwale, S.E. Patil, V.V. Bokade, En. Tech., 2 (2014) 446. 599
[9] M.D. González, Y. Cesteros, P. Salagre, Appl. Catal. A: Gen., 450 (2013) 178. 600
[10] K. Klepáčová, D. Mravec, A. Kaszonyi, M. Bajus, Appl. Catal. A: Gen., 328 (2007) 601
1. 602
[11] D. Mravec, A. Turan, A. Filková, N. Mikesková, E. Volkovicsová, G. Onyestyák, S. 603
Harnos, F. Lónyi, J. Valyon, A. Kaszonyi, Fuel Proc. Tech., 159 (2017) 111. 604
[12] M.D. González, P. Salagre, M. Linares, R. García, D. Serrano, Y. Cesteros, Appl. 605
Catal. A: Gen., 473 (2014) 75. 606
[13] N. Simone, W.A. Carvalho, D. Mandelli, R. Ryoo, J. Mol. Catal A: Chem., 422 607
(2016) 115. 608
[14] P.B. Weisz, V.J. , Frillette, V.J., J. Phys Chem., 64 (1960) 382. 609
[15] M. Csicsery, Shape –selective catalysis, chapter 12, p 680-713, in Zeolite chemistry 610
and catalysis, J. A. Rabo, eds ACS 1976. 611
[16] E. G. Derouane, J. Mol. Cat. A Chem. 134 (1998) 29. 612
[17] K. Okada, T. Tomita, Y. Kameshima, A. Yasumori, K.J.D. MacKenzie, S, J Coll. 613
Inter Sc., 219 (1999) 195. 614
[18] R.B. Borade, A. Clearfield, Micro. Mat., 5 (1996) 289. 615
[19] N. Lauridant, T. Jean Daou, G. Arnold, J. Patarin, D. Faye, Micro. Meso. Mat., 166 616
(2013) 79. 617
[20] K. Na, C. Jo, J. Kim, K. Cho, J. Jung, Y. Seo, R.J. Messinger, B.F. Chmelka, R. 618
Ryoo, Science, 333 (2011) 328. 619
[21] A. Astafan, M.A. Benghalem, Y. Pouilloux, J. Patarin, N. Bats, C. Bouchy, T.J. 620
Daou, L. Pinard, J. Catal., 336 (2016) 1. 621
[22] I. Kabalan, I. Khay, H. Nouali, A. Ryzhikov, B. Lebeau, S. Albrecht, S. Rigolet, M.-622
B. Fadlallah, J. Toufaily, T. Hamieh, J. Patarin, T.J. Daou, J. Phys. Chem. C, 119 623
(2015) 18074. 624
[23] J.M.D. Coutanceau C., M F Alvarez, M. Guisnet, J. Chim. Phys. Physico-Chim. 625
Biol., 94 (1997) 765. 626
[24] S.K. Saxena, A.a.H. Al-Muhtaseb, N. Viswanadham, Fuel, 159 (2015) 837. 627
[25] M. Guisnet, P. Ayrault, J. Datka, , Pol. J. Chem., 71 (1997) 1455. 628
[26] M. A. Makarova, K. Karim, J. Dwyer, Micro. Mat., 4 (1995) 243. 629
[27] C.A. Emeis, J. Catal., 141 (1993) 347. 630
[28] G. Shi, H. Zhang, J. Quant. Spect. Rad. Tans., 105 (2007) 459. 631
[29] A. Bauer, M. Godon, J. Carlier, Q. Ma, R. H. Tipping, J. Quant. Spect. Rad. Tans., 632
50 (1993) 463. 633
[30] M.T. Tran, N.S. Gnep, G. Szabo, M. Guisnet, J. Catal., 174 (1998) 185. 634
[31] V. C. Nguyen, N. Q. Bui, P. Mascunan, T. T. H. Vu, P. Fongarland, N. Essayem, 635
Appl. Catal. A Gen., 552 (2018) 184. 636
[32] J.-C. Kim, K. Cho, R. Ryoo, Appl. Catal. A: Gen., 470 (2014) 420. 637
[33] K. Kim, R. Ryoo, H.-D. Jang, M. Choi, J. Catal., 288 (2012) 115. 638
[34] B. Xu, C. Sievers, S. B. Hong, R. Prins, J. A. van Bokhoven, J. Catal., 244 (2006) 639
163. 640
[35] C.V. Mc Daniel, P.K.. Maher, Zeolite chemistry and Catalysis, ACS Monograph, 641
Washington D.C, 1976, 266. 642
[36] P.K. Maher, F.D. Hunter, J. Scherzer, Moecular sieve Zeolites-1., Adv . Chem. Ser., 643
101 (1970) 266. 644
[37] R.D. Shannon, K.H. Gardner, R.H. Staley, G. Bergeret, P. Gallezot, A. Auroux, J. 645
Phys. Chem., 89 (1985) 4478. 646
[38] W.O. Haag, R.M. Lago, P.B. Weisz, Nature, 309 (1984) 589. 647
[39] S.M. Babitz, B.A. Williams, J.T. Miller, R.Q. Snurr, W. O. Haag, H.H. Kung, Appl. 648
Catal. A: Gen., 179 (1999) 71. 649
[40] T.F. Narbeshuber, H. Vinek, J.A. Lercher, J. Catal., 157 (1995) 388. 650
[41] C. Mirodatos, D. Barthomeuf, J. Chem. Soc. Chem. Commun., (1981) 39. 651
[42] M., Niwa, S. Sota, N. Katada, Catal. today, 185 (2012) 17. 652
[43] W. O. Haag, R.M. Dessau, R. M. Lago, Stud. Surf. Sci. Catal., 60 (1991) 255. 653
[44] S. Li, A. Zheng, Y., Su, H. Zhang, L. Chen, J. Yang, C. Ye, F. Deng, J. Am. Chem. 654
Soc., 129 (2007) 11161. 655
[45] R. Gounder, A. J. Jones, R. T. Carr, E. Iglesia, J. Catal., 286 (2012) 214. 656
[46] W. O. Hagg, R. M. Lago, P. B. Weisz, Faraday Discuss. Chem. Soc., 72 (1981) 317. 657
[47] R. Gounder, E. Iglesia, Chem. Commun., 49 (2013) 3491-3509 658
[48] A.J. Jones, R.T. Carr, S. I. Zones, E. Iglesia, ACS Catal., 5 (2015) 5741. 659
[49] M. L. Sarazen, E. Doskocil, E. Iglesia, J. Catal., 344 (2016) 553. 660
[50] W. Kiatkittipong, W. Intaracharaoen, P. Laosiripojana, N. Chaisuk, C. Praserthdam, 661
P. Assabumrungrat, S. Comp. Chem. Eng., 35 (2011) 2034. 662
[51] L. Constantinou, R. Gani, AICHE Journal, 40 (1994), 1697. 663
[52] P.M. Pico, A. Romero, S. Rodriguez, A. Santos, Ind. Eng. Chem. Res., 51 (2012) 664
9500. 665
[53] R.S. Karinen, A.O.I. Krause, Appl. Catal. A: Gen., 306 (2006) 128. 666
[54] F. Frusteri, F. Arena, G. Bonura, C. Cannilla, I. Sparado, O. Di Blasi, Appl. Catal. 667
A. Gen., 367 (2009) 77. 668
[55] S. R. Blaszkowski, R. A. van Santen, J. Am. Chem. Soc. 118 (1996) 5152), 669
[56] F. W. Kirsch, J.D. Potts, D.S. Barmby, J. Catal. 27 (1972) 142. 670
[57] J. P. van den Berg, J.P. Wolthuizen, A.D.H. Clague, G.R. Hays, R. Huis, J.H.C. van 671
Hoff, J. Catal. 80 (1983) 130. 672
[58] P. B. Venuto and P. S. Landis, Adv. Catal. 18 (1968) 259, 673
[59] M. Xu, J.H. Lunsford, D.W. Goodman, A. Bhattacharyya, Appl. Catal. A. Gen., 149 674
(1997) 289. 675
[60] F. Yaripour, M. Mollavali, S.M. Jam, H. Atashi, , Energy Fuels, 23 (2009) 1896. 676
[61] J.R. Copeland, I.A. Santillan, S.M. Schimming, J.L. Ewbank, C. Sievers, J. Phys. 677
Chem. C, 117 (2013) 21413. 678
[62] M. Guidotti, C. Canaff, J.-M. Coustard, P. Magnoux, M. Guisnet, J Catal., 230 679
(2005) 375. 680
[63] P. Magnoux, P. Cartraud, S. Mignard, M. Guisnet. J. Catal., 106 (1987) 235. 681
[64] P.M. Veiga, A.C.L. Gomes, C.O. Veloso, C.A. Henriques, Appl. Catal. A. Gen., 548 682
(2017) 2. 683
[65] O. Levenspiel, Chemical reaction engineering, 3rd Edition Wiley, 1999. 684
[66] S. Li, V. A. Tuan, J. L. Falconer, R.D. Noble, J. Memb. Sci., 191 (2001) 53. 685
[67] M. Guisnet, P. Magnoux, Zeolite Microporous Solids: Synthesis, E Derouane, F. 686
Lemos, C. Naccache, F. R. Ribeiro, F. (Eds.), Springer Netherlands, 1992, p. 457. 687
[68] H. Sammoury, J. Toufaily, K. Cherry, T. Hamieh, Y. Pouilloux, L. Pinard, Appl. 688
Catal. A. Gen., 551 (2018) 1. 689
690
Table and Figure captions
691
Table 1 Textural and acidic properties of Amberlyst® 15, alumina, silica, silica
692
alumina and zeolites (commercial and synthetized): MOR, FAU, *BEA and 693
MFI. 694
695
Table 2 Glycerol etherification with tert-butyl alcohol: conversion and selectivity
696
after 10 h, initial activity (A0) and TOF obtained on Amberlyst® 15, silica,
697
alumina, silica-alumina and zeolites (commercial and synthetized): MOR, 698
FAU, *BEA and MFI. 699
700
Fig. 1 Micropore (a) and mesopore (b) volumes and proportion of theoretical
701
Brønsted acid site probed by pyridine at 423 K (c) as a function of zeolite 702
crystal size. 703
704
Fig. 2 Scanning electron microscopy and transmission electronic images of
705
commercial, modified and synthesized zeolites. 706
707
Fig. 3 First-order plot for n-hexane cracking over at 813 K.
708 709
Fig. 4 Initial activity in n-hexane cracking (A0) as a function of the concentration
710
of protonic site probed by pyridine at 423 K ([PyH+]). (Operating 711
conditions: T = 813 K, P = 1 atm, PN2/Pn-c6= 9). The plotted values used
with entity “Ref.” correspond to values drawn from Ref [55] and 713
represented in table B2. 714
715
Fig. 5 TOF as a function of the measure of the diffusion constraint:
716
L(A0)^0.5(Operating conditions: T = 813 K, P = 1 atm, PN2/Pn-c6= 9).
717 718 719
Fig. 6 (a) Conversion normalized by the conversion achieved at 1200 rpm and (b)
720
Selectivity of MTBG and DTBG as function of the stirring rate on 721
(* .
722 723
Fig. 7 Natural logarithm of initial rates (lnr0) as a function of natural logarithm of
724
the initial concentration (ln[X]0) of glycerol (full symbols) and TBA (open
725
symbols). Kinetic study carried out on (* at 363 K (data is given as 726
absolute values). 727
728
Fig. 8 Glycerol conversion as a function of reaction time. Test carried out at 363
729
K, 1200 rpm, autogenous pressure, 7.5% of catalyst (referred to glycerol 730
mass) and glycerol/tert-butyl alcohol molar ratio of 0.25. 731
732
Fig. 9 Initial activity of glycerol etherification with tert-butyl alcohol as a function
733
of the concentration of protonic sites probed by pyridine at 423 K. 734
(operating conditions: glycerol/tert-butyl alcohol molar ratio = 0.25, T = 735
363 K). 736
737 738
Fig. 10 Effectiveness factor () in etherification of glycerol with tert-butyl alcohol
739
as a function of the zeolite beta crystal size (operating conditions: 740
glycerol/tert-butyl alcohol molar ratio = 0.25, T = 363 K). 741
742
Fig. 11 Molar yields of MTBG, DTBG and TTBG as a function of glycerol
743
conversion; Test carried out at 363 K, 1200 rpm, autogenous pressure, 7.5% 744
of catalyst (referred to glycerol mass) and glycerol/tert-butyl alcohol molar 745
ratio of 0.25. 746
747
Fig. 12 Recovered activity after washing with ethanol and calcination of the
748 deactivated catalysts. 749 750 Supporting information 751 752 Section A: generalities 753
Table A1 Catalyst suppliers.
Table A2 Molar composition of the starting synthesis gels and thermal conditions for 755
the preparation of micron-sized (MC), submicron-sized (SC), and 756
nanometer-sized (NC) crystals and nanosponge (NSp)*BEA-type zeolites. 757
Figure A1 Molar extinction coefficient of Brønsted acid site (band at 1545 cm-1) and
758
Lewis acid site (1455 cm-1). 759
Figure A2 XRD patterns of the *BEA zeolites and MFI synthesized.
760
Figure A3 Correlation between EFAL and the Lewis acidity.
761 762
Section B: n-hexane cracking
763
Figure B1 n-hexane cracking on different catalysts series: FAU, *BEA and MFI. Initial
764
yields into cracking products as a function of initial n-hexane conversion. 765
Operating conditions: T = 813 K, P = 1 atm, PN2/Pn-c6= 9
766
Figure B2 C4/C2 and C5/C1 molar ratios as a function of initial conversion of n-hexane
767
cracking on different catalysts series: FAU, *BEA and MFI. Operating 768
conditions: T = 813 K, P = 1 atm, PN2/Pn-c6= 9.
769
Figure B3 n- hexane conversion as a function of time of stream (TOS). Operating
770
conditions: T = 813 K, P = 1 atm, PN2/Pn-c6= 9.
771
Table B1 Initial activity in n-hexane cracking obtained on Amberlyst® 15, and zeolites
772
(commercial, modified and synthetized): MOR, FAU, *BEA and MFI. 773
Operating conditions: T = 813 K, P = 1 atm, PN2/Pn-c6= 9
774
Table B2 Reference catalysts used in the laboratory drawn from [64].
775 776 777 778 779
Section C: etherification of glycerol with tert-butyl alcohol
780
C.M.1. Method for calculation of the effectiveness factor from two crystal sizes and
781
two catalyst activities. 782
Figure C1 Typical chromatogram for the etherification of glycerol with tert-butyl 783
alcohol. 784
Figure C2 Glycerol conversion as a function of reaction time at 363 K, 1200 rpm,
785
autogenous pressure, 7.5% of catalyst and glycerol/tert-butyl alcohol molar 786
ratio of 0.25. 787
Figure C3 FT-IR spectra of : fresh and spent catalyst after rinsing with ethanol
788
Table C1 Thermodynamic data.
789
Table C2 Selectivity into glycerol monoethers (MTBG), glycerol diethers (DTBG) and
790
glycerol triether (TTBG) at isoconversion. (X ≈ 20 %) o tained on MOR, 791
FAU, *BEA and MFI catalysts. 792


![Figure 4. Initial activity in n-hexane cracking (A 0 ) as a function of the concentration of protonic site probed by pyridine at 423 K ([PyH + ])](https://thumb-eu.123doks.com/thumbv2/123doknet/14795849.603710/40.918.137.772.112.560/figure-initial-activity-cracking-function-concentration-protonic-pyridine.webp)