HAL Id: hal-00295287
https://hal.archives-ouvertes.fr/hal-00295287
Submitted on 24 Jun 2003
HAL is a multi-disciplinary open access
archive for the deposit and dissemination of
sci-entific research documents, whether they are
pub-lished or not. The documents may come from
teaching and research institutions in France or
abroad, or from public or private research centers.
L’archive ouverte pluridisciplinaire HAL, est
destinée au dépôt et à la diffusion de documents
scientifiques de niveau recherche, publiés ou non,
émanant des établissements d’enseignement et de
recherche français ou étrangers, des laboratoires
publics ou privés.
aerosols: statistical analysis for correlations with
meteorological conditions and trace gases
B. Wehner, A. Wiedensohler
To cite this version:
B. Wehner, A. Wiedensohler. Long term measurements of submicrometer urban aerosols: statistical
analysis for correlations with meteorological conditions and trace gases. Atmospheric Chemistry and
Physics, European Geosciences Union, 2003, 3 (3), pp.867-879. �hal-00295287�
www.atmos-chem-phys.org/acp/3/867/
Chemistry
and Physics
Long term measurements of submicrometer urban aerosols:
statistical analysis for correlations with meteorological conditions
and trace gases
B. Wehner and A. Wiedensohler
Institute for Tropospheric Research, Permoserstr. 15, 04318 Leipzig, Germany
Received: 27 August 2002 – Published in Atmos. Chem. Phys. Discuss.: 28 October 2002 Revised: 13 June 2003 – Accepted: 17 June 2003 – Published: 24 June 2003
Abstract. Long-term measurements (over 4 years) of par-ticle number size distributions (submicrometer parpar-ticles, 3– 800 nm in diameter), trace gases (NO, NO2, and O3), and
meteorological parameters (global radiation, wind speed and direction, atmospheric pressure, etc.) were taken in a mod-erately polluted site in the city of Leipzig (Germany). The resulting complex data set was analyzed with respect to sea-sonal, weekly, and diurnal variation of the submicrometer aerosol. Car traffic produced a peak in the number size dis-tribution at around 20 nm particle diameter during morning rush hour on weekdays. A second peak at 10–15 nm particle diameter occurred around noon during summer, confirmed by high correlation between concentration of particles less than 20 nm and the global radiation. This new-particle for-mation at noon was correlated with the amount of global radi-ation. A high concentration of accumulation mode particles (between 100 and 800 nm), which are associated with large particle-surface area, might prevent this formation. Such high particle concentration in the ultrafine region (particles smaller than 20 nm in diameter) was not detected in the parti-cle mass, and thus, partiparti-cle mass concentration is not suitable for determining the diurnal patterns of particles. In summer, statistical time series analysis showed a cyclic pattern of ul-trafine particles with a period of one day and confirmed the correlation with global radiation. Principal component anal-ysis (PCA) revealed a strong correlation between the parti-cle concentration for 20–800 nm partiparti-cles and the NO- and NO2-concentrations, indicating the influence of combustion
processes on this broad size range, in particular during win-ter. In addition, PCA also revealed that particle concentration depended on meteorological conditions such as wind speed and wind direction, although the dependence differed with particle size class.
Correspondence to: B. Wehner ([email protected])
1 Introduction
The effects of air pollution on human health are of great concern. In particular, aerosol particles less than 100 nm in diameter are suspected to increase the risk of respira-tory and cardiovasculary diseases (e.g. Peters et al., 1997). Various epidemiological studies have investigated the effect of aerosol particles on human health. Pope and Dockery (1999) summarized more than 100 of such studies, and di-vided the studies into two categories: acute exposure studies and chronic exposure studies. Acute exposure studies look at short-term changes (usually 1–5 days) in human health measures associated with short-term changes in air pollu-tion. Chronic exposure studies look at long-term changes (1–5 years) and compare various health states and different levels of pollution, and thus require long-term (more than 1 year) size-resolved particle measurements.
Particle concentrations in the urban atmosphere have been measured by several research groups, focusing predomi-nantly on the total particle mass (e.g. Zee et al., 1998; Kuhlbusch et al., 1998; Roorda-Knape et al., 1998). The im-portance of fine particles (particles smaller than 100 nm in di-ameter) has been, however, neglected due to their small mass. Number size distributions have been measured using size spectrometers, but were limited to a size range >10–20 nm (e.g. Tuch et al., 1997; Wichmann et al., 2000; Hughes et al., 1998; Buzorius et al., 1999) and most measurements were taken over shorter time periods (usually less than 1 year). To-tal number concentrations of particles down to 3 nm in diam-eter were measured (e.g. V¨akev¨a et al., 1999; Harrison et al., 1999), but no information about the size distribution was ob-tained. Woo et al. (2001) measured number size distributions down to 3 nm in the urban area of Atlanta over a 13-month time period. W˚ahlin et al. (2001) focused on traffic-related emissions by measuring particle size distributions in the size range 10 to 700 nm at three different sites in Copenhagen over a less than 2-month time period.
Obtaining representative aerosol particle data for a cer-tain geographical region requires long-term measurements, which can eliminate anomalies caused by variations in mete-orological and regional conditions. Such data are suitable for correlation with epidemiological data and represent valuable input parameters for climate models.
Long-term measurements of number size distributions of particles between 3 and 800 nm in diameter with high size resolution were taken at a moderately polluted site in the ur-ban area of Leipzig (urur-ban background), a city of 460 000 inhabitants, Germany, over a 4-year period (February 1997 to February 2001) (Wehner, 2000). Measurements also in-cluded meteorological and trace gas measurements. The sulting data set is complex, and therefore, detection of re-lationships among the measured parameters requires an in-depth analysis that includes statistical methods such as corre-lation analysis and principal component analysis. Here, this analysis was done to characterize urban background aerosol by determining seasonal, weekly, and diurnal variation (see Sect. 3.1) and to find relations between the measured param-eters (see Sect. 3.5).
2 Measurements
The long-term measurements were made on top of the build-ing of the Institute for Tropospheric Research (IfT), which is located on the outskirts of Leipzig. The research com-plex itself is surrounded by several busy streets as well as by residential areas, but with no significant industrial parti-cle sources nearby. This location is therefore influenced by several pollution sources, such as car traffic, domestic heat-ing, small power and heating plants, and can be considered typical for moderately polluted regions in urban areas.
The inlets for aerosol and trace gas measurements were mounted on the roof of the building and were about 16 m above the ground to minimize the influence of local emission sources such as passing cars. The instruments for aerosol and trace gas measurements were operated inside the IfT at room-temperature conditions. Meteorological measurements were taken on a platform on the roof of the same building.
Number size distributions were measured in the particle size range 3 < Dp <800 nm by a Twin Differential
Mobil-ity Particle Sizer (TDMPS) system (designed by Birmili et al., 1999) comprising two size spectrometers that simultane-ously measure different particle size ranges at dry conditions. Nucleation mode particles (3 < Dp < 22 nm) were
mea-sured by an Ultrafine Differential Mobility Analyzer (Hauke type) in conjunction with an Ultrafine Condensation Particle Counter (UCPC, Model 3025, TSI Inc., St. Paul, MN, USA). Particles in the range from 22 < Dp < 800 nm were
mea-sured using a Differential Mobility Analyzer (Hauke type) and a CPC (Model 3010, TSI Inc., St. Paul, MN, USA).
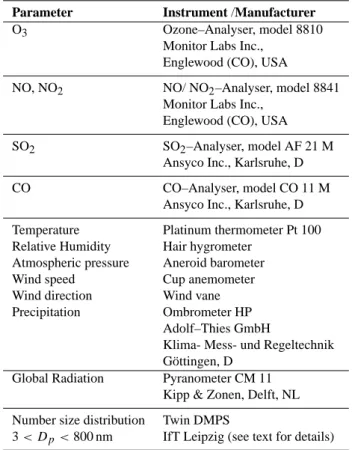
Table 1. Instruments for trace gas, meteorological, and aerosol
measurements at the IfT-building
Parameter Instrument /Manufacturer
O3 Ozone–Analyser, model 8810
Monitor Labs Inc., Englewood (CO), USA
NO, NO2 NO/ NO2–Analyser, model 8841 Monitor Labs Inc.,
Englewood (CO), USA SO2 SO2–Analyser, model AF 21 M
Ansyco Inc., Karlsruhe, D CO CO–Analyser, model CO 11 M
Ansyco Inc., Karlsruhe, D Temperature Platinum thermometer Pt 100 Relative Humidity Hair hygrometer
Atmospheric pressure Aneroid barometer Wind speed Cup anemometer Wind direction Wind vane Precipitation Ombrometer HP
Adolf–Thies GmbH
Klima- Mess- und Regeltechnik G¨ottingen, D
Global Radiation Pyranometer CM 11 Kipp & Zonen, Delft, NL Number size distribution Twin DMPS
3 < Dp<800 nm IfT Leipzig (see text for details)
Trace gases and meteorological parameters (Table 1) were measured continuously at the same sampling point as the par-ticle measurements.
Trace gas data had a time resolution of 1 min, meteoro-logical data had a 10-min time resolution, and DMPS-data had a 15-min time resolution. For data analysis chemical and meteorological measurements were transformed to a 15-min time resolution. All measurement days (= less than one hour of data is missing) between 1997 and 2001 were used for this study. The data were divided into summer (June through Au-gust) and winter periods (December through February) and into different days of the week: weekdays, Saturday, and Sunday.
3 Results and discussion
3.1 Mean variation of number size distributions and related parameters
Diurnal patterns of number size distributions in different sea-sons were determined and compared for the four-year mea-surement period, thus reducing the influence of meteorologi-cal anomalies on the data reduction. Figure 1 shows the mean
1 10 100 1000 102 103 104 Volume Number dN/ d lo g Dp [cm -3 ] Particle diameter, Dp[nm] Winter Summer 10-4 10-2 100 102 dV/ d log Dp [ µ m 3 cm -3 ]
Fig. 1. Mean number and volume size distributions averaged over
summer and winter (1997–2001).
number and volume size distributions for summer and winter averaged over the 4-year period. The number concentrations were higher in winter than in summer. The maximum con-centration for both seasons occurred for a particle size be-tween 10 and 20 nm. The maximum number concentration in winter was two times higher than in summer due to higher emissions caused by heating processes and to a less intensive vertical mixing and the corresponding dilution. The volume size distribution was calculated from the measured number size distribution, assuming spherical particles. The maxi-mum of the volume size distribution occurred at a particle size around 300 nm for winter, and around 400 nm for sum-mer, and the maximal difference occurred at 600 nm and was a factor of over three. The particle volume concentration in the ultrafine range at 20 nm exceeded that of summer by a factor of two, although the absolute values were more than two orders of magnitude less than those at around 500 nm.
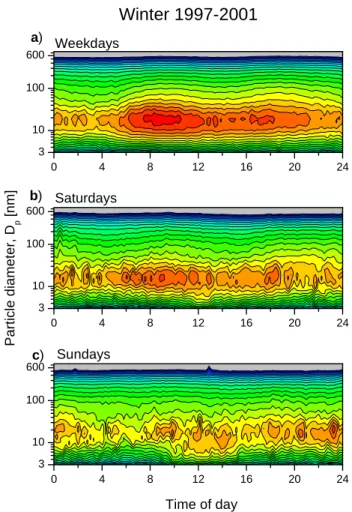
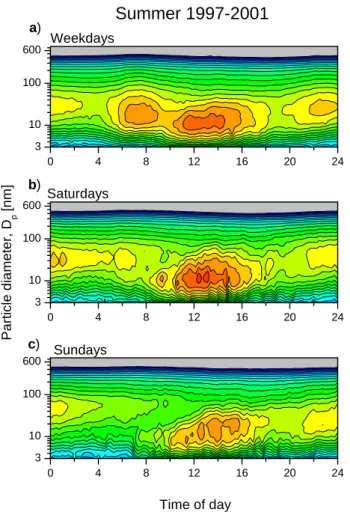
Figure 2 and 3 show the diurnal cycle of particle number size distributions in winter and summer averaged over week-days, Saturweek-days, and Sundays.
On weekdays, the peak number concentration in winter occurred in the size range around 20 nm during the morning hours (see Fig. 2a). This corresponds with higher traffic den-sity. On Saturdays (Fig. 2b), peaks occurred irregularly in the range between 15 and 20 nm over the entire day. On Sun-days, the number concentration was the lowest of the week, probably due to lower traffic density. On Sundays, peaks oc-curred not only during the day, but also in the early morning (Saturday night activities) and late evening (homeward trav-ellers).
On weekdays in summer (Fig. 3a) the particle concentra-tion increased in the early morning hours, peaking between 7:00 and 8:00 at a particle diameter around 20 nm, and then peaking again at noon. The second peak was at a higher concentration, but at a lower particle diameter, 10–15 nm. This second peak corresponds well with the the typical
di-0 4 8 12 16 20 24 3 10 100 600 0 4 8 12 16 20 24 3 10 100 600 c) b) a) Parti c le di a m eter, Dp [n m ] 0 4 8 12 16 20 24 3 10 100 600 Time of day Sundays Saturdays Weekdays
Winter 1997-2001
Fig. 2. Winter diurnal variation in the number size distribu-tion averaged over (a) weekdays, (b) Saturdays, and (c) Sundays (December–February; 1997–2001). The colors represent the num-ber concentration as dN/ dlog Dpwith grey as the lower limit
cor-responding to <200 cm−3and red as the maximum corresponding to 45 000 cm−3.
urnal peak global radiation, indicating that the small parti-cles were produced by photochemically induced nucleation of gaseous components. Between 13:00 and 15:00 this peak concentration was relatively stable. After 15:00, the number of small particles decreased, concurrent with the typically decreasing global radiation leading to less production of new particles and thus the concentration of existing particles de-creased by coagulation. Compared with the morning rush hour, the evening rush hour was barely recognizable. Af-ter 18:00, the mean particle diameAf-ter of the size distribution increased. On Saturdays, no rush-hour peak occurred, but the concentration was still higher than that on Sundays due to traffic to the downtown area on Saturday morning. Again, the nucleation peak (10–15 nm) around noon was clearly pro-nounced, in particular on Saturdays. The peak concentration was roughly the same as that on weekdays. Thus, this phe-nomenon occurs independently of the day of the week an
0 4 8 12 16 20 24 3 10 100 600 Time of day
Summer 1997-2001
0 4 8 12 16 20 24 3 10 100 600 Sundays Saturdays Weekdays Par ti c le di amet er, Dp [n m ] 0 4 8 12 16 20 24 3 10 100 600 c) b) a)Fig. 3. Summer diurnal variation in the number size distribu-tion averaged over (a) weekdays, (b) Saturdays, and (c) Sundays (June–August; 1997–2001). The colors represent the number con-centration as dN/ dlog Dp with grey as the lower limit
corre-sponding to <200 cm−3 and red as the maximum corresponding to 45 000 cm−3.
concentration of potential precursor gases was always high enough in this urban area. In winter, the formation of new particles was not observed (evidenced by the lack of a nu-cleation peak around noon in Fig. 2), because of much lower global radiation and a higher surface-area concentration.
Application of number size distributions to numerical models requires to approximate them with a mathematical function which reduces the number of distribution param-eters to a minimum while maintaining the salient features of the distribution. The mathematical representation of the size distribution is very important and categorizes the aerosol simulation techniques as discrete, spline, sectional, modal, or monodisperse (Whitby and McMurry, 1997). One possi-bility is to represent the size distribution by distinct popu-lations, which are called “modes”. They could be described completely by their total particle number, mean diameter and shape. The most popular function for this purpose is the
log-normal distribution usually formulated as (e.g. Heintzenberg, 1994): dN dlog Dp =√ Nt 2π log σ exp −(log Dp−log ¯Dp) 2 2(log σ )2 ! (1)
with Ntbeing the total number concentration of the mode, ¯
Dpthe number–median diameter, and σ being the geometric
mean standard deviation of the distribution. In this study, log means always log10.
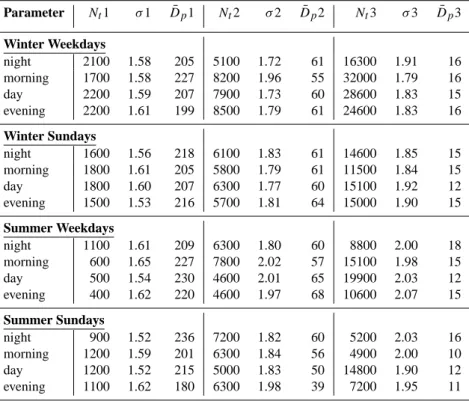
The complete data set should be expressed as well as pos-sible by a small number of parameters. Therefore, a num-ber of necessary size distributions was determined empiri-cally. The data were divided again into summer and winter as well as Sunday and Weekday and by the hour of day. For the last point the day was divided into four groups: night (22:00–06:00), morning (06:00–10:00), day (10:00–16:00), and evening (16:00–22:00). Table 2 contains the parameters of lognormal modes representing the averaged size distribu-tions of the four-year data set.
The measured number size distributions can be used to calculate the total number, surface area, and volume concen-trations within the observed size range, assuming spherical particles. These calculations were done for all number size distributions divided into summer and winter, and into days, and Sundays. Saturday pattern were a mixture of week-day and Sunweek-day patterns, and therefore, for clarity, not shown here.
Figure 4a shows the diurnal variation in the total number concentration on weekdays and Sundays in summer and win-ter. The mean concentrations on weekdays were significantly higher in winter than in summer, and dominated by a peak in the morning at around 08:00 (difference in the concentrations in summer and winter was almost a factor of two) and by a less pronounced peak in the late afternoon (17:00–18:00). One reason for the higher morning maximum in winter may be the lower temperatures leading to higher supersaturation of the emitted gases, followed by higher nucleation rates, and as a second point less vertical mixing in the lower at-mosphere compared to summer days. In summer, the morn-ing rush hour was clearly recognizable between 06:00 and 08:00; however, the second peak at noon was slightly more pronounced. On Sundays, peaks occurred between 10:00 and 18:00.
The diurnal variation in the volume concentration on weekdays (cf. Fig. 4b) again clearly shows the rush-hour peaks. The new particle formation around noon in sum-mer was not evident in the volume concentration, neither on weekdays nor on Sundays. The reason is that new par-ticles are small (10–15 nm), and therefore their contribution to the particle volume is negligible. The volume concentra-tion in winter was significantly higher than that in summer, independent of the time of the day or the day of the week. In general, the variation in volume concentration during the day was much weaker than that in the number concentration,
Table 2. Fit parameter of lognormal modes describing the mean size distributions measured at the IfT, while Nt is given in particle number cm−3and ¯Dpin nm Parameter Nt1 σ1 D¯p1 Nt2 σ2 D¯p2 Nt3 σ3 D¯p3 Winter Weekdays night 2100 1.58 205 5100 1.72 61 16300 1.91 16 morning 1700 1.58 227 8200 1.96 55 32000 1.79 16 day 2200 1.59 207 7900 1.73 60 28600 1.83 15 evening 2200 1.61 199 8500 1.79 61 24600 1.83 16 Winter Sundays night 1600 1.56 218 6100 1.83 61 14600 1.85 15 morning 1800 1.61 205 5800 1.79 61 11500 1.84 15 day 1800 1.60 207 6300 1.77 60 15100 1.92 12 evening 1500 1.53 216 5700 1.81 64 15000 1.90 15 Summer Weekdays night 1100 1.61 209 6300 1.80 60 8800 2.00 18 morning 600 1.65 227 7800 2.02 57 15100 1.98 15 day 500 1.54 230 4600 2.01 65 19900 2.03 12 evening 400 1.62 220 4600 1.97 68 10600 2.07 15 Summer Sundays night 900 1.52 236 7200 1.82 60 5200 2.03 16 morning 1200 1.59 201 6300 1.84 56 4900 2.00 10 day 1200 1.52 215 5000 1.83 50 14800 1.90 12 evening 1100 1.62 180 6300 1.98 39 7200 1.95 11 0 1x10⁴ 2x10⁴ 3x10⁴ 4x10⁴ 0 4 8 12 16 20 24 0 5 10 15 20 S W S W a) Number concentration [cm -3 ] / Winter (Weekday/Sunday) / Summer (Weekday/Sunday) S W S W b) V o lume concentration [ µ m 3 cm -3 ] Time of day
Fig. 4. Mean diurnal variation in total number concentration and
total volume concentration on weekdays and Sundays in summer and winter and corresponding maximum 95%-confidence level (w = weekday, s = sunday).
indicating that, unlike particle number, volume is not influ-enced by short fluctuations in emission sources.
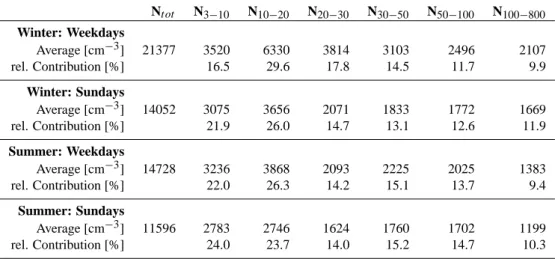
Mean values of number concentration for the size classes are given in Table 3 as well as the relative contribution of the size classes to the total number concentration. In winter, N10−20dominates significantly the number concentration. In
summer, the influence of N3−10 increases and reaches for
Sundays a similar value than N10−20. With increasing
di-ameters the relative contribution decreases.
A significant long-term trend in particle concentration was not recognizable: the total particle number concentration shows an increase of 1.7 ± 1.1 cm−3d−1(Standard error). The corresponding mean value was 16634 cm−3with a 95%-confidence level of ± 505.
3.2 Statistical investigation 3.2.1 Methods
Mean values were used to show, for example, variation of number size distributions (see Sect. 3.1), but they are not suit-able to find relationships between varisuit-ables within complex data sets. Various analysis techniques can be used on the long-term measurements in Leipzig to reveal the underlying deterministic behavior, and thus help clarify cause and ef-fect relationships in environmental problems. Time series analysis of other pollution data include studies by Salcedo et al. (1999); Lam et al. (1999); Iverson (1989); Morawska et al. (1998); Simpson (1992). Findings from those studies in-clude high correlation among PM10, PM2.5, and NO2(Lam et
al., 1999), good correlation among CO, NO/NO2, and PM10
(Morawska et al., 1998), and a strong influence of motor ve-hicle emissions on PM10(Simpson, 1992).
Table 3. Mean number concentrations of the total size range (Nt ot) and size fractions N3−10–N100−800 as defined above and relative
contribution of the size fractions to the total number concentration for weekdays and Sundays in Winter and Summer
Nt ot N3−10 N10−20 N20−30 N30−50 N50−100 N100−800 Winter: Weekdays Average [cm−3] 21377 3520 6330 3814 3103 2496 2107 rel. Contribution [%] 16.5 29.6 17.8 14.5 11.7 9.9 Winter: Sundays Average [cm−3] 14052 3075 3656 2071 1833 1772 1669 rel. Contribution [%] 21.9 26.0 14.7 13.1 12.6 11.9 Summer: Weekdays Average [cm−3] 14728 3236 3868 2093 2225 2025 1383 rel. Contribution [%] 22.0 26.3 14.2 15.1 13.7 9.4 Summer: Sundays Average [cm−3] 11596 2783 2746 1624 1760 1702 1199 rel. Contribution [%] 24.0 23.7 14.0 15.2 14.7 10.3
Here, statistical time series analysis was applied to the complete data set. First, auto-correlation functions were calculated to reveal periodic behavior of single variables (e.g. particle number concentration in a certain size range) and to identify typical time scales. Then, cross-correlation
functions were used to determine the correlation coefficient
between two time series that were shifted by an increasing time lag.
Multivariate data analysis is a tool to investigate com-plex data sets containing numerous measured parameters by revealing trends and relationships among these parameters. Here, multivariate data analysis was applied to the Leipzig data set to identify sources of aerosol particles and to quan-tify their contribution to variation in the measured aerosol parameters. Although several multivariate data analysis tech-niques have been applied to atmospheric data (e.g. Hansson et al., 1984; Wolff et al., 1984; Wiedensohler et al., 1996; Swietlicki et al., 1996; Statheropoulos et al., 1998), Principal
Component Analysis (PCA) is the most common, and
there-fore used here.
3.2.2 Correlation analysis
One major problem in analyzing a time series is understand-ing the periodic variations in the measured parameters. A time series is a superposition of cyclic variations with differ-ent amplitudes and random fluctuations. Correlation analysis is a suitable technique to identify these cyclic variations in the time domain.
The aim of correlation analysis is to investigate one or more time series of measured parameters (e.g. particle num-ber concentration) and to calculate the correlation coefficient as a function of the time lag τ . The methods are described in brief here (details are described in textbooks, such as B˚ath, 1974; Einax et al., 1997).
The correlation function used here is defined as (Einax et al., 1997) rxy(τ ) = 1 n n X t =0 x(t ) y(t + τ ) (2)
where x and y are identical (auto-correlation) or different (cross correlation) discrete functions of time (e.g. measured data), n is the total number of data points included, and τ = k · 1t with k = 0, 1, 2, . . .. The auto-correlation func-tion yields its maximum at τ = 0. For auto-scaled values (mean = 0, standard deviation = 1) this maximum value is 1. The occurrence of a relative maximum of rxx(τ )indicates
cyclic variations with period τ , whereas the value of rxx(τ )
yields the correlation coefficient for τ .
Additionally, the correlation analysis yields another prop-erty of the time series, namely, the auto-correlation analysis also contains information about the persistence of a time se-ries. This persistence indicates how much an individual mea-sured value depends on the preceding values (von Storch and Zwiers, 1999).
A measure for this persistence is the integral time scale, τα, defined as (Tennekes and Lumley, 1974)
τα = Z ∞
0
rxx(τ )dτ. (3)
Measured time series are always limited in time; therefore, Kaimal and Finnigan (1994) introduced τα as an integral up
to a designated value of τ . One possibility is to choose τ0to
be the value at which the auto-correlation function becomes zero for the first time. Another approach is to integrate up to τe, the value at which the auto-correlation function is
de-creased to e−1. For τ ταthe data are statistically
indepen-dent. The resulting τα is a typical time to observe a change
3.2.3 Principal Component Analysis
Large data sets usually contain a huge amount of informa-tion, which is often too complex for a straightforward inter-pretation. Principal Component Analysis (PCA) is a projec-tion method that helps extract more informaprojec-tion from a data set than when individual parameter analysis is used. The the-oretical background is described in brief here (and described in detail in a variety of textbooks, e.g. Fahrmeir et al., 1996; Einax et al., 1997).
PCA is basically a data reduction technique. The aim is to find linear combinations of the original variables that ac-count for as much of the total variance in the measured data as possible. The linear combinations fulfilling this condition are called Principal Components (PCs) and are by definition uncorrelated with each other. The first PC carries most of the information about the data (i.e. explains most of the variance in the data), the second one will then carry the maximum residual information, and so on. PCA is a special case of fac-tor analysis that transforms the original set of intercorrelated variables into a set of uncorrelated variables.
The main result of PCA are factor loadings, which reflect how much the variable (e.g. particle number concentration <10 nm) contributes to that particular PC and how well that PC describes the variation of that certain variable.
The data set including the relevant variables listed in Ta-ble 2 was analyzed by PCA using commercial software (The
Unscrambler, Version 6.1, Camo AS, Trondheim, NR). The
results of the complete set of measurements and variables will be presented here, covering 80 000 samples for each variable (e.g. particle number concentration < 10 nm).
The PCA can also be applied to different numbers of vari-ables. In particular, variables that are interdependent have to share their factor loadings if they all are included in the PCA. Examples of such well-correlated variables in the data set analyzed here are temperature, relative humidity, and global radiation. They are connected for several meteorological sit-uations. The PCA would show this as a result but it would not give any new information to interpret particle measure-ments. Global radiation was identified to force new parti-cle production (e.g. O’Dowd et al., 1999; Boy and Kulmala, 2002), and therefore were included in the PCA, whereas tem-perature and relative humidity were not included into the calculation presented below. Previous calculations showed no relevant correlation between humidity and other variables as discussed below. Including them gives mainly the result of their typical diurnal cycle of two anti-correlated variables such as temperature and relative humidity. Furthermore, to focus on more relevant parameters, such as wind direction, variables not apparently relevant for the interpretation (e.g. amount of precipitation) were also not included.
Table 4. Parameters for statistical analysis
Parameter Symbol Scaling method Particle concentration: Number 3–10 nm N3−10 log10 Number 10–20 nm N10−20 log10 Number 20–30 nm N20−30 log10 Number 30–50 nm N30−50 log10 Number 50–100 nm N50−100 log10 Number 100–800 nm N100−800 log10 Trace gas concentration
O3 O3 sqrt NO NO sqrt NO2 NO2 sqrt Meteorological parameter Atmospheric pressure p – Global radiation Q – Wind speed u sqrt Wind: x-component ux – Wind: y-component uy –
3.2.4 Data preparation for statistical analysis
All but two of the measured parameters were directly an-alyzed without further manipulation. The first exception was particle concentrations in the different size ranges, re-sulting from integration of number size distributions over a certain size range. The number concentration between 3 and 10 nm in diameter is labelled N3−10 and so on (see
Table 2). The other exception was wind direction, which is circular. The wind vector was therefore divided into a zonal (x) and a meridional (y) component. A positive x-component describes the east vector of the wind, and a posi-tive y-component describes the north vector. All of the data (particle, trace gas, and meteorological) were divided into two different seasons (summer and winter) and different days of the week to find longer-term differences.
Only the trace gases that were clearly linked with parti-cle concentration (e.g. for SO2 no correlation with
parti-cle concentration was found) were analyzed, and redundant data (e.g. CO and NO are both emitted by car traffic) in the entire data set were eliminated. Thus, particle number concentration for selected size classes, O3-, NO- and NO2
-concentrations, atmospheric pressure, global radiation, wind speed, and wind direction (Table 4) were used for the sta-tistical analysis. For the correlation analysis the time series were de-trended by using linear regression. For correlation analysis and PCA, all data were centered (i.e. average of resulting data set was 0) and then divided by the standard de-viation, resulting in statistically equivalent weight variables. PCA variables with extreme dynamic ranges were scaled (us-ing the method indicated in the last column in Table 2, and discussed in Sect. 3.5) to obtain a normal distribution of the input parameters.
1 2 3 -0.2 0.0 0.2 0.4 0.6 0.8 1.0
b)
Summer
N
3-10N
10-20N
20-30N
30-50N
50-100N
100-800 1 2 3 -0.2 0.0 0.2 0.4 0.6 0.8 1.0a)
Winter
Autocorrel
a
tion
function
Time lag [d]
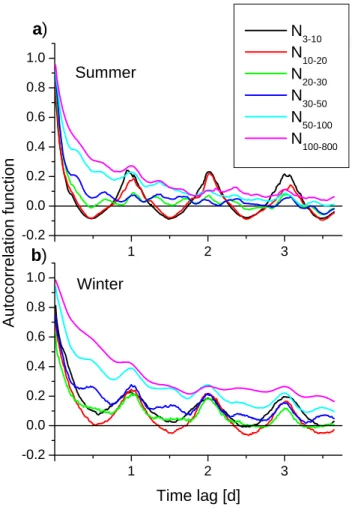
Fig. 5. Auto-correlation functions of different size classes
calcu-lated for weekdays in (a) summer and (b) winter.
3.3 Results of auto-correlation
Figure 5 shows auto-correlation functions calculated from measurements of the number size distributions limited to weekdays during summer and winter in 1997–2001. Re-sults of weekends are not presented here, because they do not show this cyclic behavior of weekdays caused by a more irregularly traffic pattern on weekends.
In summer, particles less than 20 nm (N3−10and N10−20)
showed a clear periodic behavior with a period of one day (peaks at multiples of 1 day). The relative maxima at time lags of 12 day, 1 12 day, etc., correspond to a negative cor-relation for these time lags. With increasing particle size, the peaks became less pronounced compared to these two smaller size classes (N3−10 and N10−20). Thus, only small
particles (Dp<20 nm) showed a typical diurnal cycle.
In winter, particles between 3 and 50 nm (N3−10–N30−50)
in particular also clearly showed a cyclic behavior with a pe-riod of about 1 day. These size classes are strongly influenced by car traffic, and peaks in traffic emissions are cyclic. The correlation coefficients for winter decreased slower with time
N3-10 N10-20 N20-30 N30-50 N50-100 N100-800 0 200 400 600 800 Inte gral tim e sca le [min]
Particle size class
Winter Summer
Fig. 6. Integral time scale calculated from the auto-correlation
func-tions of particle size concentration classes for summer and winter.
lag than those for summer, indicating that the winter data were more interdependent due to slower variations caused by less vertical dilution.
As described above (Sect. 3.2.3), a measure of the per-sistence of a time series is the integral time scale τα,
which could be calculated from the auto-correlation func-tion. For this study, ταwas calculated by integrating the
auto-correlation function up to τα= 1e as recommended in Kaimal
and Finnigan (1994). The integral time scale is a typical time for a variation in a certain variable.
The results are shown in Fig. 6 for the different particle size concentration classes. The minimum τα for winter was
approx. 70 min and occurred for particles between 20 and 30 nm (N20−30), and that for summer was approx. 60 min and
was for particles between 3 and 10 nm (N3−10). That means
typical changes in number concentration occur on a time scale of one hour and have its minimum in the size classes mentioned above. Typical τα of these two particle size
classes were around 60 min, and their concentration changed with respect to time faster than that of other size classes. Par-ticles between 20 and 30 nm (N20−30) were mostly
traffic-related and changes in concentration occurred rapidly, de-pending on the traffic density, which is the dominant parti-cle emission source in winter. Partiparti-cles smaller than 20 nm (N3−10 and N10−20) are predominantly produced by
inten-sive global radiation. This production process caused the dominant variations seen in summer. In contrast, the concen-tration of larger particles (greater than 50 nm; N50−100 and
N100−800) varied much slower, and their concentration
de-pended predominantly on the air mass transported to the site. The typical τα increased with increasing particle diameter
from 30 nm to 800 nm. The ταdiffered significantly between
summer and winter. For the largest particles (100–800 nm), τα was 920 min (more than 15 h) in winter, which is almost
three times higher than that in summer (320 min). This differ-ence was caused by differdiffer-ences in meteorological conditions between the two seasons; in winter, the stratification of the
1 2 3 -0.3 -0.2 -0.1 0.0 0.1 0.2 0.3 0.4
0.5 Summer Global radiation and N
3-10 N 10-20 N 20-30 N 30-50 N 50-100 N 100-800 Crossco rrel a ti on fu n c ti on Time lag [d]
Fig. 7. Cross-correlation functions of different particle size classes
and global radiation for weekdays in summer.
lowest part of the boundary layer that is relevant for ground-based measurements is stable more often than in summer, thus suppressing vertical dilution.
3.4 Results of cross-correlation
The time series of particle concentrations (N3−10–N100−800)
were correlated with all measured meteorological parameters and trace gases. However, only the key results showing clear correlations are presented here.
Figure 7 shows these cross-correlation functions between the time series of global radiation and particle concentration data for weekdays in summer.
Particles less than 20 nm (N3−10 and N10−20) correlated
well with the global radiation at a time lag of less than 1 h, which is recognizable as the maximum (> 0.3) in the corre-lation curve. The global radiation as well as these small par-ticles peaked around noon or one to two hours later within a cycle of 24 h, reflected by relative peaks in the correlation coefficient at time lags of 1 day. The time series of particle concentration was shifted with respect to the global radia-tion, indicating that the global radiation peaked before the small-particle concentration peaked. This result confirms the hypothesis that small particles (Dp <20 nm) are formed as
a consequence of photochemical processes, which strongly depends on the intensity of global radiation (e.g. O’Dowd et al., 1999; Birmili et al., 2000).
For particles between 20 and 50 nm (N20−30and N30−50),
the correlation coefficient was lower than that for particles less than 20 nm (N3−10and N10−20), and the peak for N30−50
was shifted slightly to time lags of less than 1 day. This lower coefficient and slight shift indicate that the depen-dence between particle concentration and global radiation decreases with increasing particle diameter. A similar shift was also seen for particles larger than 50 nm (N50−100 and
N100−800); however, the maximum correlation coefficient
was slightly higher for these two largest size classes
com-1 2 3 0.0 0.2 0.4 0.6 NO-concentration and Winter N3-10 N10-20 N20-30 N30-50 N50-100 N100-800 C rossc orrelation funct ion Time lag [d]
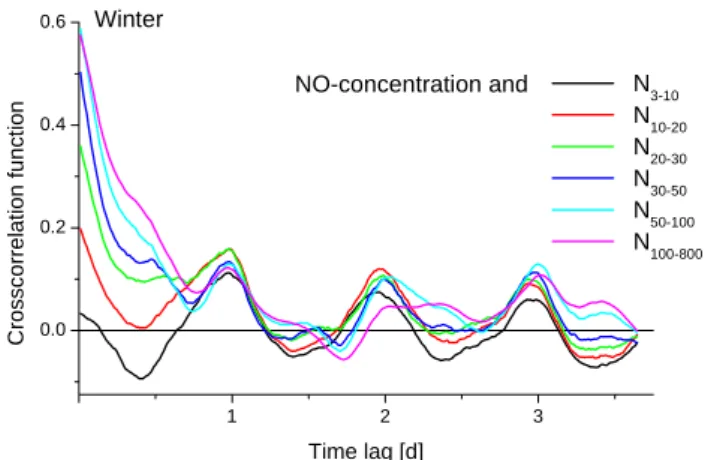
Fig. 8. Cross-correlation functions of different particle size classes
and NO concentration on weekdays in winter.
pared with N30−50. The phase shift between the two time
se-ries (i.e. between global radiation and N50−100or N100−800,
respectively) was 16–18 h. However, it is implausible that the radiation would influence large particles to such a long time lag; the higher particle concentration should rather be a result of the morning rush hour, other combustion processes, or boundary layer development and the corresponding dilu-tion. At a time lag of zero, the correlation coefficient was also almost zero between the two largest size classes and the global radiation, indicating no direct relationship.
The NO concentration measured close to roads is known to be an indicator of car traffic emissions. Particle size classes influenced by car traffic should therefore correlate well with the NO concentration, and thus show no large time lag. Fig-ure 8 shows the corresponding cross-correlation for winter. Particles larger than 30 nm (N30−50–N100−800) showed
cor-relation coefficients between 0.35 and 0.6 with the NO con-centration at a time lag of zero. Only particles less than 10 nm (N3−10) were nearly uncorrelated for a time lag of
zero. After a lag of 1 day, N10−20and N20−30show the best
correlation with NO (rxy = 0.17 for N10−20 and N20−30;
rxy =0.13 for N30−50and N50−100), indicating their cyclic
behavior connected with car traffic. The weakest correlation was for particles greater than 100 nm, and the next weakest was the fraction of these particles less than 10 nm. These re-sults correspond with the observed diurnal variation, where the particles between 10 and 100 nm are the most strongly influenced by car traffic and somewhat by domestic heating. 3.5 Results of Principal Component Analysis (PCA) Table 5 lists the key results of the calculated PCA in terms of the (factor) loadings of the variables for the first three PCs. For easier interpretation, loadings with an absolute value greater than 0.25 (arbitrarily chosen as showing stronger cor-relation) are in bold face. The last row in the table gives the percentage of the variance in the data that can be explained
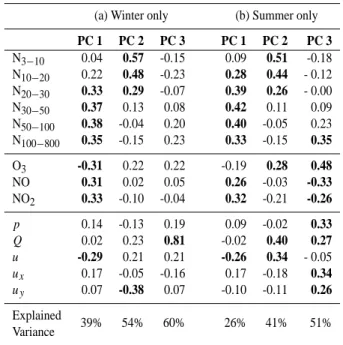
Table 5. Factor loadings of PCA calculated with selected variables
of winter and summer data, and the total variance explained (cumu-lative) by the individual PCs
(a) Winter only (b) Summer only
PC 1 PC 2 PC 3 PC 1 PC 2 PC 3 N3−10 0.04 0.57 -0.15 0.09 0.51 -0.18 N10−20 0.22 0.48 -0.23 0.28 0.44 - 0.12 N20−30 0.33 0.29 -0.07 0.39 0.26 - 0.00 N30−50 0.37 0.13 0.08 0.42 0.11 0.09 N50−100 0.38 -0.04 0.20 0.40 -0.05 0.23 N100−800 0.35 -0.15 0.23 0.33 -0.15 0.35 O3 -0.31 0.22 0.22 -0.19 0.28 0.48 NO 0.31 0.02 0.05 0.26 -0.03 -0.33 NO2 0.33 -0.10 -0.04 0.32 -0.21 -0.26 p 0.14 -0.13 0.19 0.09 -0.02 0.33 Q 0.02 0.23 0.81 -0.02 0.40 0.27 u -0.29 0.21 0.21 -0.26 0.34 - 0.05 ux 0.17 -0.05 -0.16 0.17 -0.18 0.34 uy 0.07 -0.38 0.07 -0.10 -0.11 0.26 Explained Variance 39% 54% 60% 26% 41% 51%
by the respective PC and the higher level PCs. For example, PC 1 explains 39% of the variance in the data for winter, and PC 1 and PC 2 combined explain 54% of the variance. Be-cause PC 1 to PC 3 explain a major part of the total variances (51% for summer and 60% for winter), PC 4 to 14 are not shown because of their relatively low explained variance.
To interpret the results, the first three individual PCs will be evaluated here.
3.5.1 Principal Component 1
In summer or winter, PC 1 (Table 5) showed the highest load-ings for N20−30–N100−800 and also for NO and NO2, thus
indicating a correlation between the particle number concen-tration in the range from 20–800 nm and the concenconcen-trations of NO and NO2. The NO and NO2concentrations are
indi-cators for combustion processes occurring in car engines, do-mestic stoves, and heating plants. Previously reported mea-surements at traffic-dominated sites found that the maximum number concentration occurred for diameters around 20 nm (e.g. Wehner et al., 2002). Vehicles directly emit signifi-cant numbers of particles in the size range between 40 and 100 nm (e.g. Maricq et al., 1999; Ristovski et al., 1998; Har-ris and Maricq, 2001). The concentration of particles greater than 100 nm (N100−800), however, also showed high loadings
(0.35 for winter and 0.33 for summer). PC 1 also represents emissions from other combustion processes such as heating plants and domestic stoves. The loading for the size class N3−10(0.04 for winter and 0.09 for summer) indicates that
these particles were not directly correlated. The significant negative correlation (−0.31) with the O3concentration can
be explained by the chemical balance between NOxand O3
leading to an anti-cyclical pattern of these species. The only meteorological parameter that showed remarkable loading for this PC is wind speed u. The loading of u was tive, indicating that high particle concentrations were nega-tively correlated with wind speed. Thus, the effect of direct emissions is enhanced by low wind speeds that suppress the dilution of emissions with clean air.
Although the loadings for summer and winter were almost identical for PC 1, the explained variance for the winter data (39%) was higher than that for summer (26%), clearly indi-cating a lower influence of combustion processes and a more rapid dilution of emitted particles in summer.
3.5.2 Principal Component 2
In winter, PC 2 showed high loadings in N3−10–N20−30and
a negative loading (< 0.25) in uy, indicating that the smallest
size fraction of particles (< 30 nm) was correlated with wind directions from the south. This result is difficult to inter-pret because of the insignificant role of small particles during winter. In summer, PC 2 is also strongly correlated with the global radiation Q, the wind speed u, and the ozone concen-tration O3, thus indicating that the formation of new particles
as well as ozone is enhanced by the intensity of global radia-tion and by higher wind speeds. This result agrees well with results in Fig. 3, with results from the correlation analysis (Sect. 3.4), and with previous studies (e.g. Weber et al., 1999; Boy and Kulmala, 2002). The new particles are formed as a consequence of photochemical reactions of gaseous species. This PC was slightly negatively correlated with N100−800and
positively correlated with u, thus indicating that new parti-cle formation is forced when parti-cleaner air is transported to the measurement site and emissions are diluted.
No information is yet available on where in the atmosphere the new particles are produced. Nilsson et al. (2001); Bigg (1997) and others hypothesized as follows that the formation occurs if two differently polluted layers are mixed by turbu-lent processes. On a summer day with intense global radia-tion, the depth of the mixed layer (ML) increases slowly after sunrise because of the strong nocturnal stable layer that caps the young ML. By late morning usually, the cool nocturnal air has been warmed to a temperature near that of the resid-ual layer. Subsequently, the top of the ML will rise to the base of the residual layer. The ML will then grow rapidly and existing pollution will be vertically well mixed. New particles might also be formed when the new ML reaches the residual layer and the different air masses are mixed. This turbulent mixing of different air masses with different tem-perature, humidity, and gaseous compounds might lead to lo-cally restricted nucleation events. This hypothesis and other possible formation mechanisms were discussed by Nilsson et al. (2001). In an urban atmosphere, the conditions are
however more complex. Because particle formation within remote regions such as arctic or coastal environments is not understood yet, an explanation for urban environments is not yet feasible.
3.5.3 Principal Component 3
In winter, PC 3 showed a high loading only in the global ra-diation Q. In summer, the correlation with other variables was more significant. For example, PC 3 correlated with the concentration of large particles (N100−800), ozone O3,
atmo-spheric pressure p, wind directions ux and uy, and global
radiation Q with loadings greater than 0.25, but was nega-tively correlated with NOxconcentration. The combination
of the positive loadings of p, Q, ux, and uy describes the
meteorological situation of a high pressure region over East-ern Europe connected with high global radiation and wind coming from the northeast. This meteorological situation usually leads to the advection of continental (polluted) air from Eastern Europe. Continental air usually contains higher concentrations of particles larger than 100 nm than does less polluted air masses, e.g. a marine air mass (Pueschel et al., 1986). Such a polluted air mass influenced by high global radiation enhances the ozone formation in an urban region followed by a decrease in NOxconcentration.
PC 3 was also slightly negatively correlated with N3−10,
indicating a negative correlation between global radiation and the formation of new particles. However, PC 2 shows a positive correlation for these two parameters. Together, these correlations of these two PCs indicate that the occur-rence of new particle production depends not only on the presence of intense global radiation but also on the proper-ties of the present air mass. The presence of a high particle surface-area concentration prevents nucleation due to diffu-sion of small particles and condensed material to the surface of larger particles (e.g. Friedlander et al., 1991; Covert et al., 1992).
In winter, not all of these correlations were observed. The ozone concentration O3 is correlated mainly with global ra-diation Q. Loadings of the other meteorological variables and N100−800 were smaller than those in summer due to the
insignificant role of new particle formation and related pro-cesses in winter.
Assuming that the higher order PCs (4–14) contained only noise and therefore can be neglected, the 60% explained vari-ance in winter and 51% in summer by PC 1–PC 3 can be treated as the reasonable fraction of variance (100%) exclud-ing the noise. Thus, based on the assumption that these first three PCs explain 100% of the variance, PC 1 explains 65% of the variance in winter (39% of 60%) and 51% in summer, neglecting the noise. The identification of PC 1 as the con-tribution of combustion sources can be interpreted as 65% (51% in summer) of the submicrometer particles (diame-ter < 800 nm) coming from fossil fuel combustion, such as power plants, vehicle engines, and domestic heating. Based
on this 100% assumption, PC 2 explains 25% of the vari-ance in winter (29% in summer), thus indicating that new particle formation in connection with high global radiation contributes 25% in winter and 29% in summer, respectively, variance in the submicrometer aerosol. According to the PC 3 loading based on this 100% assumption, the advection of accumulation mode particles contributed about 10% in win-ter and 20% in summer to the number concentration of sub-micrometer aerosol.
Various model runs with nearly every combination of vari-ables were performed. In particular, possible relations be-tween new particle formation and humidity were investigated in more detail. The only result was that relative humidity showed a negative correlation with new particle formation in PC 2 due to the contrarian diurnal cycle of relative humidity and temperature/radiation. To eliminate this diurnal cycle, diurnal means were calculated and used for PCA. However, the result was the same, because radiation days with new par-ticle formation are usually dryer that cloudy days. Addition-ally the absolute humidity was used for PCA, 15min-values as well as diurnal means but they did not show any clear cor-relation in summer again negative corcor-relation. The only ef-fect the usage of such connected variables, as temperature and relative humidity, has is that factor loadings decrease be-cause they have to share their correlations. Therefore, vari-ables without clear correlation with particle concentrations resulting from previous PCA runs were left out of the final calculation presented here.
4 Summary and conclusions
This study focused on a 4-year data set of particle number size distributions, trace gases, and meteorological parameters measured in the urban area of Leipzig (Germany).
The total number concentration in winter was generally higher, caused by increased particle emissions (e.g. from heating processes) and by different meteorological condi-tions suppressing vertical exchange (e.g. due to capping in-versions). The peaks in concentration occurred at particle diameters between 20 and 30 nm and were linked to morn-ing rush hour (∼ 08:00 on weekdays). In summer, a second peak around noon occurred at particle sizes around 10 nm on weekdays as well as on weekends, induced by photochemi-cally induced production of new particles. This confirms that the concentration of anthropogenically emitted trace gases is not critical for particle formation in urban areas or that con-centrations of these gases are always sufficiently high enough to trigger new particle formation.
Correlation analysis confirmed the typical diurnal cycle of particles less than 100 nm with a peak in the number concen-tration during the morning rush hour. Furthermore, time se-ries of ultrafine particles (< 20 nm) were well correlated with those of global radiation, particularly during summer. High correlations between the number concentration of particles
larger than 20 nm and the NO concentration were found in winter, indicating that the occurrence of these particles is di-rectly related to emissions from combustion processes.
Principal Component Analysis (PCA) confirmed that vari-ations in the submicrometer aerosol (less than 1000 nm) were mainly due to combustion processes, as indicated by high correlation between the concentrations of NO and NO2
and the number concentrations of particles between 20 and 800 nm. Neglecting noise in the analysis, this correlation explains 65% of the total variance of the data in winter and 51% in summer. PCA clearly showed that the number concentration of accumulation mode particles (between 100 and 800 nm) also strongly depended on the amount of direct emissions. A relationship between particles above 100 nm and traffic patterns was not recognizable without the use of statistical methods, due to the low number concentration of particles in this size range. Meteorological conditions sig-nificantly influence the particle concentrations, and thus pos-sibly enhance the influence of a particle source; for exam-ple, under high pressure weather conditions during winter, the pollutants are often trapped below an inversion layer.
Especially during summer, the formation of new parti-cles significantly influences the total number concentration. However, this influence is not completely understood at con-tinental sites due to the complexity of the gaseous pollu-tants. Our statistical analysis of the Leipzig data confirmed the connection between periods of intense global radiation and the occurrence of small particles (less than 20 nm) under the presence of a clean air mass (low concentration of parti-cles smaller than 100 nm). Detailed clarification of particle formation will require vertical profiles of meteorological pa-rameters, to examine a possible connection with the devel-opment of a convective boundary layer that strongly depends on global radiation.
The results presented here provide a large, unique database that is characterized by particle number size distribution measurements down to 3 nm. This study contains represen-tative aerosol data for an urban area that are representable by simple modal parameters for the different seasons, days of the week, and times of day. This data set can provide valu-able parameters for climate models to calculate the climate forcing of aerosol particles.
Moreover, the results of this long-term study are suitable for correlation with epidemiological data. Such a compar-ison might reveal the influence of the submicrometer parti-cle concentration on respiratory diseases in urban areas more clearly than previous experiments that cover more narrow size ranges. The quality of epidemiological studies might be improved due to the high size resolution of the number size distributions and the long duration of the study. One of the next step will be to compare different measurement sites within one city and find out how representative one (this) site is.
Acknowledgements. The authors thank Anett Kappe for doing the
trace gas measurements during the experiment and preparing the data for investigation, and thank Kerstin Flachowsky for provid-ing meteorological data over the past few years. Thanks to Uta Schmieder and Katrin Lehmann for their help in data preparation.
References
B˚ath, M.: Spectral Analysis in Geophysics, pp. 563 , Elsevier Sci-entific, Amsterdam, 1974.
Bigg, E. K.: A mechanism for the formation of new particles in the atmosphere, Atmospheric research, 43, 129–137, 1997. Birmili, W., Stratmann, F., and Wiedensohler, A.: Design of a
DMA-based Size Spectrometer for large particle size range and stable operation, J. Aerosol Sci., 30, (4), 549–554, 1999. Birmili, W. and Wiedensohler, A.: New particle formation in the
continental boundary layer: Meteorological and gas phase pa-rameter influence, Geophys. Res. Lett., 27, 3325–3328, 2000. Boy, M. and Kulmala, M.: Nucleation events in the continental
boundary layer: Influence of physical and meteorological param-eters, Atmos. Chem. Phys., 2, 1–16, 2002.
Buzorius, G., H¨ameri, K., Pekkanen, J., and Kulmala, M.: Spatial variation of aerosol number concentration in Helsinki city, At-mos. Environ., 33, 553–565, 1999.
Covert, D. S., Kapustin, V. N., Quinn, P. K., and Bates, T. S.: New Particle Formation in the Marine Boundary Layer, J. Geophys. Res., 97, D18, 20 581–20 589, 1992.
Einax, J. W., Zwanziger, H. W. and Geiss, S.: Chemometrics in En-vironmental Analysis, VCH Verlagsgesellschaft mbH, pp. 384, Weinheim, 1997.
Fahrmeir, L., Hamerle, A. and Tutz, G.: Multivariate statistische Verfahren(German), de Gruyter, Berlin, 2nd edition, pp. 902, 1996.
Friedlander, S. K., Koch, W., and Main, H. H.: Scavenging of a co-agulating fine aerosol by a coarse particle mode, J. Aerosol Sci., 22, 1–8, 1991.
Hansson, H.-C., Martinsson, B. G., and Lannefors, H. O.: Long range aerosol transport in southern Sweden: An example of multivariate statistical evaluation methodology, Nucl. Instr. and Meth., 3, 483–488, 1984.
Harris, J. S. and Maricq, M. M.: Signature size distributions for diesel and gasoline engine exhaust particulate matter, J. Aerosol Sci., 32, 749–764, 2001.
Harrison, R. M., Jones, M., and Collins, G.: Measurements of the Physical Properties of Particles in the Urban Atmosphere, At-mos. Environ., 33, 309–321, 1999.
Heintzenberg, J.: Properties of the Log-Normal Particle Size Distri-bution, J. Aerosol Sci. Technol., 21, 46–48, 1994.
Hughes, L. S., Cass, G. R., Gone, J., Ames, M., and Olmez, I.: Physical and chemical characterization of atmospheric ultrafine particles in the Los Angeles area, Environ. Sci. Technol., 32, (9), 1153–1161, 1998.
Iversen, T.: Some statistical properties of ground level air pollution at Norwegian Arctic stations and their relation to large scale at-mospheric flow systems, Atmos. Environ., 23, 2451–2462, 1989. Kaimal, J. C. and Finnigan, J. J.: Atmospheric Boundary Layer
Flows, Oxford University Press, New York, 1994.
Lam, G. C. K., Leung, D. Y. C., Niewiadomski, M., Pang, S. W., Lee, A. W. F., and Louie, P. K. K.: Street-level concentrations of
nitrogen dioxide and suspended particulate matter in Hong Kong, Atmos. Environ., 33, 1–11, 1999.
Kuhlbusch, T. A. J., Hertlein, A.-M., and Sch¨utz, L. W.: Sources, determination, monitoring, and transport of carbonaceous aerosols in Mainz, Germany, Atmos. Environ., 32, (32), 1097– 1110, 1998.
Maricq, M. M., Podsiadlik, D. H., and Chase, R. E.: Gasoline Ve-hicle Particle Size Distributions: Comparison of Steady State, FTP and US06 Measurements, Environ. Sci. Technol., 33, 2007– 2015, 1999.
Morawska, L., Thomas, S., Bofinger, N., Wainwright, D., and Neale, D.: Comprehensive characterization of aerosols in a sub-tropical urban atmosphere: particle size distribution and correla-tion with gaseous pollutants, Atmos. Environ., 32, 2467–2478, 1998.
Nilsson, E. D., Rannik, ¨U., Kulmala, M., Buzorius, G., and O’Dowd, C. D.: Effects of continental boundary layer evolution, convection, turbulence and entrainment, on aerosol formation, Tellus, 53B, 441–461, 2001.
O’Dowd, C. D., McFiggans, G., Creasey, D. J., Pirjola, L., Hoell, C., Smith, M. H., Allan, B. J., Plane, J. M. C., Heard, D. E., Lee, J. D., Pilling, M. J., and Kulmala, M.: On the photochemical pro-duction of new particles in the coastal boundary layer, Geophys. Res. Lett., 26, 1707–1710, 1999.
Peters, A., Wichmann, H. E., Tuch, T., Heinrich, J., and Heyder, J.: Respiratory effects are associated with the number of ultrafine particles, Am. J. Respir. Crit. Care Med., 155, 1376–1383, 1997. Pope, C. A. III and Dockery, D. W.: Epidemiology of particle
ef-fects, Air poll. Health, 31, 673–705, 1999.
Pueschel, R. F., van Valin, C. C., Castillo, R. C., Kadlecek, J. A., and Ganor, E.: Aerosols in Polluted versus Nonpolluted Air Masses: Long-Range Transport and Effects on Clouds, J. Climate and Ap-plied Meteorology, 25, (12), 1908–1917, 1986.
Ristovski, Z. D., Morawska, L., Bofinger, N. D., and Hitchins, J.: Submicrometer and supermicrometer particulate emissions from spark ignition vehicles, Environ. Sci. Technol., 32, (24), 3845– 3852, 1998.
Roorda-Knape, M. C., Janssen, N. A. H., de Hartog, J. J., van Vliet, P. H. N., Harssema, H., and Brunekreef, B.: Air pollution from traffic in city districts near major motorways, Atmos. Environ., 32, (11), 1921–1930, 1998.
Salcedo, R. L. R., Alvim Ferraz, M. C. M., Alves, C. A., and Mar-tins, F. G.: Time-series Analysis of Air Pollution Data, Atmos. Environ., 33, 2361–2372, 1999.
Simpson, R. W.: A statistical analysis of particulate data sets in Brisbane, Australia, Atmos. Environ., 26B, 99–105, 1992. von Storch, H. and Zwiers, F. W.: Statistical Analysis in Climate
Research, University Press, Cambridge, pp. 484, 1999.
Statheropoulos, M., Vassiliadis, N., and Pappa, A.: Principal com-ponent and canonical correlation analysis for examining air pol-lution and meteorological data, Atmos. Environ., 32(6), 1087– 1095, 1998.
Swietlicki, E., Puri, S., Hansson, H.-C., and Edner, H.: Urban air pollution source apportionment using a combination of aerosol and gas monitoring techniques, Atmos. Environ., 30(15), 2795– 2809, 1996.
Tennekes, H. and Lumley, J. L.: A First Course in Turbulence, The MIT Press, Cambridge, Massachusetts, London, pp. 300, 1974. Tuch, T., Brand, P., Wichmann, H. E., and Heyder, J.: Variation of
Particle Number and Mass Concentration in Various Size Ranges of Ambient Aerosols in Eastern Germany, Atmos. Environ., 31, 4293–4197, 1997.
V¨akev¨a, M., H¨ameri, K., Kulmala, M., Lahdes, R., Ruuskanen, J., and Lahtinen, T.: Street level versus rooftop Concentrations of submicron aerosol particles and gaseous pollutants in an urban street canyon, Atmos. Environ., 33, 1385–1397, 1999.
van der Zee, S. C., Hoek, G., Harssema, H., and Brunekreef, B.: Characterization of particulate air pollution in urban and non-urban areas in the Netherlands, Atmos. Environ., 32, (21), 3717– 3729, 1998.
W˚ahlin, P., Palmgren, F., v. Dingenen, R., and Raes, F.: Pronounced decrease of ambient particle number emissions from diesel traffic in Denmark after reduction of the sulfur content in diesel fuel, Atmos. Environ., 35, 3549–3552, 2001.
Weber, R. J., McMurry, P. H., Mauldin III, R. L., Tanner, D. J., Eisele, F. L., Clarke, A. D., and Kapustin, V. N.: New particle formation in the remote troposphere: A comparison of observa-tions at various sites, Geophys. Res. Lett. 26(3), 307–310, 1999. Wehner, B.: Particle formation in the urban atmosphere, PhD thesis,
Univ. Leipzig, pp. 117, 2000.
Wehner, B., Birmili, W., Gnauck, T., and Wiedensohler, A.: Particle number size distributions in a street canyon and their transforma-tion into the urban-air background: Measurements and a simple model study, Atmos. Environ., 36, 2215–2223, 2002.
Whitby, E. R. and P. H. McMurry, Modal Aerosol Dynamics Mod-elling, J. Aerosol Sci. Technol., 27, 673–688, 1997.
Wichmann, H. E., Spix, C., Tuch, T., W¨olke, G., Peters, A., Hein-rich, J., Kreyling, W. G., and Heyder, J.: Daily mortality and fine and ultrafine particles in Erfurt, Germany Part I: Role of particle number and particle mass, Health Effects Institute Report No. 98, 2000.
Wiedensohler, A., Covert, D. S., Swietlicki, E., Aalto, P., Heintzen-berg, J., and Leck, C.: Occurrence of an ultrafine particle mode less than 20 nm in diameter in the marine boundary layer during Arctic summer and autumn, Tellus, 48B, 213–222, 1996. Wolff, G. T., Morrissey, M. L., and Kelly, N. A.: An Investigation of
the Sources of Summertime Haze in the Blue Ridge Mountains Using Multivariate Statistical Methods, J. Clim. Appl. Meteorol., 23, (9), 1333–1341, 1984.
Woo, K. S., Chen, D. R., Pui, D. Y. H., and McMurry, P. H.: Mea-surement of Atlanta Aerosol Size Distributions: Observation of ultrafine particle events, Aerosol Science and Technology, 34, 75–87, 2001.