HAL Id: hal-01994561
https://hal.sorbonne-universite.fr/hal-01994561
Submitted on 25 Jan 2019
HAL is a multi-disciplinary open access archive for the deposit and dissemination of sci-entific research documents, whether they are pub-lished or not. The documents may come from teaching and research institutions in France or abroad, or from public or private research centers.
L’archive ouverte pluridisciplinaire HAL, est destinée au dépôt et à la diffusion de documents scientifiques de niveau recherche, publiés ou non, émanant des établissements d’enseignement et de recherche français ou étrangers, des laboratoires publics ou privés.
Hydrogen, boron and nitrogen atoms in diamond: a
quantum mechanical vibrational analysis
Francesco Silvio Gentile, Simone Salustro, Giulio Di Palma, Mauro Causá,
Philippe D’arco, Roberto Dovesi
To cite this version:
Francesco Silvio Gentile, Simone Salustro, Giulio Di Palma, Mauro Causá, Philippe D’arco, et al.. Hydrogen, boron and nitrogen atoms in diamond: a quantum mechanical vibrational analysis. The-oretical Chemistry Accounts: Theory, Computation, and Modeling, Springer Verlag, 2018, 137 (11), pp.154. �10.1007/s00214-018-2375-0�. �hal-01994561�
Hydrogen, boron and nitrogen atoms in diamond: a quantum
mechanical vibrational analysis
Francesco Silvio Gentile1 · Simone Salustro1 · Giulio Di Palma1 · Mauro Causà2 · Philippe D’Arco3 · Roberto Dovesi1
Abstract
The structural, electronic and vibrational properties of two common defects in diamond, CHN and CHB, describing the case in which a carbon C1 atom is substituted by a nitrogen atom, or by a boron atom, breaking a C1–C2 bond, followed by the saturation of the dangling bond of C2 by a hydrogen atom, are investigated at the quantum mechanical level, by using a periodic supercell approach, hybrid DFT functionals and a local Gaussian-type basis set as implemented in the CRYSTAL code. The effect of concentration of the defects has been explored, by considering two supercells containing 64 and 216 atoms (S64 and S216). Formation and hydrogenation energies, geometries, Mulliken charges and the band structure of both defects are reported. The vibrational features of the defects have been investigated, by generating the IR and Raman spectra, and by analyzing graphically and through the isotopic substitution (H → D, 11B → 10B and 14N → 15N) the nature of the most relevant modes related to the defects. The computed C–H stretching mode of CHN, once corrected for anharmonicity (3408 cm−1 ), falls to wavenumbers very close to the experimental peak observed at 3394 cm−1 , which can then be reasonably attributed to this specific defect. The present manuscript is included in a special volume in honor and memory of János Ángyán. Although he did not study in particular the kind of defects discussed in the present manuscript, the many methodological contributions he introduced in computational science have inspired many of the tools we have been using here. One of the present authors, RD, in particular, is grateful to János for the illuminating discussions they had in Paris, Nancy and Torino.
1 Introduction
Since several decades, diamond has represented a material of high technological relevance, thanks to its extreme physical properties which make it attractive for many applications in different fields, ranging from microelectromechanical sys-tems to heatsinks, laser windows, particle detectors, etc. [1,
2].
Among the large plethora of point defects in diamond, hydrogen is one of the most important impurities. It is included during the growth of natural diamond as well as in chemical vapor deposition (CVD) processes, and it is cer-tainly present at the surfaces. A non-minor fraction, how-ever, is also thought to be incorporated in the bulk. Hydro-gen atoms are supposed to be present in several defects [3,
4], involving vacancies and/or isolated or aggregated nitro-gen atoms. It is mostly identified through its infrared (IR) active modes (stretching and bending), although probably not all hydrogen atoms present in diamond are IR active.
However, hydrogen is only one of the possible impurities in diamond; among the many, nitrogen and boron are two of the most observed and discussed.
Electronic supplementary material The online version of this article (https ://doi.org/10.1007/s0021 4-018-2375-0) contains supplementary material, which is available to authorized users. * Francesco Silvio Gentile
francesco.gentile@unina.it
1 Dipartimento di Chimica, Università di Torino and NIS
(Nanostructured Interfaces and Surfaces) Centre, Via P. Giuria 5, 10125 Turin, Italy
2 Dipartimento di Ingengeria Chimica, dei Materiali e delle
Produzioni Industriali DICMAPI, Università degli Studi di Napoli Federico II, Piazzale Vincenzo Tecchio 80, 80125 Naples, Italy
3 CNRS-INSU, Institut des Sciences de la Terre de Paris,
ISTeP UMR 7193, Sorbonne Université, F-75005 Paris, France
They can be both present as substitutional defects without leading to substantial distortions to the diamond structure [5].
Single substitutional nitrogen and boron, however, bring a dangling bond on one of the four neighboring carbon atoms, which can be saturated by a hydrogen atom. The resulting defects (CHN and CHB centers) have been largely studied through computational methods and attributed to many experimental features. In particular, the CHN defect has been at first associated [6] with the absorption band at 3107 cm−1 , it has recently been firmly established that this mode is the CH stretching of VN3 H (a vacancy surrounded by three N atoms and one CH group, see Refs. [7, 8]); later on, it has been associated by the same authors [9] to the peak at 3324 cm−1.
The CHB center has been related to the modes at 2664 and 1975 cm−1 through simulations based on the LDA func-tional [6].
As a result of theoretical developments [10] and computa-tional implementation of fully analytic quantum mechanical methods for the evaluation of infrared and Raman spectra in solids [10–12], computational vibrational spectroscopy is now established as an additional and effective tool in the interpretation of experimental spectra [13–15]. In a series of previous works [7, 16–24] some of the present authors have proposed the quantum-mechanical characterization of several point defects in diamond. In this work, electronic and spectroscopic features of substitutional nitrogen and boron atoms neighboring an interstitial hydrogen are discussed. Calculations are performed within a periodic supercell scheme. The hybrid B3LYP functional, as implemented in the crystal program [10], is applied. The effects of different defect concentrations are explored.
The paper is structured as follows: Section 2 reports information on the adopted computational setup. Section 3
is organized in two parts. Section 3.1 is devoted to the equi-librium geometry of the studied defects, to their charge dis-tribution and to their band structure. In Sect. 3.2, the vibra-tional features of the defects are reported and analyzed. In Sect. 4, some conclusions are drawn. Finally, in Supplemen-tal section, the effect of temperature on the hydrogenation process is presented and discussed.
2 Computational methods
Calculations have been performed by using the B3LYP global hybrid functional [25, 26], as implemented in the crystal17 program [27]. An all-electron basis set of Gauss-ian-type functions has been adopted (Pople’s 6-21G) for C, B and N. The exponent of the most diffuse sp shell of the carbon atom has been optimized in bulk diamond (0.23 Bohr−2 ); for the other atoms, default values have been used.
For hydrogen, the 6-31G set has been adopted [28]. The insertion energy of the hydrogen atom and the X−H anhar-monic vibrational frequency have been calculated also with larger basis sets (6-21G∗ , 6-31G and 6-31G∗ [29]) and other functionals, ranging from pure (LDA [30] and PBE [31]), to global (PBE0 [32]), and range-separated (HSE06 [33]) hybrids. The truncation of the Coulomb and exchange infi-nite lattice series is controlled by five thresholds T i (see
crystal manual, reference [34], for more details), which have been set to 8 (T1–T4 ) and 16 (T5 ). The convergence threshold on energy for the self-consistent-field (SCF) proce-dure has been set to 10−8 Hartree for structural optimizations and to 10−10 Hartree for vibration frequency calculations.
The DFT exchange–correlation contribution to the Fock matrix has been evaluated by numerical integration over the unit cell volume. Radial and angular points for the integra-tion grid are generated through Gauss–Legendre radial quad-rature and Lebedev two-dimensional angular point distribu-tions. The default pruned grid with 75 radial and 974 angular points has been used, whose accuracy can be measured by comparing the integrated charge density (Ni) in the largest
supercell here considered (216 atoms), Ni= 1298.028 , with
the total number of 1298 electrons in the unit cell.
Supercells of increasing size have been used for simulat-ing the effect of defect concentrations. Two cubic super-cells containing, respectively, 64 (S64 ) and 216 (S216 ) atoms have been considered; for each cell, a different Γ-centered Pack–Monkhorst grid for sampling the reciprocal space has been used, consisting of 4× 4 × 4 = 64 (S64 ) and 2 × 2 × 2 = 8 (S216 ) k-points in the first Brillouin Zone. 2.1 Harmonic frequencies and the IR and Raman
spectra
Frequencies at the Γ point are obtained within the harmonic approximation by diagonalizing the mass-weighted Hessian matrix, W, whose elements are defined as [13, 35–38]
where M𝛼 and M𝛽 are the masses of atoms associated with
the i and j atomic coordinates. Once the Hessian matrix,
H𝟎
𝛼i,𝛽j , has been calculated, frequency shifts due to isotopic
substitutions can be calculated readily, at no computational cost, by changing masses in Eq. 1.
Energy first derivatives with respect to the atomic displace-ments, v𝛼,j= 𝜕E
/
𝜕u𝛼,j , are calculated analytically for all the u𝛼,j coordinates (E is the total energy, u𝛼,j is the displacement
coordinate with respect to the equilibrium, 𝛼 labels each atom), whereas second-order derivatives at the equilibrium geometry (1) WΓ 𝛼i,𝛽j= H𝛼i,𝛽j𝟎 √ M𝛼M𝛽 with H 𝟎 𝛼i,𝛽j= � 𝜕2E 𝜕u𝟎 𝛼i𝜕u 𝟎 𝛽j � ,
are calculated numerically using a single displacement along each coordinate:
Previous calculations [35, 39] have shown that in bulk sys-tems the influence of u is very small (less than 1 cm−1 ) when H atoms are not present; much larger effects have been found for katoite [40], brucite [41] and diaspore [42], related to the anharmonicity of the OH stretching. More generally, anhar-monicity is large in all cases in which H atoms are involved (vide infra).
Integrated intensities for IR absorption p are computed
for each mode p by means of the mass–weighted effective-mode Born-charge vector 𝐙p [43, 44] evaluated through a
CPHF/KS approach: [11, 45]
The relative Raman intensities of the peaks are computed analytically by exploiting a scheme illustrated in Refs. [46,
47]. Both schemes are based on the solutions of first- and second-order coupled Perturbed–Hartree–Fock/Kohn–Sham (CPHF/KS) equations [48, 49].
2.2 The anharmonicity of the C–H vibrational frequency
The importance of anharmonicity in H containing systems can be appreciated by looking at the anharmonicity constant
𝜔e𝜒e of some simple diatomic molecules such as H 2 , HF,
HCl, HBr, F 2 , Cl2 , Br2 , where 𝜔e𝜒e is 121, 90, 53, 45, 12, 3
and 1 cm−1 , respectively [50].
As regards the C–H stretching, its value is estimated to be around 60 cm−1 for many organic molecules [51, 52].
Experimentally, when both the fundamental frequency
𝜔01 and the first overtone 𝜔02 are available, 𝜔e𝜒e can be
obtained through the formula
that permits also the definition of the harmonic frequency
𝜔e as:
These formulae are derived from the eigenvalues of the Morse potential UM(r) = D[1 − e−𝛼(r−re)]2 , which are:
and, as usual: (2) [𝜕v 𝛼j 𝜕u𝛽i ] ≈ v𝛼j(0, … , u𝛽i, … , 0) − v𝛼j(0, … , 0, … , 0) u𝛽i (3) p∝|||𝐙p||| 2 . (4) 𝜔e𝜒e= (2𝜔01− 𝜔02) 2 (5) 𝜔e= 𝜔01+ 2𝜔e𝜒e (6) En= 𝜔e (n + 1 2 ) − 𝜔e𝜒e (n + 1 2 )2 (7) 𝜔01= E1− E0 and 𝜔02= E2− E0
CH, NH and in particular OH bonds show large anharmonic effects. These groups are quite common in molecules and molecular crystals. The last one plays an important role in crystalline solids, as it is present in many different types of compounds, spanning from ionic (like metal hydroxides) to semi-covalent (like silicates and aluminosilicates).
3 Results
3.1 Geometry, charge distribution, band structure and formation energy
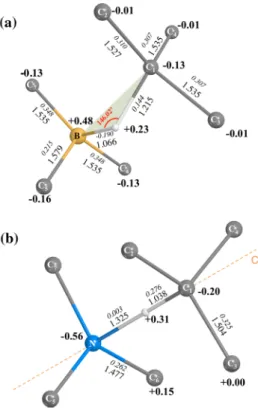
In the top-left panel of Fig. 1, the conventional cell of dia-mond is shown, in which a CHΣ defect is created, where Σ stands for B (Fig. 1a) or N (Fig. 1b). Bond distances (in Å), atomic net charges Q (in |e| ) and bond populations (BP, in |e| ) are reported. Q and BP are obtained from a Mulliken
analysis of the charge distribution.
The local symmetry of CHN is C3v , the C3 rotation axis being oriented along the C1–H–N line. In CHB, on the con-trary, the H atom is not on the line connecting C1 and B (the angle is 146◦ instead of 180◦ ), and occupies a general position. This has important consequences, in particular for the IR and Raman spectra. The C 1 –H distance is 1.038 Å in CHN, and 1.215 Å in CHB, with a bond population that reduces from 0.276 |e| in the former, to 0.144 |e| in the latter. Then, in CHB, the C 1 H bond is longer, and less covalent than in CHN. The N–H distance is 1.325 Å (steric effect due to the lone pair), whereas the B–H distance is much shorter, 1.066 Å .
The C 1 –H bond is strongly polarized in CHN, as a con-sequence of the presence of the N lone pair, oriented toward the H atom: the net charges on H being + 0.31 versus + 0.23 (CHB), and − 0.20 versus − 0.13 |e| on C 1 . The N net charge is − 0.56 |e| , and is to a large amount compensated by the three nearest carbon atoms (+ 0.15 × 3 = + 0.45 |e|).
The B net charge is positive , + 0.48 |e| , mostly compen-sated by the negatively charged C first neighbors (over-all − 0.45 |e| ). So it turns out that the H atom in CHN is
attracted by the concentrated electronic cloud of the N lone
pair (H is positively charged), whereas in CHB it is repelled by the positively charged B atom. In order to reduce this repulsion, it deflects from the C 1 B line. The N–H bond pop-ulation is very small and negative (− 0.003 |e| , slightly repul-sive), whereas the B–H one is strongly negative (− 0.190 |e|) The equilibrium geometries obtained with the S 216 supercells are very similar to the one shown in Fig. 1, the only exception being the BHC1 angle, which reduces from 146,02◦ to 130.77◦ . This is the reason why the vibrational modes of CHB are more sensitive than the CHN ones to the defect concentration.
The band structures of the CHN and CHB defects are compared to the one of pristine diamond in Fig. 2, where the most relevant energy differences are shown. The band gap of the latter, 5.75 eV at the B3LYP level, is in good agreement with the experimental value of 5.80 eV [53]. The main difference between the CHN-defective and the perfect diamond is the band that appears in the gap, above the high-est occupied band of perfect diamond, and due to the N lone pairs. The corresponding anti-bonding band is just below the lowest unoccupied diamond band. The calculated indirect band gap of CHN is 4.9 eV.
The CHB defect introduces an empty band just below the diamond conducting band, without any significant modifica-tion of the valence bands. The resulting direct band gap is 5.0 eV.
Let us consider now the formation energy E f of the
defect. In Eq. 8, a C atom leaves the diamond supercell and two atoms, i.e., one hydrogen and one nitrogen (or boron) atoms, enter in the supercell. According to this reaction, the CHB defect turns out to be more stable than CHN (see Table 1): formation energies obtained with hybrid function-als are around − 4.8 eV for CHB and − 1.8 eV for CHN. The Hartree–Fock values are higher (less negative) by 2.5 (CHB) and 4.2 (CHN) eV, whereas PBE and LDA are lower by up to 1.5 and 2.2 eV.
The hydrogenation process, described by Eq. 9, is exo-thermic for all functionals here adopted. The insertion of one hydrogen atom is easier in CHN, where hydrogenation
energies E H obtained with the hybrid functionals are
around − 1.3 eV, than in CHB, where E H for hybrids are
0.3–0.4 eV higher. The lower energy for CHN is due to the strong electrostatic attraction between the N lone pair and the positively charged H atom.
In order to have reasonable formation energies, the same basis set quality must be adopted in the defective solid and in the isolated atoms. For this reason, the latter have been inserted in a cluster formed by their first, second and third stars of neighbors in the bulk; these atoms have then been transformed in “ghosts.” (Electron and nuclei are eliminated, and only the basis functions are kept.) In this way, most of the basis set superposition error (BSSE) is corrected for. Some thermodynamic properties have been evaluated considering the phonons at the Γ point only [54, 55].
In Supplementary Material section, Δ G (Gibbs free energy) for Eq. 9 as a function of temperature is reported in the 100–10,000 K interval, and the stability of the two defects is evaluated and discussed.
(8) Diamond + H + Σ Ef ⇌CHΣ + C, (Σ = B, N) (9) CΣ + H EH ⇌CHΣ, (Σ = B, N)
Fig. 1 Schematic representation of the CHΣ defect in diamond, where Σ stands for boron (a) or nitrogen (b). B3LYP equilib-rium distances (large, in Å), net charges (large, bold, in |e|) and bond populations (italic, in |e|), as resulting from a Mulliken analysis, are shown. Data refer to S 64
3.2 Infrared and Raman spectra
Vibrational spectroscopy makes a significant contribution to the identification of the different defects present in diamond. While it is generally rather difficult from the experimental side to assign a given spectral feature unambiguously to a specific structural defect, since, potentially, there is a large number of factors such as defect type, concentration and aggregation, that might hinder or complicate this, the same is not true for a simulation, since the nature of a particular
defect, its concentration and local environment i.e., bulk, surface grain boundary and the presence of impurity, are defined precisely a priori.
The Raman spectrum of pristine diamond is simple: it consists of a single and sharp peak at the experimental value of 1332 cm−1 ; the calculated peak, with the present 6-21G basis set and B3LYP functional, is at 1317 cm−1 . The IR spectrum is even simpler: due to symmetry constraints it does not show any feature. For these reasons, all signals observed in the simulated IR spectrum are thus due to the
Table 1 Defect formation energy Ef (Eq. 8) and C–H homolytic
cleavage energy EH (Eq. 9) for the CHB (top data) and CHN
(bot-tom data) defects in diamond, as computed with different functionals. E(H), E(B), E(N) E(C) are the atomic energies evaluated by inserting
the atom in a fragment of the crystalline solid in which all the first, second and third neighbors have been transformed in ghost atoms, in order to compensate for the basis set superposition error. All values correspond to the S 64 supercells
Method E (H) E (B) E (C) E (CB) E (CHB) Ef EH (Eh) (Eh) (Eh) (Eh) (Eh) (eV) (eV) HF − 0.4982 − 24.5228 − 2421.7608 − 2409.0305 − 2409.0285 − 2.41 − 0.54 PBE0 − 0.4991 − 24.6084 − 2434.8068 − 2422.0530 − 2422.0530 − 4.97 − 0.98 B3LYP − 0.4969 − 24.6360 − 2435.5789 − 2422.8253 − 2422.8253 − 4.61 − 0.95 HSE06 − 0.4993 − 24.6078 − 2434.7622 − 2422.0072 − 2422.0072 − 4.93 − 0.72 PBE − 0.4974 − 24.5999 − 2434.4882 − 2421.7371 − 2421.7371 − 5.18 − 0.39 LDA − 0.4760 − 24.3426 − 2416.1460 − 2403.4476 − 2403.4476 − 6.40 − 0.81 Method E (H) E (N) E (C) E (CN) E (CHN) Ef EH (Eh) (Eh) (Eh) (Eh) (Eh) (eV) (eV) HF − 0.4982 − 54.3424 − 2421.7608 − 2438.6702 − 2438.6702 2.48 − 0.34 PBE0 − 0.4991 − 54.4774 − 2434.8068 − 2451.8046 − 2451.8046 − 1.77 − 1.34 B3LYP − 0.4969 − 54.5107 − 2435.5789 − 2452.5960 − 2452.5960 − 1.78 − 1.42 HSE06 − 0.4993 − 54.4768 − 2434.7622 − 2451.7601 − 2451.7601 − 1.77 − 1.32 PBE − 0.4974 − 54.4621 − 2434.4882 − 2451.5007 − 2451.5007 − 2.50 − 1.76 LDA − 0.4760 − 54.0624 − 2416.1460 − 2433.0773 − 2433.0773 − 3.95 − 2.07 Γ X L W Γ k Γ X L W Γ k Γ X L W Γ -4.0 -2.0 0.0 2.0 4.0 6.0 8.0 k Energy (eV) Pristine CHN CHB 5.76 5.61 4.88 5.79 4.99
Fig. 2 Band structure of pristine (left) and defective (CHN, central;
CHB, right) diamond obtained with the S 64 supercell and B3LYP
functional. The horizontal blue line indicates the Fermi level. The
red arrows represent the optical band gap of the hosting defective level (donor band in CHN and acceptor band in CHB). The turquoise arrows indicate the gap of the hosting diamond. Gaps in eV
presence of the defect of interest, similarly to those that dif-fer from the one-phonon mode at 1332 cm−1 in the Raman spectrum. Among the many signals that eventually appear, particularly interesting are those that are above the pristine diamond peak value; these are indeed related to vibrational normal modes that involve displacements of just a few set of atoms, typically those of the defect and their nearest neighbors.
3.2.1 Infrared spectrum
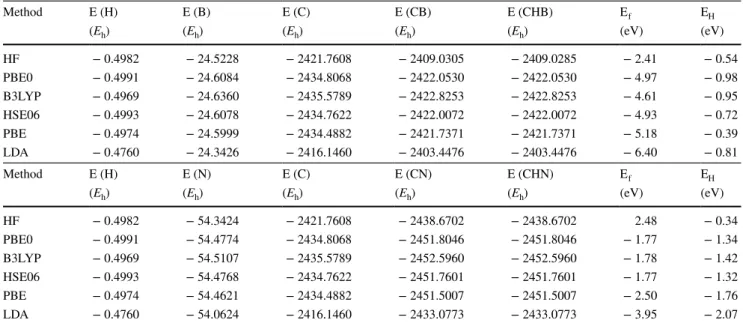
The IR harmonic vibrational spectra, as computed at two defect concentrations corresponding to the S 64 and S 216 supercells, are shown in Fig. 3. Let us comment first the spectra obtained with the largest supercell. In the CHN case, the three hydrogen peaks are well separated from the other peaks: the A 1 stretching at 3497 cm−1 and the doubly degen-erate bending E mode at 1590 cm−1.
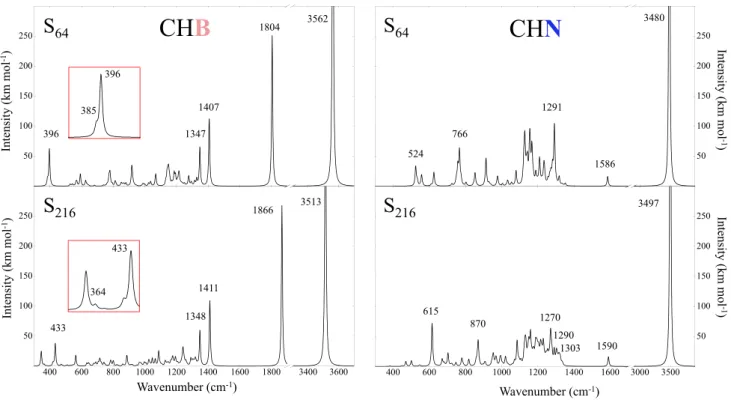
The CHB stretching mode is 3513 cm−1 . As a conse-quence of the P 1 symmetry, the two other H modes in CHB are no more degenerate: one appears at 1866 cm−1 in Fig. 3. What about the third hydrogen mode? Inspection of the graphical animation of the modes, available at the web site indicated at references [56] and [57], clearly shows that a mode involving H falls down to 364 cm−1 . This mode is a sort of nearly free translation of hydrogen, whereas the bending mode at 1866 cm−1 , (that is, 276 cm−1 higher than
the one of CHN), is strongly limited in his movement (see also Fig. 5). The isotopic substitution, shown in Fig. 4, in which the blue bars identify the H atom when substituted with its D isotope, confirms the attribution to H of the mode at 364 cm−1.
In the same figure, it is possible to identify the modes to which N and B give the most important contributions (gray and red bars, respectively). Also in this case, the dif-ference between CHB and CHN is large: N contributes to many modes, of which only the three most important are indicated in the figure. (The peak at 615 cm−1 is actually a superposition of a couple of E modes with a A 1 mode, dif-fering by less than 1 cm−1.)
The B modes in CHB are on the contrary easily identified at 1411, 1348 and 364 cm−1 (see animations). It is worth of note that the low wavenumber B mode is strongly correlated with the H bending, as the animation also confirms.
Let us consider now how the relevant peaks depend on the defect concentration: the C–H stretching of CHB shifts by 49 cm−1 (from 3562 to 3513 cm−1 ), the one of CHN by 17 cm−1 (from 3480 and 3497 cm−1 ); as regards the C–H bending, they shift by 62 and 30 cm−1 for CHB (from 1804 to 1866, and from 396 to 266 cm−1 ) and by only 4 cm−1 for CHN (1586 to 1590 cm−1 ) in going from S 64 and S 216 . So shifts are much larger for CHB than for CHN. The H posi-tion, that in CHN is strongly constrained by symmetry, is on the contrary in a general position for CHB. This general
Intensity (km mo l -1) Intensity (km mo l -1) Intensity (km mo l-1 ) Intensity (km mo l-1 ) Wavenumber (cm-1) Wavenumber (cm-1)
S
64S
64S
216S
216CH
N
CH
B
3562 1804 1407 1347 396 3480 1586 1291 766 1590 1270 870 615 1290 1303 3497 1866 1411 1348 433 3513 433 364 396 385 524Fig. 3 B3LYP simulated IR spectra of the CHN (left panels) and CHB (right panels) defects in diamond. The top panels refer to S 64 , the bottom
position turns out to strongly depend on the defect concen-tration, as discussed above. Note, however, that the two B
modes at 1411 and 1348 cm−1 , which are not correlated with the H movement, essentially do not depend on the defect concentration.
As it is well known, the CH stretching is in general strongly anharmonic, and essentially independent from the other normal modes. Table 2, in the first four columns,
reports the results of the numerical solution of the one-dimensional Schrodinger equation, as described in Sect. 2. In the same table, also the harmonic frequency 𝜔H obtained
by diagonalizing the Hessian matrix, and using the one point formula (see Eq. 2) is reported. Let us consider first CHN. The fundamental anharmonic wavenumber is 3408 cm−1 , about 64 cm−1 lower than the harmonic frequency ( 𝜔
e , at
3471 cm−1 , see Eqs. 4 and 5). This number is 8 cm−1 lower than 𝜔1
H , the frequency obtained by diagonalizing the full
hessian matrix with the two-points formula (see Eq. 7; 𝜔e ,
on the contrary, is obtained by computing 7 points on the one-dimensional PES). The relatively good agreement con-firms that in this case: (1) the movement is along the one-dimensional C–H coordinate; (2) that the PES is not very anharmonic.
The situation is quite different for CHB: here the differ-ence between 𝜔e and 𝜔1H , is larger than 100 cm−1 , showing
that in this case the hypotheses (1) and (2) are no more valid, and the simple estimate of the anharmonicity along the C–H bond is not very reliable.
Going back to the anharmonic CH stretching of CHN, Table 2 shows that it is 260 cm−1 higher than the one in VN3 H, and also higher than many of the ones characteriz-ing the families of VHx and VNxHy defects, investigated by
some of the present authors in previous papers [22, 24], as in these cases the opposite wall toward which is moving H
wavenumber (c m -1) wavenumber (c m -1)
CH
B
(S
64)
wavenumber (cm-1)CH
N
(S
216)
wavenumber (cm-1)CH
N
(S
64)
CH
B
(S
216)
Fig. 4 Effect of the isotopic substitutions 11 B → 10 B (red bars), 14N→ 15 N (gray bars) and H → D (blue bars) in the S
64 (top panels) and S 216
(bottom panels) supercells. The horizontal axis reports the
frequen-cies with the standard isotopes as in Fig. 3, the vertical axis the shift due to the isotopic substitution. The asterisks indicate doubly degen-erate E levels. The IR intensities of the modes are reported in brackets
C3v
P1 P1
Fig. 5 When frequencies of CHB are computed keeping the C 3v
sym-metry, a negative eigenvalue appears at − 374.35 cm−1 . The figure
shows the PES obtained following the corresponding eigenvector. The two P 1 minimum points are 0.0065 eV below the maximum.
are farther away, on the opposite side of the vacancy. This distance should make the region of the CHN stretching less crowded, and then the stretching itself more easy to identify (see conclusions).
3.2.2 Raman spectrum
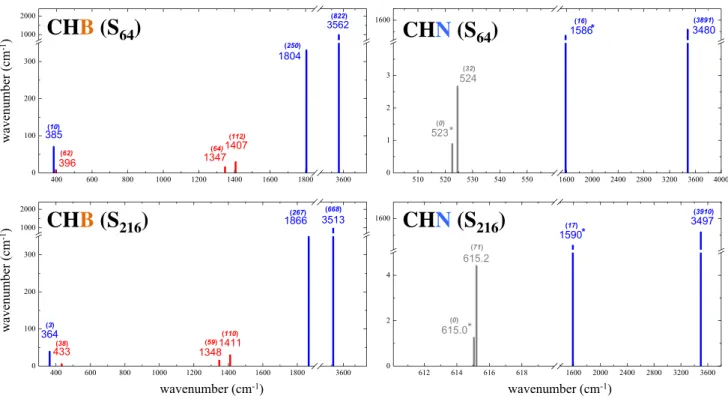
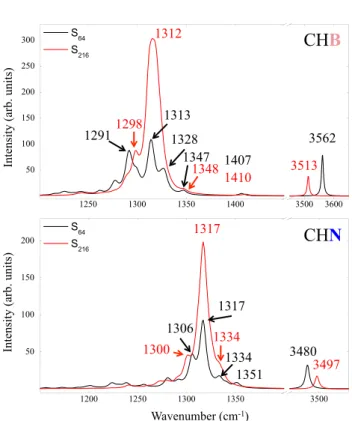
The Raman spectra of CHN and CHB, obtained at two defect concentrations, are shown in Fig. 6. The position of the peaks is obviously the same as in the IR spectrum. The relative intensity is on the contrary very different and can be used as an additional source of information and identifica-tion for these defects. Unfortunately, we have been unable
to find any experimental Raman spectrum in the literature so that we propose the present ones for future comparison. 3.3 Comparison with previous calculations
Our calculated fundamental harmonic stretching of CHN is 3471 cm−1 , which red shifts to 3408 cm−1 when anharmonic-ity is taken into account.
Goss et al. have estimated [9] it at around 3309 cm−1 . Our bending mode is around 1866 cm−1 , while they obtained 1404 cm−1.
The same authors have calculated the stretching and wag-ging frequencies of the CHB defect at 2664 and 1975 cm−1 , respectively, while our computed ones are at 3394 and 1410 cm−1.
Frequencies for the CHB [6] and the CHN [9] centers were obtained by Goss and collaborators by using their own AIMPRO code [58] with both cluster and supercell approaches, using LDA, a Gaussian-type basis set and pseudopotentials. The extremely large difference between the present and Goss results cannot be attributed only to the use of LDA, which is, however, well known to underestimate vibrational frequencies, especially in strongly H-bonded sys-tems [59].
4 Conclusion
The structural, electronic, energetic and vibrational features of the CHN and CHB point defects in diamond have been estimated through quantum-mechanical calculations. Both defects are closed shell in the ground state configuration. According to our calculations, in the CHN center hydro-gen points directly toward the lone pair of the substitutional nitrogen atom, leading to a C 3v symmetry. In CHB, on the contrary, H falls off from the axis between boron and carbon, leading to a P1 symmetry of the defect, as a consequence of the strong repulsion between B and H, both positively charged.
IR and Raman spectra of both defects have been simu-lated, with a particular attention to the C–H stretching and bending modes that might be used as fingerprints of these
Table 2 C–H bond length (RCH , in Å), fundamental anharmonic and
first overtone ( 𝜔e1 and 𝜔e2 ), anharmonic constant ( 𝜔e𝜒e ) and the
fun-damental harmonic frequency ( 𝜔e ) for CHB and CHN obtained by
using the S 64 supercells and the B3LYP functional. The 𝜔 1
H values
are the harmonic frequencies obtained by diagonalizing the full
Hes-sian matrix, built by using the two points formula (see Eqs. 1 and 2, respectively). For comparison, the CH stretching of the VN3 H defect
(see Ref. [7], in which the same basis set and functional have been used) is reported. Wavenumbers in cm−1
RCH 𝜔e1 𝜔e2 𝜔e𝜒e 𝜔e 𝜔1H
CHB (here) 1.066 3394 6729 30 3455 3562
CHN (here) 1.038 3408 6751 32 3471 3480
CHN (VN3H) 1.074 3132 6127 69 3271 3250
Intensity (arb. units)
Intensity (arb. units)
Wavenumber (cm-1) 3562 3513 1312 1298 1410 1348 1407 1347 1328 1313 1291 3480 1317 1334 1351 1306 3497 1334 1317 1300
CH
B
CH
N
Fig. 6 The Raman spectra of CHB (top) and CHN (bottom) obtained with S 64 (black lines) and S 216 (red lines). Both intensities are
fit-ted with a Lorentzian function with a full width at half maximum of 8 cm−1
defects. Frequency shifts upon isotopic substitutions have been calculated, as well as graphical animation of the normal modes [56, 57].
The C–H stretching frequency of CHN red shifts by 63 cm−1 to 3408 cm−1 , when anharmonicity is taken into account through a one-mode correction.
The experimental peak [3] at 3394 cm−1 , peculiar of Ib diamonds (in which nitrogen is mainly single substitutional), is very close to our C–H stretching mode of the CHN center, the difference being only 14 cm−1 . So one possible attribu-tion of this experimental peak is the CHN defect.
For the CHB center, the situation is not as clear as for the CHN defect, since no experimental data match our cal-culated frequencies. In a previous experimental work [3], it has been reported that IIb diamonds (rich in boron) do not show any significant IR peak in the region of interest. Note, however, from Fig. 3 that the CH stretching in CHB is very intense, and should be clearly visible in experiments.
Acknowledgements RD and FSG acknowledge the cineca award
(HP10CTG8YY) under the iscra initiative, for the availability of
high-performance computing resources and support.
References
1. Jackman RB (2003) Special issue: diamond electronics-preface. Semicond Sci Technol 18(3):1–2
2. Nemanich RJ, Carlisle JA, Hirata A, Haenen K (2014) CVD diamond—research, applications, and challenges. MRS Bull 39(06):490–494
3. Woods GS, Collins AT (1983) Infrared absorption spectra of hydrogen complexes in type I diamonds. J Phys Chem Solids 44(5):471–475
4. Hainschwang T, Notari F, Fritsch E, Massi L (2006) Natural, untreated diamonds showing the A, B and C infrared absorptions (“ABC Diamonds”), and the H 2 absorption. Diam Relat Mater
15(10):1555–1564
5. Kaiser W, Bond WL (1959) Nitrogen, a major impurity in com-mon type I diacom-mond. Phys Rev 115(4):857
6. Goss JP, Jones R, Heggie MI, Ewels CP, Briddon PR, Öberg S (2002) Theory of hydrogen in diamond. Phys Rev B 65(11):115207
7. Gentile F, Salustro S, Causá M, Erba A, Carbonniére P, Dovesi R (2017) The VN3H defect in diamond. A quantum mechanical
investigation of the structural, electronic and vibrational proper-ties. Phys Chem Chem Phys 1(4):1–2
8. Goss JP, Briddon PR, Hill V, Jones R, Rayson MJ (2014) Iden-tification of the structure of the 3107 cm−1 H-related defect in
diamond. J Phys Condens Matter 26:145801
9. Goss Jonathan P, Briddon Patrick R (2011) Calculated strain response of vibrational modes for H-containing point defects in diamond. Phys Chem Chem Phys 13(24):11488–11494
10. Dovesi R, Erba A, Orlando R, Zicovich‐Wilson CM, Civalleri B, Maschio L, Rérat M, Casassa S, Baima J, Salustro S, Kirtman B (2018) Quantum‐mechanical condensed matter simulations with CRYSTAL. WIREs Comput Mol Sci 8. https ://doi.org/10.1002/ wcms.1360
11. Maschio L, Kirtman B, Orlando R, Rérat M (2012) Ab initio analytical infrared intensities for periodic systems through a
coupled perturbed Hartree–Fock/Kohn–Sham method. J Chem Phys 137(20):204113
12. Maschio L, Kirtman B, Rérat M, Orlando R, Dovesi R (2013) Ab Initio analytical Raman intensities for periodic systems through a coupled perturbed Hartree–Fock/Kohn–Sham method in an atomic orbital basis. II. Validation and comparison with experi-ments. J Chem Phys 139(16):164102
13. Carteret C, De La Pierre M, Dossot M, Pascale F, Erba A, Dovesi R (2013) The vibrational spectrum of CaCO3 aragonite:
a combined experimental and quantum-mechanical investiga-tion. J Chem Phys 138(1):014201
14. Maschio L, Kirtman B, Salustro S, Zicovich-Wilson CM, Orlando R, Dovesi R (2013) Raman spectrum of pyrope garnet. A quantum mechanical simulation of frequencies, intensities, and isotope shifts. J Phys Chem A 117(45):11464–11471 15. Prencipe M, Maschio L, Kirtman B, Salustro S, Erba A, Dovesi
R (2014) Raman spectrum of NaAlSi2O6 jadeite. A quantum
mechanical simulation. J Raman Spectrosc 45:703–709 16. Baima J, Zelferino A, Olivero P, Erba A, Dovesi R (2016)
Raman spectroscopic features of the neutral vacancy in diamond from Ab initio quantum-mechanical calculations. Phys Chem Chem Phys 18(3):1961–1968
17. Zelferino A, Salustro S, Baima J, Lacivita V, Orlando R, Dovesi R (2016) The electronic states of the neutral vacancy in diamond: a quantum mechanical approach. Theor Chem Acc 135(3):1–11
18. Salustro S, Erba A, Zicovich-Wilson CM, Nöel Y, Maschio L, Dovesi R (2016) Infrared and Raman spectroscopic features of the self-interstitial defect in diamond from exact-exchange hybrid DFT calculations. Phys Chem Chem Phys 120:21288–21295 19. Salustro S, Ferrari AM, Gentile FS, Desmarais JK, Rérat M,
Dovesi R (2018) Characterization of the B-center defect in dia-mond through the vibrational spectrum: a quantum mechanical approach. J Phys Chem A 122(2):594–600
20. Salustro S, Ferrari AM, Orlando R, Dovesi R (2017) Comparison between cluster and supercell approaches: the case of defects in diamond. Theor Chem Acc 136:42
21. Salustro S, Gentile FS, D’Arco P, Civalleri B, Rérat M, Dovesi R (2018) Hydrogen atoms in the diamond vacancy defect. A quan-tum mechanical vibrational analysis. Carbon 129:349–356 22. Salustro S, Gentile F, Erba A, Carbonniére P, El-Kelany K, Dovesi
R (2018) The characterization of the VNxHy defects in diamond
through the infrared vibrational spectrum. A quantum mechanical investigation. Carbon 132:210–219
23. Ferrari A M, Salustro S, Gentile F, Mackrodt W, Dovesi R (2018) Substitutional nitrogen atom in diamond. A quantum mechani-cal investigation of the electronic and spectroscopic properties. Carbon 134:354–365
24. Gentile F, Salustro S, Desmarais J, Ferrari A M, D’Arco P, Dovesi R (2018) Vibrational spectroscopy of hydrogens in dia-mond: a quantum mechanical treatment. Phys Chem Chem Phys 20(17):11930–11940
25. Becke A D (1993) Density-functional thermochemistry. III. The role of exact exchange. J Chem Phys 98(7):5648–5652
26. Lee C, Yang W, Parr R (1988) Development of the Colle–Salvetti correlation-energy formula into a functional of the electron den-sity. Phys Rev B 37(2):785–789
27. Dovesi R, Orlando R, Erba A, Zicovich-Wilson C M, Civalleri B, Casassa S, Maschio L, Ferrabone M, De La Pierre M, D’Arco P, Noël Y, Causà M, Rérat M, Kirtman B (2014) CRYSTAL14: a program for the Ab Initio investigation of crystalline solids. Int J Quantum Chem 114:1287
28. Hehre WJ, Ditchfield R, Pople JA (1972) Self-consistent molecu-lar orbital methods. XII. Further extensions of gaussian type basis sets for use in molecular orbital studies of organic molecules. J Chem Phys 56(5):2257–2261
29. Francl MM, Petro WJ, Hehre WJ, Binkley JS, Gordon MS, DeFrees DJ, Pople JA (1982) Self-consistent molecular orbital methods. XXIII. A polarization-type basis set for second-row ele-ments. J Chem Phys 77(7):3654–3665
30. Dirac P (1930) A theory of electrons and protons. Proc R Soc A 126(801):360–365
31. Perdew JP, Burke K, Ernzerhof M (1996) Generalized gradient approximation made simple. Phys Rev Lett 77(18):3865–3868 32. Adamo C, Barone V (1998) Toward chemical accuracy in the
computation of NMR shieldings: the PBE0 model. Chem Phys Lett 298(1):113–119
33. Krukau AV, Vydrov OA, Izmaylov AF, Scuseria GE (2006) Influence of the exchange screening parameter on the per-formance of screened hybrid functionals. J Chem Phys 125(22):224106–224106
34. Dovesi R, Saunders VR, Roetti C, Orlando R, Zicovich-Wilson CM, Pascale F, Civalleri B, Doll K, Harrison NM, Bush IJ, D’Arco P, Llunel M, Causà M, Noël Y, Maschio L, Erba A, Rérat M, Casassa S (2018) CRYSTAL17 user’s manual. http://www. cryst al.unito .it/Manua ls/cryst al17.pdf
35. Pascale F, Zicovich-Wilson CM, Lòpez Gejo F, Civalleri B, Orlando R, Dovesi R (2004) The calculation of the vibrational frequencies of the crystalline compounds and its implementation in the CRYSTAL code. J Comput Chem 25(6):888–897 36. Zicovich-Wilson CM, Pascale F, Roetti C, Saunders VR, Orlando
R, Dovesi R (2004) Calculation of the vibration frequencies of 𝛼 -quartz: the effect of hamiltonian and basis set. J Comput Chem 25(15):1873–1881
37. Erba A, Ferrabone M, Orlando R, Dovesi R (2013) Accurate dynamical structure factors from Ab initio lattice dynamics: the case of crystalline silicon. J Comput Chem 34:346–354 38. Baima J, Ferrabone M, Orlando R, Erba A, Dovesi R (2016)
Thermodynamics and phonon dispersion of pyrope and grossular silicate garnets from Ab Initio simulations. Phys Chem Miner 43:137–149
39. Pascale F, Zicovich-Wilson CM, Orlando R, Roetti C, Ugliengo P, Dovesi R (2005) Vibration frequencies of Mg3Al2Si3O12 pyrope.
An Ab Initio study with the CRYSTAL code. J Phys Chem B 109(13):6146–6152
40. Orlando R, Torres FJ, Pascale F, Ugliengo P, Zicovich-Wilson CM, Dovesi R (2006) Vibrational spectrum of katoite Ca3Al2
[(OH)4]3 : a periodic Ab initio study. J Phys Chem B 110:692–701
41. Pascale F, Tosoni S, Zicovich-Wilson CM, Ugliengo P, Orlando R, Dovesi R (2004) Vibrational spectrum of brucite Mg(OH)2 : a
periodic Ab initio quantum mechanical calculation including OH anharmonicity. Chem Phys Lett 396:308–315
42. Demichelis R, Noël Y, Civalleri B, Roetti C, Ferrero M, Dovesi R (2007) The vibrational spectrum of 𝛼-AlOOH diaspore: an Ab ini-tio study with the crystal code. J Phys Chem B 111(31):9337–9346 43. Barrow GM (1962) Introduction to molecular spectroscopy.
McGraw-Hill, New York
44. Hess BA, Schaad LJ, Carsky P, Zahradnik R (1986) Ab initio cal-culations of vibrational spectra and their use in the identification of unusual molecules. Chem Rev 86:709–730
45. Maschio L, Kirtman B, Rérat M, Orlando R, Dovesi R (2013) Comment on Ab Initio analytical infrared intensities for peri-odic systems through a coupled perturbed Hartree–Fock/Kohn– Sham method [J Chem Phys 137, 204113 (2012)]. J Chem Phys 139:167101
46. Maschio L, Kirtman B, Rérat M, Orlando R, Dovesi R (2013) Ab initio analytical raman intensities for periodic systems through a coupled perturbed Hartree–Fock/Kohn–Sham method in an atomic orbital basis. I. Theory. J Chem Phys 139:164101 47. Maschio L, Kirtman B, Rérat M, Orlando R, Dovesi R (2013)
Ab initio analytical Raman intensities for periodic systems through a coupled perturbed Hartree–Fock/Kohn–Sham method in an atomic orbital basis. II. Validation and comparison with experiments. J Chem Phys 139:164102
48. Ferrero M, Rérat M, Orlando R, Dovesi R (2008) The calculation of static polarizabilities of periodic compounds. The implementa-tion in the CRYSTAL code for 1D, 2D and 3D systems. J Comput Chem 29:1450–1459
49. Ferrero M, Rérat M, Orlando R, Dovesi R (2008) Coupled per-turbed Hartree–Fock for periodic systems: the role of symmetry and related computational aspects. J Chem Phys 128:014110 50. McQuarrie DA, Simon JD (1977) Physical chemistry: a molecular
approach. University Science Books, Sausalito
51. Duncan JL, McKean DC, Tortoand I, Brown A, Ferguson A M (1988) Infrared studies of CH and CD stretching anharmonicity. J Chem Soc Faraday Trans 2 84(9):1423–1442
52. Myrick ML, Greer AE, Nieuwland AA, Priore RJ, Scaffidi J, Andreatta D, Colavita P (2008) Birge–Sponer estimation of the C–H bond dissociation energy in chloroform using infrared, near-infrared, and visible absorption spectroscopy. An experiment in physical chemistry. J Chem Educ 85(9):1276
53. Cardona M, Thewalt MLW (2005) Isotope effects on the optical spectra of semiconductors. Rev Mod Phys 77(4):1173
54. Bjørheim TS, Arrigoni M, Gryaznov D, Kotomin E, Maier Joachim (2015) Thermodynamic properties of neutral and charged oxygen vacancies in BaZrO3 based on first principles phonon
cal-culations. Phys Chem Chem Phys 17(32):20765–20774 55. Bjørheim TS, Arrigoni M, Saeed SW, Kotomin E, Maier Joachim
(2016) Surface segregation entropy of protons and oxygen vacan-cies in BaZrO3. Chem Mater 28(5):1363–1368
56. Animations of the vibrational modes of the CHN defect in dia-mond can be found at the following link. http://www.pmmp. jussi eu.fr/yves/vario usdef ects/anima tions /?name=04_NHC. xyz&spt=04_NHC.spt
57. Animations of the vibrational modes of the CHB defect in dia-mond can be found at the following link. http://www.pmmp. jussi eu.fr/yves/vario usdef ects/anima tions /?name=05_BHC. xyz&spt=05_BHC.spt
58. Briddon PR, Jones R (2000) LDA calculations using a basis of Gaussian orbitals. Phys Status Solidi B 217(1):131–171 59. Ugliengo P, Pascale F, Merawa M, Labéguerie P, Tosoni S, Dovesi
R (2004) Infrared spectra of hydrogen-bonded ionic crystals: Ab initio study of Mg(OH)2 and 𝛽-Be(OH)2 . J Phys Chem B
Hydrogen, Boron and Nitrogen Atoms in Diamond. A Quantum Mechanical Vibrational Analysis
Supplemental Material
Francesco Silvio Gentile,1Simone Salustro,1Giulio Di Palma,1Mauro Caus`a,2Philippe D’Arco,3and Roberto Dovesi1 1Dipartimento di Chimica, Universit`a di Torino and NIS (Nanostructured Interfaces and Surfaces) Centre, Via P. Giuria 5, 10125 Torino, Italy
2Dipartimento di Ingengeria Chimica, dei Materiali e delle Produzioni Industriali DICMAPI, Universit`a degli Studi di Napoli Federico II, Piazzale Vincenzo Tecchio 80, 80125, Napoli, Italy 3Institut des Sciences de la Terre de Paris (UMR 7193 UPMC-CNRS), UPMC, Sorbonne Universit´e, Paris, France
I. ∆G OF HYDROGENATION REACTIONS IN CΣ DIAMOND DEFECTS
2 0 0 0
4 0 0 0
6 0 0 0
8 0 0 0
1 0 0 0 0
- 1 2
- 1 0
- 8
- 6
- 4
- 2
0
∆
G
(
e
V
)
T e m p e r a t u r e ( K )
C H
N
C H
B
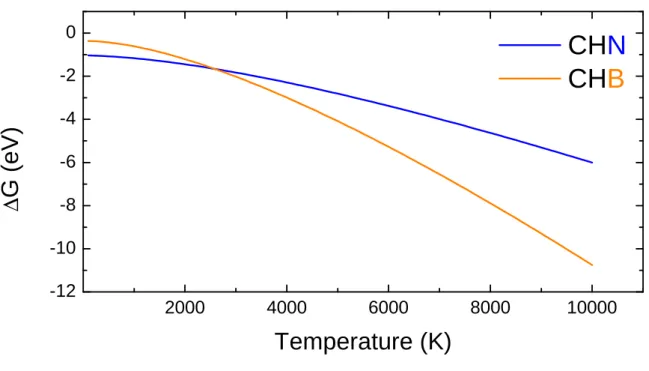
Figure S1: The hydrogenation free energy ∆G of CB and CN defects in diamond. The explored temperature range is 100 - 10000 K. Data refer to S64supercell.
The hydrogenation free energy ∆G (see equation 9 in the manuscript, where CΣ defects react with H radical), are derived from Γ-point only phonon calculations. ∆G is evaluated in the wide interval from 100 to 10000 K. All energies are in eV for a comparison with the hydrogenation energies ∆E reported in Table I of the manuscript. ∆G are calculated according to Equation S1, where Eel is the electronic energy, E0 is the zero point energy, ET is the translational contribute and PV and TS are the enthalpic and entropic contributions. In the isolated H atom E0, ET and -TS are null, and the PV term (for one mole of ideal atom gas) is equal to RT.
G= Eel+ E0+ ET+ PV − T S, (S1)
∆G is negative in all cases, confirming the spontaneous character of the reactions. At low temperature the CHN curve is lower than the CHB one. At about 2600 K the two curves cross. Thereafter the CHB curve is lower than CHN, due to a larger slope of the curve, indicating an higher stability of the hydrogenation reaction in extreme conditions, tipically at the high temperatures
2 observed in the mantle, where these defects might form.