HAL Id: hal-00297515
https://hal.archives-ouvertes.fr/hal-00297515
Submitted on 15 Jun 2005
HAL is a multi-disciplinary open access
archive for the deposit and dissemination of
sci-entific research documents, whether they are
pub-lished or not. The documents may come from
teaching and research institutions in France or
abroad, or from public or private research centers.
L’archive ouverte pluridisciplinaire HAL, est
destinée au dépôt et à la diffusion de documents
scientifiques de niveau recherche, publiés ou non,
émanant des établissements d’enseignement et de
recherche français ou étrangers, des laboratoires
publics ou privés.
Global uptake of carbonyl sulfide (COS) by terrestrial
vegetation: Estimates corrected by deposition velocities
normalized to the uptake of carbon dioxide (CO2)
L. Sandoval-Soto, M. Stanimirov, M. von Hobe, Vivien Schmitt, J. Valdes, A.
Wild, J. Kesselmeier
To cite this version:
L. Sandoval-Soto, M. Stanimirov, M. von Hobe, Vivien Schmitt, J. Valdes, et al.. Global uptake of
carbonyl sulfide (COS) by terrestrial vegetation: Estimates corrected by deposition velocities
normal-ized to the uptake of carbon dioxide (CO2). Biogeosciences, European Geosciences Union, 2005, 2
(2), pp.125-132. �hal-00297515�
www.biogeosciences.net/bg/2/125/ SRef-ID: 1726-4189/bg/2005-2-125 European Geosciences Union
Biogeosciences
Global uptake of carbonyl sulfide (COS) by terrestrial vegetation:
Estimates corrected by deposition velocities normalized to the
uptake of carbon dioxide (CO
2
)
L. Sandoval-Soto1, M. Stanimirov2, M. von Hobe3, V. Schmitt4, J. Valdes5, A. Wild4, and J. Kesselmeier1 1Max Planck Institute for Chemistry, Biogeochemistry Dept., Joh.-J.-Becher-Weg 27, 55128 Mainz, Germany 2University of Applied Sciences Solothurn, Institute for Automation, 4600 Olten, Switzerland
3Research Centre J¨ulich, Institute of Chemistry and Dynamics of the Geosphere (IGG-I), 52425 J¨ulich, Germany 4Institute for General Botany, University of Mainz, M¨ullerweg 6, 55128 Mainz, Germany
5National University, Atmospheric Chemistry Laboratory, 86-3000, Heredia, Costa Rica
Received: 14 January 2005 – Published in Biogeosciences Discussions: 31 January 2005 Revised: 12 May 2005 – Accepted: 29 May 2005 – Published: 15 June 2005
Abstract. COS uptake by trees, as observed under dark/light
changes and under application of the plant hormone abscisic acid, exhibited a strong correlation with the CO2assimilation
rate and the stomatal conductance. As the uptake of COS oc-curred exclusively through the stomata we compared experi-mentally derived and re-evaluated deposition velocities (Vd;
related to stomatal conductance) for COS and CO2. We show
that Vd of COS is generally significantly larger than that of
CO2. We therefore introduced this attribute into a new global
estimate of COS fluxes into vegetation. The new global es-timate of the COS uptake based on available net primary productivity data (NPP) ranges between 0.69–1.40 Tg a−1. However, as a COS molecule is irreversibly split in contrast to CO2which is released again by respiration processes, we
took into account the Gross Primary Productivity (GPP) rep-resenting the true CO2 leaf flux the COS uptake has to be
related to. Such a GPP based deposition estimate ranged be-tween 1.4-2.8 Tg a−1(0.73–1.50 Tg S a−1). We believe that in order to obtain accurate global COS sink estimates such a GPP-based estimate corrected by the different deposition velocities of COS and CO2must be taken into account.
1 Introduction
Carbonyl sulfide (COS) is a substantial source for strato-spheric sulfate aerosol and plays an important role in stratospheric ozone chemistry (Crutzen, 1976; Andreae and Crutzen, 1997). According to Watts (2000) and Kettle et al. (2002) total global sources and sinks are balanced within
Correspondence to: J. Kesselmeier
the uncertainties of the estimates. Deposition to vegetation and soils represents the main sink for this trace gas (Lo-gan et al., 1979; Brown and Bell, 1986; Chin and Davis, 1993, 1995; Geng and Mu, 2004). Soils have been recog-nized as a global sink for COS only recently and the uncer-tainty is rather large as parameterization of the uptake has been performed with only one soil type to date (Kesselmeier et al., 1999), which clearly warrants further studies. The role of vegetation as a major global tropospheric sink for COS has been studied for 20 years and is undisputed, but the uncertainty in the quantitative estimates of this sink is still large. Two common methods for the estimate of the global COS sink strength were reported. The estimate by Brown and Bell (1986) is based on the deposition velocity of COS and its atmospheric concentration. Another approach is described by Chin and Davis (1993) who used the cor-relation between the COS deposition and the CO2
assimi-lation, assuming the same deposition velocities for CO2and
COS. Recent estimates refer to this method (Kesselmeier and Merk, 1993; Andreae and Crutzen, 1997; Watts, 2000; Ket-tle et al., 2002). However, a simple 1:1 relation for the up-take ratio of COS/CO2appears insufficient as a preferential
uptake of COS on a leaf as well enzymatic basis has been reported (Kesselmeier and Merk, 1993; Protoschill-Krebs et al., 1996). Therefore, we studied the stomatal uptake of COS separately. Moreover we investigated the close correlation between the rate of photosynthesis and the COS uptake for several European tree species and considered the differences in deposition velocities for CO2and COS. The observed
ra-tios of the deposition velocities were used to improve global estimates of the COS vegetation sink based on Net Primary Production.
126 L. Sandoval-Soto et al.: Global terrestrial COS sink strength
2 Materials and methods
2.1 Plant material and growth
For all experiments young trees (3–4 years old) from Ger-man and English tree nurseries were used. Tree species in-vestigated were Holm oak (Quercus ilex L.), European beech (Fagus sylvatica L.), Norwegian spruce (Picea abies) and Scots pine (Pinus sylvestris). The trees were kept in 20 l pots with gardener’s compost for the years 1997–2000 and fertil-ized with commercially available fertilizer (Baumfit, Spiess-Urania, Germany). For the Mediterranean tree species
Quer-cus ilex sand was mixed with the soil in a 1 to 2 ratio. The
trees were grown in a greenhouse at 25◦C under a 12/12 h light-dark regime with a light intensity of 600 µmol m−2s−1 of photons (PAR) and a relative humidity of 70% under 350 ppm CO2.
2.2 Purification of ambient air
Compressed air was purified by passing it (6 l min−1) through a multistage gas purification system consisting of (1) silica gel (Merck, Germany), (2) molecular sieve (0.5 nm, Merck, Darmstadt), (3) charcoal (Merck,Germany), and soda lime (Merck, Germany), 3 l each. COS and CO2 mixing
ratios were adjusted to desired values by mixing the pu-rified compressed air with known gas mixtures produced from a permeation device (Haunold, Germany) with COS permeation tubes (VICI Metronics, Santa Clara, California) and CO2from a pressurized bottle (Messer-Griesheim,
Ger-many). All flows were regulated by mass flow controllers (MKS, Massachusetts, USA).
2.3 Enclosure system (cuvettes) and exchange measure-ments
Gas exchange of enclosed tree branches was investigated using a dynamic (flow-through) Teflon-film-cuvette system consisting of a plant measuring and an empty reference cu-vette with all inner surfaces made of Teflon to avoid inter-ference with the investigated trace gases. All experiments were performed in a climate chamber with identical condi-tions as compared to the growth chamber. Trace gas sam-pling was accompanied by measurements of ambient CO2,
CO2 exchange and transpiration by an infra-red gas
ana-lyzer. For details see Kuhn et al. (1999, 2000) and Kuhn and Kesselmeier (2000). Leaf area was determined by copy-ing leaf contours onto paper in order not to destroy the leaves. The area was measured by a calibrated scanner system (Scan-JET IICX with DeskSCAN II; both Hewlett-Packard, USA), and SIZE 1.10 (M¨uller, Germany). The enclosures were con-stantly flushed with 1 l min−1 of purified and conditioned ambient air (see above) which was artificially moistened (r.H. >70%) before entering the cuvettes. COS was quantified in the ppt range by an automated analytical system according to Von Hobe et al. (2000) by consecutive sampling at both
cuvettes. The gas exchange rates (F ) were calculated from the measured concentration difference (δc=csample-cref), the
chamber flush rate (Q) and the enclosed leaf area (A). F = δc ∗ (Q/A) .
Deposition velocities (Vd) related to stomatal conductance
were calculated in relation to the ambient air concentration of the reference cuvette (cref).
Vd=F /cref .
Accuracy and precision of the analytical system were bet-ter than 2% plus any uncertainties introduced by the cuvette sampling, mainly by the accuracy of mass flow controllers. The stomatal conductance for water vapor was determined according to Pearcy et al. (1989).
2.4 Induction of stomatal closure
Stomatal closure was induced by infiltration of abscisic acid (ABA) to an oak branch cut from the tree two days before this application. The ABA treatment was performed by cutting a small branch of Quercus ilex under water (to prevent air from penetrating into the water-conducting elements) and dipping it into a nutrient solution of 1.0 mM KCl, 0.1 mM NaCl , 0.1 mM CaCl2. Measurements of CO2exchange and water
vapor transpiration proved the unrestricted viability of this sample branch. ABA was applied by exchanging the nutri-ent solution against a fresh one containing additional 0.1 mM ABA, which was transported into the leaves by the transpira-tion stream. For details see Gabriel et al. (1999).
3 Results
3.1 Stomatal uptake
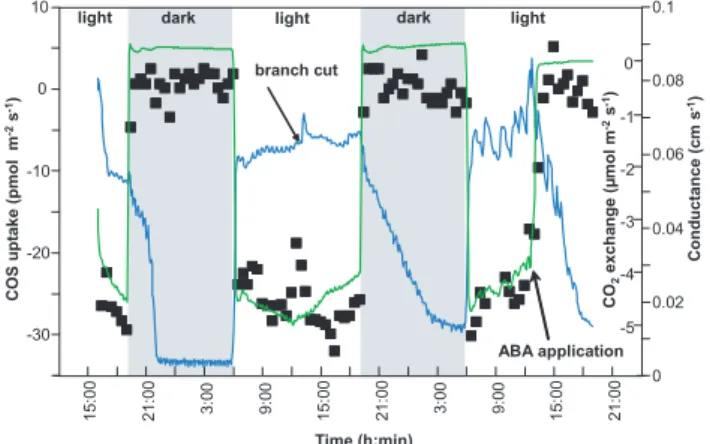
The automated analytical COS analyzer allowed a dense pro-tocol to follow the exchange behavior with high time resolu-tion. Figure 1 shows the COS uptake by an enclosed branch of Fagus sylvatica (European beech) in relation to assimila-tion and stomatal conductance over nearly three days of mea-surements. The COS-uptake closely followed the light/dark cycle. This behavior can be related to the calculated stomatal aperture and consequently directly compared to the exchange of CO2, i.e. net photosynthetic assimilation rate. Low uptake
rates were found under dark conditions. As the stomata did not completely close in the dark and a respiration activity was detectable, the low COS exchange may be understood as a physiological consumption at a lower rate. On the other hand we do not exclude fluctuations and scatter caused by the non-simultaneous COS sampling at the sample and reference cuvette due to switching of the automated system from one cuvette to the other. Nevertheless, a clear relation to light and stomatal aperture is obvious, though the enzymatic pathway of COS consumption by carbonic anhydrase itself is gener-ally light independent (Protoschill-Krebs et al., 1996).
-10 -8 -6 -4 -2 0 2 12: 00 18: 00 0: 00 6: 00 12: 00 18: 00 0: 00 6: 00 12: 0 0 18: 00 0: 00 6: 00 12: 0 0 18: 00 0 0.02 0.04 0.06 0.08 0.1 COS u p take (p mo l m -2 s -1) C o nd uct a nce (cm s -1) CO 2 excha n ge (µ m o l m -2 s -1) -3 -2 -1 0
dark light dark light
light dark light
Time (h:min)
Fig. 1. Exchange (negative=uptake) of carbonyl sulfide (COS, filled
squares) in relation to branch (leaf) conductance (blue line) as a measure of stomatal pore width and CO2 exchange (green line)
with negative values for uptake (assimilation) and positive values for emission (respiration) for European beech (Fagus sylvatica L.).
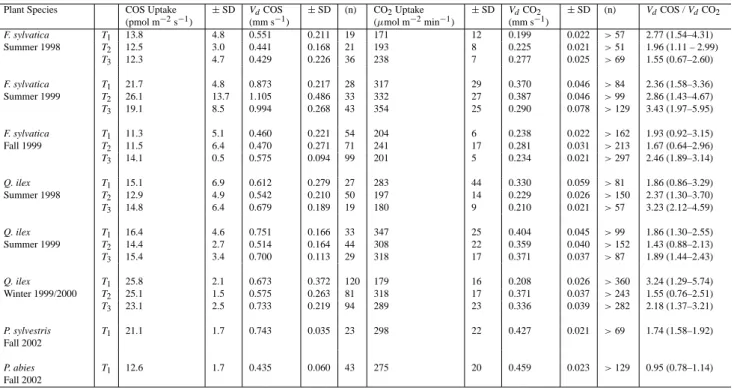
The close relation between light and COS uptake in con-trast to the light independent consumption by the enzyme carbonic anhydrase supports the assumption of an exclu-sively stomatal uptake pathway, as light represents a consid-erable trigger of stomatal movement. The final proof for a stomatal related exchange was demonstrated by the applica-tion of abscisic acid (ABA), a plant hormone which causes stomatal closure. Treatment with ABA was performed by cutting a small branch of Quercus ilex and incubating the stem into a vial filled with a buffer solution. Under these conditions, the branch was performing a normal behavior of gas exchange and COS uptake (Fig. 2) as followed for two light/dark episodes. In the course of the third light phase we infiltrated ABA and observed a fast decline of CO2exchange
down to zero (no respiration measurable) closely accompa-nied by the decrease of COS uptake (Fig. 2). Stomatal con-ductance also showed a decrease to night values under the influence of ABA under light conditions, though with some delay which may be understood as inhomogeneous stomatal apertures or slight water condensation on the cuvette walls interfering with the water vapor measurements. However, the prompt decline of assimilation to a zero-exchange of CO2
under light is a most convincing argument for the strict regu-lation of this trace gas exchange by stomatal aperture. 3.2 Deposition velocities of COS and CO2
As described above, an exclusive uptake of COS via the stomatal pathway in close relation to the CO2exchange could
be demonstrated. The simultaneous measurements of the CO2-exchange during all enclosure studies has the potential
for a better quantification of the COS uptake. We could di-rectly link the uptake rates of COS and CO2by comparing
the deposition to the leaves after normalization by the
am--30 -20 -10 0 10 15: 00 21: 0 0 21: 00 3: 00 9: 00 15: 0 0 21: 0 0 3: 00 9: 00 15: 0 0 0 0.02 0.04 0.06 0.08 0.1 -5 -4 -3 -2 -1 0 CO 2 excha nge (µ m o l m -2 s -1) branch cut ABA application dark light dark light light COS u p take (pmol m -2 s -1) C ond uct a nce (cm s -1) Time (h:min)
Fig. 2. Exchange (negative=uptake) of carbonyl sulfide (COS, filled
squares) in relation to branch conductance (blue line) as a measure of stomatal pore width and CO2 exchange (green line) for Holm
oak (Quercus ilex L.) with negative values for uptake (assimilation) and positive values for emission (respiration). Note: Conductance calculated from climate chamber conditions (25◦C; 70 % r.H.).
bient atmospheric concentration of each trace gas, i.e. by comparing deposition velocities (Vd). The obtained COS
and CO2 deposition velocities for F. sylvatica, Q. ilex, P.
sylvestris and P. abies are summarized in Table 1. A clear
preference for COS deposition is indicated by the uptake ra-tios of Vd COS versus Vd CO2 and was found for all tree
species investigated. The results reflect a significantly pro-nounced uptake of COS over CO2 by a factor between 1.4
and 3.4.
In order to widen our basis for further calculations, de-position velocities as reported in or calculated from pub-lished data sets were additionally taken into account. In some cases we were able to re-estimate data on the basis of the published figures and tables. For our own data sets published recently, we calculated on the basis of the original data. The results are shown in Table 2. The Vd-ratios are
sensitive to the rate of CO2 uptake taken into account. In
case of enclosure measurements we used the net exchange as measured with the enclosed branch or leaf (Net Primary Productivity; NPPcuvette)in order to compare with other
pub-lished data. However, in case of one data set (spruce for-est, Xu et al. 2002) from flux studies above the forfor-est, a correction might be necessary, as this flux value is repre-senting the net exchange as a result of gross photosynthe-sis minus autotrophic (=NPP) and heterotrophic (soils) res-piration. For the enclosure related data we found a range of VdCOS/VdCO2 between 1.3 and 5.5 with the exception of 0.4
for non fertilized pea plants (Kesselmeier and Merk, 1993), 7.0 for young corn plants (Hoffmann, 1993) and 8.7–10.3 for a spruce enclosure study (Huber, 1994). These extraordi-nary numbers may be subject of further speculation. Within this context, C4 plants need some special discussion. As
128 L. Sandoval-Soto et al.: Global terrestrial COS sink strength
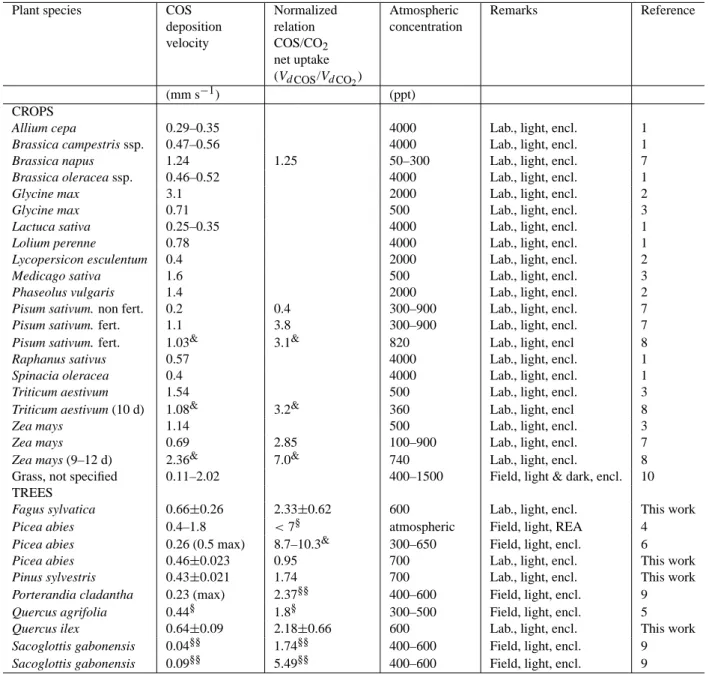
Table 1. Leaf area based exchange and deposition velocities (Vd)of COS and CO2for Fagus sylvatica and Quercus ilex, growing under
350 ppm CO2over 2–3 years. Three tree individuals (T1–T3)were grown and investigated. COS-exchange data were obtained under an
atmospheric COS mixing ratio of 600 ppt. Pinus sylvestris and Picea abies were only measured in one year.
Plant Species COS Uptake (pmol m−2s−1) ±SD VdCOS (mm s−1) ±SD (n) CO2Uptake (µmol m−2min−1) ±SD VdCO2 (mm s−1) ±SD (n) VdCOS / VdCO2 F. sylvatica T1 13.8 4.8 0.551 0.211 19 171 12 0.199 0.022 >57 2.77 (1.54–4.31) Summer 1998 T2 12.5 3.0 0.441 0.168 21 193 8 0.225 0.021 >51 1.96 (1.11 – 2.99) T3 12.3 4.7 0.429 0.226 36 238 7 0.277 0.025 >69 1.55 (0.67–2.60) F. sylvatica T1 21.7 4.8 0.873 0.217 28 317 29 0.370 0.046 >84 2.36 (1.58–3.36) Summer 1999 T2 26.1 13.7 1.105 0.486 33 332 27 0.387 0.046 >99 2.86 (1.43–4.67) T3 19.1 8.5 0.994 0.268 43 354 25 0.290 0.078 >129 3.43 (1.97–5.95) F. sylvatica T1 11.3 5.1 0.460 0.221 54 204 6 0.238 0.022 >162 1.93 (0.92–3.15) Fall 1999 T2 11.5 6.4 0.470 0.271 71 241 17 0.281 0.031 >213 1.67 (0.64–2.96) T3 14.1 0.5 0.575 0.094 99 201 5 0.234 0.021 >297 2.46 (1.89–3.14) Q. ilex T1 15.1 6.9 0.612 0.279 27 283 44 0.330 0.059 >81 1.86 (0.86–3.29) Summer 1998 T2 12.9 4.9 0.542 0.210 50 197 14 0.229 0.026 >150 2.37 (1.30–3.70) T3 14.8 6.4 0.679 0.189 19 180 9 0.210 0.021 >57 3.23 (2.12–4.59) Q. ilex T1 16.4 4.6 0.751 0.166 33 347 25 0.404 0.045 >99 1.86 (1.30–2.55) Summer 1999 T2 14.4 2.7 0.514 0.164 44 308 22 0.359 0.040 >152 1.43 (0.88–2.13) T3 15.4 3.4 0.700 0.113 29 318 17 0.371 0.037 >87 1.89 (1.44–2.43) Q. ilex T1 25.8 2.1 0.673 0.372 120 179 16 0.208 0.026 >360 3.24 (1.29–5.74) Winter 1999/2000 T2 25.1 1.5 0.575 0.263 81 318 17 0.371 0.037 >243 1.55 (0.76–2.51) T3 23.1 2.5 0.733 0.219 94 289 23 0.336 0.039 >282 2.18 (1.37–3.21) P. sylvestris Fall 2002 T1 21.1 1.7 0.743 0.035 23 298 22 0.427 0.021 >69 1.74 (1.58–1.92) P. abies Fall 2002 T1 12.6 1.7 0.435 0.060 43 275 20 0.459 0.023 >129 0.95 (0.78–1.14)
scheme as obtained for the majority of C3 plants. The Vd
-ratios ranged near to 3, indicating a similar preference for COS. Very young plants even showed much higher ratios. In contrast, a recent study (Yonemura et al., 2005) reported a Vd-ratio for Sorghum, another C4 grass, ranging around
one, thus exhibiting no preferred uptake of COS. The au-thors related this behaviour to be caused by low carbonic an-hydrase content which could not be balanced by the activity of the enzymes Phosphoenolpyruvate-Carboxylase (PEP-Co) and Ribulose-1,5-Bisphosphate-Carboxylase (Rubisco), both also principally capable to consume COS (Protoschill-Krebs and Kesselmeier 1992). Further studies on the enzymatic regulation of COS-uptake are crucially needed, especially for C4plants.
3.3 Corrected estimate of a global sink strength for COS The data presented above on the uptake of COS normalized to the net assimilation or gross assimilation, respectively, al-lows a new global sink strength to be estimated for the veg-etation (Table 3). Our calculations were based on deposition velocity (Vd)ratios of COS versus CO2fluxes according to
Eq. (1).
JCOS=JCO2× [COS]/[CO2] ×VdCOS/VdCO2 (1)
with
JCOS global COS uptake (mol m−2s−1)
JCO2 global CO2uptake (mol m
−2s−1)
[COS] atmospheric COS mixing ratio (mol m−3)
[CO2] atmospheric CO2mixing ratio (mol m−3)
VdCOS COS deposition velocity (m s
−1)
VdCO2 CO2deposition velocity (m s−1).
For global CO2fluxes we considered net primary
produc-tivity (NPP). NPP dry matter data according to Whittaker and Likens (1975) and Lieth (1975) were recalculated to NPP carbon according to Larcher (1994). Based on our observa-tions of different deposition velocities we assigned ecotype related Vd-ratios and recalculated the COS sinks accordingly.
For each ecotype we tried to take into account the exchange behavior of typical plant species. Based on our compilation in Table 2 we were able to assign a Vd-ratio for each
eco-type except for “Extreme desert” and “Swamp and marsh”. Instead a best guess was used. The results show that tropical and boreal forests, as well as savannas, are of highest signifi-cance for a global estimate of the vegetation sink strength. A ranking of ecotype-significance for the global budget shows that tropical rainforest contributes most, followed by tropi-cal seasonal forest, savannah, boreal forest, cultivated land, temperate deciduous and evergreen forest, to an overall NPP based total COS sink strength of 0.69–1.4 Tg a−1.
4 Discussion
The exchange of COS between the atmosphere and higher plants, algae, lichens, as well as soil has been reported to
Table 2. Carbonyl sulfide (COS) deposition velocities (Vd)and normalized net uptake as expressed in the Vd– ratio of COS and CO2. Data
as obtained in the course of this study by measurements and recalculations from published data compared to available literature values of measurements in the field, and laboratory (lab.) mainly with enclosures (encl.) or by relaxed eddy accumulation (REA) measurements.
Plant species COS
deposition velocity Normalized relation COS/CO2 net uptake (Vd COS/Vd CO 2) Atmospheric concentration Remarks Reference (mm s−1) (ppt) CROPS
Allium cepa 0.29–0.35 4000 Lab., light, encl. 1
Brassica campestris ssp. 0.47–0.56 4000 Lab., light, encl. 1
Brassica napus 1.24 1.25 50–300 Lab., light, encl. 7
Brassica oleracea ssp. 0.46–0.52 4000 Lab., light, encl. 1
Glycine max 3.1 2000 Lab., light, encl. 2
Glycine max 0.71 500 Lab., light, encl. 3
Lactuca sativa 0.25–0.35 4000 Lab., light, encl. 1
Lolium perenne 0.78 4000 Lab., light, encl. 1
Lycopersicon esculentum 0.4 2000 Lab., light, encl. 2
Medicago sativa 1.6 500 Lab., light, encl. 3
Phaseolus vulgaris 1.4 2000 Lab., light, encl. 2
Pisum sativum. non fert. 0.2 0.4 300–900 Lab., light, encl. 7
Pisum sativum. fert. 1.1 3.8 300–900 Lab., light, encl. 7
Pisum sativum. fert. 1.03& 3.1& 820 Lab., light, encl 8
Raphanus sativus 0.57 4000 Lab., light, encl. 1
Spinacia oleracea 0.4 4000 Lab., light, encl. 1
Triticum aestivum 1.54 500 Lab., light, encl. 3
Triticum aestivum (10 d) 1.08& 3.2& 360 Lab., light, encl 8
Zea mays 1.14 500 Lab., light, encl. 3
Zea mays 0.69 2.85 100–900 Lab., light, encl. 7
Zea mays (9–12 d) 2.36& 7.0& 740 Lab., light, encl. 8
Grass, not specified 0.11–2.02 400–1500 Field, light & dark, encl. 10
TREES
Fagus sylvatica 0.66±0.26 2.33±0.62 600 Lab., light, encl. This work
Picea abies 0.4–1.8 <7§ atmospheric Field, light, REA 4
Picea abies 0.26 (0.5 max) 8.7–10.3& 300–650 Field, light, encl. 6
Picea abies 0.46±0.023 0.95 700 Lab., light, encl. This work
Pinus sylvestris 0.43±0.021 1.74 700 Lab., light, encl. This work
Porterandia cladantha 0.23 (max) 2.37§§ 400–600 Field, light, encl. 9
Quercus agrifolia 0.44§ 1.8§ 300–500 Field, light, encl. 5
Quercus ilex 0.64±0.09 2.18±0.66 600 Lab., light, encl. This work
Sacoglottis gabonensis 0.04§§ 1.74§§ 400–600 Field, light, encl. 9
Sacoglottis gabonensis 0.09§§ 5.49§§ 400–600 Field, light, encl. 9
Note: No correction was applied to take into account the decrease of the measured net CO2exchange by respiration (Net uptake). Hence,
con-sidering a gross photosynthetic uptake by increasing the CO2uptake can lead to significantly reduced values for the normalized COS/CO2 -uptake in case of data obtained by flux studies above the forest with the influence of stem and soil respiration.
§recalculated based on published fluxes and atmospheric mixing ratios of 500 ppt for COS and 350 ppm for CO 2. §§recalculated considering maximal V
d- values only.
&calculated on actual data as given in the paper.
Literature cited:1Kluczewski et al. (1985);2Taylor et al. (1983);3Goldan et al. (1988);4Xu et al. (2002);5Kuhn et al. (1999);6Huber (1994);7Kesselmeier and Merk (1993);8Hofmann (1993);9Kesselmeier et al. (1993);10Geng and Mu (2004).
be governed by the actual ambient concentrations and to ex-hibit a compensation point, i.e. describing the atmospheric concentration where uptake and emission are balanced and the net exchange is zero (Goldan et al., 1988; Kesselmeier
and Merk, 1993; Conrad, 1994; Blezinger et al., 2000; Kesselmeier et al., 1999; Kuhn et al., 1999; Conrad and Meuser, 2000; Kuhn and Kesselmeier, 2000, Geng and Mu, 2004). However, in case of vegetation all reported
com-130 L. Sandoval-Soto et al.: Global terrestrial COS sink strength
Table 3. Estimate of global sink strength for carbonyl sulfide (COS) based on deposition velocity (Vd)ratios of COS versus CO2of
typical plant species and net primary productivity (NPP). NPP dry matter data according to Whittaker and Likens (1975) and Lieth (1975) recalculated to NPP carbon according to Larcher (1994).
Ecosystem type Area (106km2) NPP dry matter (g m−2a−1) NPP dry matter (109t a−1) NPP C (1015g a−1) NPP CO2 (1015g/a) Vdratios COS/CO2 min–max FCOS Tg /a min–max
Plant species related
Vd assigned
(see Table 2) Tropical rain forest 17 2200 37.40 16.46 60.34 1.7–3.6 0.246–0.508 S. gabonensis.
P. cladantha
Tropical seasonal forest 7.5 1600 12.00 5.28 19.36 1.7–3.6 0.079–0.163 S. gabonensis. P. cladantha
Temperate evergreen forest 5 1300 6.50 2.86 10.49 1.5–2.9 0.037–0.071 Q. ilex, Q. agrifolia
Temperate deciduous forest 7 1200 8.40 3.70 13.55 1.7–3.0 0.054–0.095 F. sylvatica
Boreal forest 12 800 9.60 4.22 15.49 1–1.7 0.036–0.063 P. abies, P. sylvestris
Woodland and scrubland 8.5 700 5.95 2.62 9.60 1.5–2.9 0.034–0.065 Q. ilex, Q. agrifolia
Savannah 15 900 13.50 5.94 21.78 1.5–2.9 0.076–0.148 Q. ilex, Q. agrifolia
Temperate grassland 9 600 5.40 2.38 8.71 2.0–3.0 0.041–0.061 Z. mays, T. aestivum
Tundra and alpine 8 140 1.12 0.49 1.81 2.0–3.0 0.008–0.013 best guess
Desert and semi desert scrub 18 90 1.62 0.71 2.61 1.5–2.9 0.009–0.018 Q. ilex, Q. agrifolia
Extreme desert. rock. sand. ice 24 3 0.07 0.03 0.12 1.0–3.0 0.000–0.001 best guess
Cultivated land 14 650 9.10 4.00 14.68 1.3–3.8 0.043–0.130 Z. mays, T. aestivum,
B. Napus, P. sativum
Swamp and marsh 2 3000 6.00 2.64 9.68 1.0–3.0 0.023–0.068 best guess
TOTAL 0.686–1.404
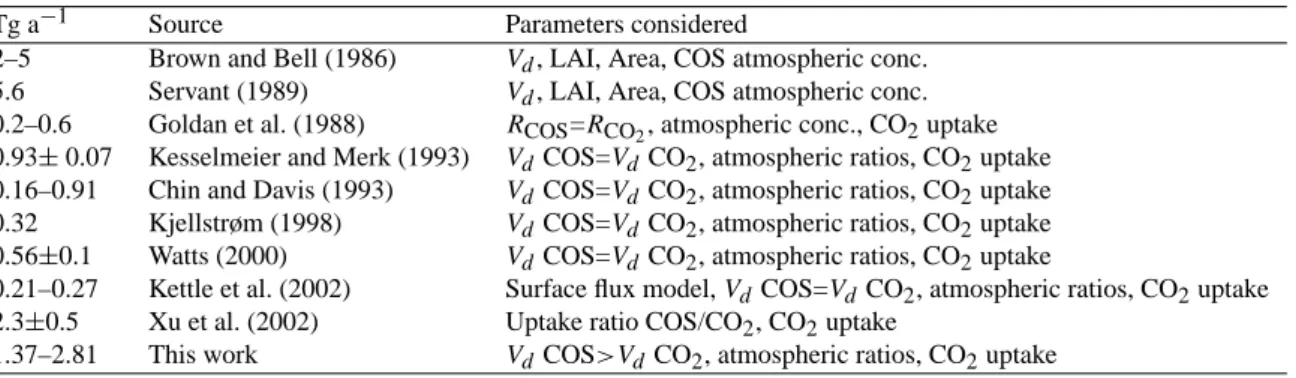
Table 4. Estimates of the global COS sink strength for terrestrial vegetation.
Tg a−1 Source Parameters considered
2–5 Brown and Bell (1986) Vd, LAI, Area, COS atmospheric conc.
5.6 Servant (1989) Vd, LAI, Area, COS atmospheric conc.
0.2–0.6 Goldan et al. (1988) RCOS=RCO2, atmospheric conc., CO2uptake
0.93± 0.07 Kesselmeier and Merk (1993) VdCOS=VdCO2, atmospheric ratios, CO2uptake
0.16–0.91 Chin and Davis (1993) VdCOS=VdCO2, atmospheric ratios, CO2uptake
0.32 Kjellstrøm (1998) VdCOS=VdCO2, atmospheric ratios, CO2uptake
0.56±0.1 Watts (2000) VdCOS=VdCO2, atmospheric ratios, CO2uptake
0.21–0.27 Kettle et al. (2002) Surface flux model, VdCOS=VdCO2, atmospheric ratios, CO2uptake
2.3±0.5 Xu et al. (2002) Uptake ratio COS/CO2, CO2uptake
1.37–2.81 This work VdCOS>VdCO2, atmospheric ratios, CO2uptake
pensation points are much lower than the observed ambient concentration ranges. Furthermore, within our reported ex-periments we never observed any COS emission, even un-der COS-free air. Moreover, by incorporating the deposi-tion velocities of COS and CO2 instead of their uptake
ra-tios we already considered the linear relationship between the exchange of a trace gas and its atmospheric concentra-tion. Thus, we assume that neither a compensation point nor the relationship between uptake and atmospheric concentra-tion will interfere with our interpretaconcentra-tions and estimates.
The close relation of COS uptake to photosynthesis and the clear consumption pathway via stomatal uptake allowed a recalculation of the COS uptake by terrestrial vegetation. We regard this Vd-ratio-corrected estimate of the COS sink
strength to be necessary when estimating a COS sink strength from NPP and regard earlier estimates not taking such a cor-rection into account as to be too low. Furthermore, we have to consider that COS is taken up and consumed without
be-ing released by the vegetation. COS is irreversibly lost within the biochemical consumption. A production pathway is not known to our knowledge. In contrast, CO2 is clearly
pro-duced by respiration processes and its release leads to a car-bon loss. Hence, all data on net carcar-bon uptake or net pri-mary production do not consider the gross uptake rates of CO2, which represent the real basis for the uptake
relation-ship between COS and CO2. As we used the net primary
productivity (NPP) data from Whittaker and Likens (1975) for global ecotype depending estimations, the loss by het-erotrophic respiration had to be taken into account in order to relate the uptake of COS to the real uptake of CO2. This
NPP value represents only around 50% of the total gross CO2
uptake by vegetation. A 50% loss by autotrophic respiration, i.e. respiration by the photoautotrophic biological organism itself, has been subtracted from the Gross Primary Productiv-ity (GPP). In contrast, the data resulting from the enclosure measurements represent a net exchange based on the gross
uptake of CO2minus the respiration of the leaves and some
branches only. We regarded the respiration in the light to be lower than the dark respiration as it may be inhibited in the light (see Shapiro et al., 2004 and literature cited therein). Therefore, we assumed the contribution of the branch respi-ration to the overall net exchange data to be small as com-pared to the overall respiration of a whole tree with stem and roots. Hence, in a first attempt we doubled the number for the COS sink in order to relate to the real gross CO2 flux
which was the basis for the NPP calculated by Whittaker and Likens (1975). This correction leads to an estimate of a COS sink strength between 1.4–2.8 Tg a−1, equivalent to 0.73–1.5 Tg a−1on a sulfur basis.
Table 4 gives an overview, comparing the different es-timates as reported within the last years. Different pro-cedures have been used based on several parameters such as atmospheric COS concentration, deposition velocity, leaf and ground area as well as the relation of COS deposition to the uptake of CO2. The highest estimates between 2
and 5.6 Tg a−1were calculated not taking into account the close relation to CO2assimilation, thus excluding any
diur-nal and seasodiur-nal effect. Much lower values, between 0.2 and 1.0 Tg a−1, supported by a modeling study with similar low estimates (Kettle et al., 2002), were obtained by relating the deposition of COS to the CO2assimilation data bases. The
latter group, however, did not take into account the preferred uptake and enzymatic consumption of COS as related to the CO2assimilation. In contrast, the results of Xu et al. (2002),
based on flux measurements over a coniferous forest, fit well into such an estimation by taking into account a preferential uptake ratio of COS/CO2. Including such a preference by
correction with the deposition velocity ratios, the new data presented here show that this new procedure results in a sig-nificant increase of the COS sink strength calculation again, as productivity, seasonality as well as the preferred uptake is taken into account.
Nevertheless, uncertainties remain large and depend on a still limited data set. A systematic error may be caused by the calculation procedure of the deposition velocity. Ac-cording to Winner and Greitner (1989), the actual relevant atmospheric conditions for the incubated samples are repre-sented by the concentrations inside the branch cuvette. We agree with the aforementioned authors. However, plotting exchange data against the atmospheric concentrations inside the branch cuvette lead to an increased scatter of the lin-earization. Therefore, we decided to take the concentra-tions inside the reference cuvette into account. Hence, as the branch cuvette air exhibited 20–40% lower COS values due to the consumption by the leaves, our actual result may underestimate Vdfor COS. Therefore, the final number of the
global uptake might also be underestimated by roughly 20– 40%. Influences of climatic factors are minimized as long as the available NPP data are accurate. Closely relating the COS consumption to the NPP means to transfer automati-cally all environmental parameters affecting CO2exchange
to the COS uptake. Based on a set of enclosure studies we report the net uptake of CO2 in relation to the net uptake
of COS. However, in contrast to the net exchange of CO2,
which is based on assimilation and respiration, the COS up-take seems to be irreversible under normal atmospheric con-centrations. Hence, in case of CO2 we have to add
esti-mates of night- and daytime respiration rates in order to ob-tain the real Gross Primary Productivity (GPP) which can be regarded as the best basis for any CO2related estimation of
the COS sink strength, as it includes all environmental pa-rameters best. To achieve this goal we need exchange stud-ies covering longer episodes and day/night studstud-ies in order to estimate autotrophic respiration for enclosure studies and au-totrophic plus heterotrophic respiration for flux studies. Fur-thermore, we need a better experimental data set especially for tropical and boreal forest trees, as both ecotypes may rep-resent a dominant contribution to the global terrestrial sink strength for COS.
5 Conclusions
Taking into account the deposition velocities for the uptake of COS in relation to CO2 leads to a significant increase
of the COS sink strength estimate for terrestrial vegetation in the range of 1.4–2.8 Tg a−1. As the calculation depends
on GPP estimates it includes all environmental and seasonal effects. Such an estimate suggests that the vegetation sink strength may have been underestimated in earlier COS bud-get calculations. This result questions the balance of known sinks and sources. We need to investigate again well known COS sources in order to check their validity. It is beyond our capabilities to state errors, but we seem to have substantial gaps in our knowledge of the COS production and consump-tion. Undescribed sources may be detected by careful mea-surements. Within this context the recent report by Mu et al. (2004) for example about abiotic COS production within rain water is of high interest.
Acknowledgements. We acknowledge the financial support of L. Sandoval-Soto by DAAD as well as the fundamental support by the Max Planck Society in the course of the PhD-studies of L.S.-S. We thank the Zentrum f¨ur Umweltforschung (University Mainz) for additional financial support. The authors thank J. Williams for his help with the manuscript.
Edited by: F. X. Meixner
References
Andreae, M. O. and Crutzen, P. J.: Atmospheric aerosols – Bio-geochemical sources and role in atmospheric chemistry, Science, 276, 1052–1058, 1997.
Blezinger S., Wilhelm C., and Kesselmeier, J.: Enzymatic con-sumption of carbonyl sulfide (COS) by marine algae, Bio-geochem., 48, 2, 185–197, 2000.
132 L. Sandoval-Soto et al.: Global terrestrial COS sink strength
Brown, K. A. and Bell, J. N. B.: Vegetation – the missing sink in the global cycle of carbonyl sulfide (COS), Atmos. Env. , 20, 537–540, 1986.
Chin, M. and Davis, D. D.: Global sources and sinks of OCS and CS2and their distribution, Global Biogeochem. Cycles, 7, 321–
337, 1993.
Chin, M. and Davis, D. D.: A reanalysis of carbonyl sulfide as a source of stratospheric background sulfur aerosol, J. Geophys. Res., 100, 8993–9005, 1995.
Conrad, R.: Compensation concentration as a critical variable for regulating the flux of trace gases between soil and atmosphere, Biogeochem., 27, 155-170, 1994.
Conrad, R. and Meuser, K.: Soils contain more than one activity consuming carbonyl sulfide, Atmos. Env., 34, 3635–3639, 2000. Crutzen, P. J.: The possible importance of CSO for the sulfate layer
of the stratosphere, Geophys. Res. Lett., 3, 73–76, 1976. Gabriel, R., Sch¨afer, L. Gerlach, C., Rausch, T., and Kesselmeier, J.:
Factors controlling the emissions of volatile organic acids from leaves of Quercus ilex L. (Holm oak), Atmos. Environment, 33, 1347–1355, 1999.
Geng, C. and Mu, Y.: Carbonyl sulfide and dimethyl sulfide ex-change between lawn and the atmosphere, J. Geophys. Res., 109, D12302, doi:10.1029/2003JD004492, 2004
Goldan, P. D., Fall, R., Kuster, W. C., and Fehsenfeld, F. C.: Uptake of COS by growing vegetation – a major tropospheric sink, J. Geophys. Res.-Atmos., 93, D11, 14 186–14 192, 1988.
Hoffmann, U.: Der Austausch von reduzierten Schwefel-Verbindungen zwischen Vegetation und Atmosph¨are: Interpreta-tion von Versuchen im Freiland in Verbindung mit mechanistis-chen Experimenten im Labor, Dissertation, Fachbereich Biolo-gie, Universit¨at Mainz, 1993.
Huber, B.: Austausch fl¨uchtiger Schwefelverbindungen in land-und forstwirschaftlichen Okosystemen, Dissertation Techn.¨ Univ. M¨unchen, 1993. Schriftenreihe des Fraunhofer-Instituts f¨ur Atmosph¨arische Umweltforschung, Bd. 26, Wissenschaftsverlag Dr. W. Maraun, Frankfurt/M, ISBN 3-927548-65-0, 1994. Kesselmeier, J. and Merk, L.: Exchange of carbonyl sulfide (COS)
between agricultural plants and the atmosphere: Studies on the deposition of COS to peas, corn and rapeseed, Biogeochem., 23, 47–59, 1993.
Kesselmeier, J., Meixner, F. X., Hofmann, U., Ajavon, A., Le-imbach, St., and Andreae, M. O.: Reduced sulfur compound exchange between the atmosphere and tropical tree species in southern Cameroon, Biogeochem., 23, 23–45, 1993.
Kesselmeier, J., Teusch, N., and Kuhn, U.: Controlling variables for the uptake of atmospheric carbonyl sulfide (COS) by soil, J. Geophys. Res.-Atmos., 104, D9, 11 577–11 584, 1999.
Kettle, A. J., Kuhn, U., von Hobe, M., Kesselmeier, J., and An-dreae, M. O.: The Global Budget of Atmospheric Carbonyl Sulfide: Temporal and Spatial Modulation of the Dominant Sources and Sinks, J. Geophys. Res., 107, D22, 4658, 2002, doi:10.1029/2002JD002187.
Kluczewski, S. M., Brown, K. A., and Bell, J. N. B.: Deposition of S-35-Carbonyl Sulfide to vegetable crops, Radiation Protection Dosimetry, 11, 3, 173–177, 1985.
Kuhn, U., Wolf, A., Ammann, C., Meixner, F. X., Andreae, M. O., and Kesselmeier, J.: Carbonyl sulfide exchange on an ecosys-tem scale: Soil represents a dominant sink for atmospheric COS, Atmos. Environm., 33, 995–1008, 1999.
Kuhn, U., Gries, C., Nash III, T. H., and Kesselmeier, J.: Field mea-surements on the exchange of carbonyl sulfide between lichens and the atmosphere, Atmos. Environ., 34, 28, 4867–4878, 2000. Kuhn, U. and Kesselmeier, J.: Environmental parameters control-ling the uptake of carbonyl sulfide by lichens, J. Geophys. Res., 105, 22, 26 783–26 792, 2000.
Larcher, W.: ¨Okophysiologie der Pflanzen, 5. Auflage, Eugen Ul-mer Verlag, Stuttgart, 129, 1994.
Lieth, H.: Modeling the primary productivity of the world, in: Pri-mary productivity of the biosphere, edited by: Lieth, H. and Whittaker, R. H., Springer Verlag, Berlin, 237–283, 1975. Logan, J. A., McElroy, M. B., Wofsy, S. C., and Prather, M. J.:
Ox-idation of CS2and COS: Sources for atmospheric SO2, Nature,
281, 185–188, 1979.
Mu, Y., Gen, C., Wang, M., Wu, H., Zhang, X., and Jiang, G.: Pho-tochemical production of carbonyl sulfide in precipitation, J Geo-phys. Res., 109, D13301, doi: 10.1029/2003JD004206, 2004. Pearcy, R. W., Schulze, E. D., and Zimmermann, R.: Measurement
of transpiration and leaf conductance, in: Plant Physiological Ecology, Chapman and Hall, New York, 141–142, 1989. Protoschill-Krebs G and Kesselmeier J.: Enzymatic pathways for
the consumption of carbonyl sulphide (COS) by higher plants. Botanica Acta 105, 206–212, 1992.
Protoschill-Krebs, G., Wilhelm, C., and Kesselmeier, J.: Consump-tion of carbonyl sulfide by carbonic anhydrase (CA) isolated from Pisum sativum, Atmos. Environm., 30, 3151–3156, 1996. Servant, J.: Les sources et les puits d’oxysulfure de carbone (COS)
a l’echelle mondiale, Atmos. Res., 23, 105–116, 1989.
Shapiro, J.B., Griffin, K.L., Lewis, J.D., and Tissue, D.T.: Response of Xanthium strumarium leaf respiration in the light to elevated CO2concentration, nitrogen availability and temperature, New
Phytologist, 162, 377–286, 2004.
Taylor, G. E., McLaughlin S. B., Shriner D. S., and Selvidge W. J.: The flux of sulfur containing gases to vegetation, Atmos. Envi-ronm., 17, 789–796, 1983.
Von Hobe, M., Kenntner, T., Helleis, F. H., Sandoval-Soto, L., and Andreae, M. O.: Cryogenic Trapping of Carbonyl Sul-fide without Using Expendable Cryogens, Analytical Chemistry, doi10.1021/ac00058fCCC, 2000.
Watts, S. F.: The mass budgets of carbonyl sulfide, dimethyl sulfide, carbon disulfide and hydrogen sulfide, Atmos. Environm., 34, 761–779, 2000.
Winner, W. E. and Greitner, C. S.: Field methods used for air pollu-tion research with plants, in: Plant physiological ecology, edited by: Pearcy, R. W., Ehlinger, J., Mooney, H. A., and Rundel, P. W., Chapman & Hall, London, 400–425, 1989.
Whittaker, R. H. and Likens, G. E.: The biosphere and man, in: The Primary Productivity of the Biosphere, edited by: Lieth, H. and Whittaker, R. H., Springer Verlag, New York, 305–328, 1975. Xu, X., Bingemer, H. G., and Schmid, U.: The flux of carbonyl
sulfide and carbon disulfide between the atmosphere and a spruce forest, Atmos. Chem. Phys., 2, 171–181, 2002,
SRef-ID: 1680-7324/acp/2002-2-171.
Yonemura, S., Sandoval-Soto, L., Kesselmeier, J., Kuhn, U., Von Hobe, M., Yakir, D., and Kawashima, S.: Uptake of carbonyl sulfide (COS) and emission of dimethyl sulfide (DMS) by plants, Phyton, in press, 2005.