HAL Id: hal-00295718
https://hal.archives-ouvertes.fr/hal-00295718
Submitted on 11 Aug 2005
HAL is a multi-disciplinary open access
archive for the deposit and dissemination of
sci-entific research documents, whether they are
pub-lished or not. The documents may come from
teaching and research institutions in France or
abroad, or from public or private research centers.
L’archive ouverte pluridisciplinaire HAL, est
destinée au dépôt et à la diffusion de documents
scientifiques de niveau recherche, publiés ou non,
émanant des établissements d’enseignement et de
recherche français ou étrangers, des laboratoires
publics ou privés.
measurements in the O2 A Band: validation of the
measurements and sensitivity on aerosols
B. van Diedenhoven, O. P. Hasekamp, I. Aben
To cite this version:
B. van Diedenhoven, O. P. Hasekamp, I. Aben. Surface pressure retrieval from SCIAMACHY
mea-surements in the O2 A Band: validation of the meamea-surements and sensitivity on aerosols. Atmospheric
Chemistry and Physics, European Geosciences Union, 2005, 5 (8), pp.2109-2120. �hal-00295718�
SRef-ID: 1680-7324/acp/2005-5-2109 European Geosciences Union
Chemistry
and Physics
Surface pressure retrieval from SCIAMACHY measurements in the
O
2
A Band: validation of the measurements and sensitivity on
aerosols
B. van Diedenhoven, O. P. Hasekamp, and I. Aben
SRON National Institute for Space Research, Utrecht, The Netherlands
Received: 7 February 2005 – Published in Atmos. Chem. Phys. Discuss.: 14 March 2005 Revised: 21 June 2005 – Accepted: 3 August 2005 – Published: 11 August 2005
Abstract. We perform surface pressure retrievals from cloud-free Oxygen A band measurements of SCIAMACHY. These retrievals can be well validated because surface pres-sure is a quantity that is, in general, accurately known from meteorological models. Therefore, surface pressure re-trievals and their validation provide important insight into the quality of the instrument calibration. Furthermore, they can provide insight into retrievals which are affected by sim-ilar radiation transport processes, for example the retrieval of total columns of H2O, CO, CO2and CH4. In our retrieval
aerosols are neglected. Using synthetic measurements, it is shown that for low to moderate surface albedos this leads to an underestimation of the retrieved surface pressures. For high surface albedos this generally leads to an overestima-tion of the retrieved surface pressures. The surface pres-sures retrieved from the SCIAMACHY measurements in-deed show this dependence on surface albedo, when com-pared to the corresponding pressures from a meteorological database. However, an offset of about 20 hPa was found, which can not be caused by neglecting aerosols in the trieval. The same offset was found when comparing the re-trieved surface pressures to those rere-trieved from co-located GOME Oxygen A band measurements. This implies a cali-bration error in the SCIAMACHY measurements. By adding an offset of 0.86% of the continuum reflectance at 756 nm to the SCIAMACHY reflectance measurements, this systematic bias vanishes.
1 Introduction
The satellite instrument SCIAMACHY (Bovensmann et al., 1999), launched March 2002 on ENVISAT, and its precur-sor GOME (Burrows et al., 1999), launched in 1995 on
Correspondence to: B. van Diedenhoven
ERS-2, measure in the Oxygen A absorption band, near 760 nm. These measurements are of great importance for the retrieval of cloud properties (Koelemeijer et al., 2001; Rozanov and Kokhanovsky, 2004) and aerosol properties (Koppers et al., 1997). These retrievals assume the surface pressure is known. Alternatively, surface pressures can be re-trieved from the Oxygen A band measurements (Barton and Scott, 1986; Br´eon and Bouffi´es, 1996; Vanbauce et al., 1998; Dubuisson et al., 2001; Ramon et al., 2004). Surface pres-sure retrievals can be used to scale total column retrievals of other species, e.g. H2O, CO, CO2, CH4, in order obtain
vol-ume mixing ratios (Buchwitz et al., 2005a,b) or for light path corrections (Kuang et al., 2002). Furthermore, surface pres-sure retrievals can be well validated because surface prespres-sure is a quantity that is, in general, accurately known from me-teorological models. Therefore, surface pressure retrievals and their validation provide important insight into the qual-ity of the instrument calibration (Dubuisson et al., 2001). Furthermore, they can provide insight into retrievals which are affected by similar radiation transport processes, for ex-ample the retrieval of total columns of H2O, CO, CO2 and
CH4from SCIAMACHY measurements. The most
impor-tant potential error source for surface pressure retrievals from cloud-free measurements is scattering by aerosols (Br´eon and Bouffi´es, 1996; Dubuisson et al., 2001). As the relevant aerosol information is usually not available, surface pres-sures retrieved from the Oxygen A band neglecting aerosol scattering are normally referred to as apparent surface pres-sures.
In this paper apparent surface pressures are retrieved from SCIAMACHY Oxygen A band measurements. To interpret the retrieved apparent surface pressures, first the effect of aerosols on the retrieval of surface pressure is studied us-ing simulated measurements. The surface pressures retrieved from SCIAMACHY measurements are validated with refer-ence surface pressures from a meteorological model. Addi-tionally, the retrieved surface pressures are compared with
surface pressures retrieved from coinciding GOME Oxygen A band measurements. Measurements of GOME overlap very well with those of SCIAMACHY with a time lag of only about 30 min, allowing a good comparison. Although SCIAMACHY has been calibrated on ground, this calibra-tion needs to be validated in flight. Therefore, the results and validation of our retrievals are useful to identify calibration inaccuracies.
The paper is constructed as follows. First the retrieval method is presented in Sect. 2. The effect of aerosols on the surface pressure retrieval and on the Oxygen A band measurements is studied using simulated measurements in Sect. 3. Then, in Sect. 4, the surface pressures retrieved from SCIAMACHY measurements are presented and compared with the findings from the simulated measurements and with surface pressures retrieved from GOME measurements. The discussion and conclusions follow in Sect. 5.
2 The retrieval method
For the retrieval of a state vector x from a measurement vector y, a forward model F is needed that describes how y depends on x, i.e.
y = F(x) + e, (1)
with error term e. The measurement vector y contains the reflectances measured at different wavelengths and the state vector x contains the unknown parameters to be retrieved. For the surface pressure retrievals in this paper the state vec-tor x contains at least the following parameters: (1) the sur-face pressure, (2) the sursur-face albedo at 756 nm and (3) the linear spectral dependence of the surface albedo. Addition-ally, x may contain instrument parameters such as a wave-length shift and response function parameters.
Since SCIAMACHY and GOME are polarisation sensitive instruments, the intensity Ipolmeasured by a certain detector
pixel at wavelength λi is not only affected by the intensity
of the light that enters the instrument but also by its state of polarisation, viz.
Ipol(λi) = ¯IT OA(λi) +
m12(λi) ¯QT OA(λi) + m13(λi) ¯UT OA(λi), (2)
where m12 and m13 are elements of the instrument’s M¨uller
matrix normalised to its element (1,1). Furthermore, ¯IT OA,
¯
QT OA, and ¯UT OA are the elements of the intensity vector
¯ IT OAdefined by ¯IT OA(λi) = ∞ Z 0 dλ S(λi, λ)IT OA(λ), (3)
where IT OA(λ)is the intensity vector of the light at the
en-trance of the instrument. The spectral response function S is
described by
S(λi, λ) =
a12
((λi−λ)/1p)4+a20
, (4)
where 1pis the width of the detector pixels, assumed to be
0.217 nm. The width of the response function is determined by a0. For SCIAMACHY and GOME, the value of a0 is
approximately 1.1772 and 0.7377, respectively. The normal-isation factor a1is determined by the requirement
Z ∞
0
S(λi, λ)dλ =1. (5)
Similarly to the earth radiances, SCIAMACHY and GOME also measure the solar irradiance Foto obtain the polarisation
sensitive reflectances Rpoldefined by
Rpol =
Ipol
Fo
. (6)
The common approach to account for the polarisation sensi-tivity of SCIAMACHY and GOME is to apply a polarisation correction to the radiances Ipol using the Polarisation
Mea-surement Devices (PMDs). However, the broadband PMD measurements are not sufficient to correct for the polarisa-tion sensitivity in spectral regions where the state of polar-isation is varying rapidly with wavelength, as is the case for the Oxygen A band (Stam et al., 2000; Schutgens and Stammes, 2003). Moreover, the SCIAMACHY PMDs are not yet well calibrated. In our retrieval approach, these er-rors due to polarisation sensitivity are avoided by using the polarisation sensitive reflectances Rpolas the elements of the
measurement vector y. This means that the forward model F directly models the polarisation sensitive reflectances Rpol.
This approach was introduced by Hasekamp et al. (2002) for the retrieval of Ozone profiles from GOME.
The main part of the forward model F is an atmospheric radiative transfer model. In this study the SRON radia-tive transfer model (Hasekamp and Landgraf, 2002) is used, which uses a Gauss-Seidel iteration scheme to solve the plane-parallel radiative transfer equation. This model fully includes polarisation and multiple scattering. A Rayleigh scattering atmosphere is assumed with 60 1 km thick lay-ers. The absorption line parameters are taken from the
HI-TRAN 2004 spectroscopic database (Rothman et al., 2003,
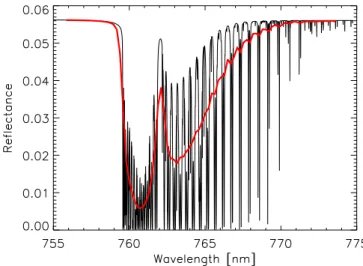
2005) and a Voigt lineshape is assumed. The cross-section sampling and radiative transfer calculations are performed on a 0.005 nm spectral resolution. Figure 1 shows an ex-ample of the Oxygen A band at 0.005 nm resolution and at SCIAMACHY resolution. The Oxygen A band consists of 2 branches which are resolved in the SCIAMACHY resolu-tion, i.e. the deep R branch around 761 nm and the broader P branch around 765 nm. All retrievals are performed using iterative non-linear least squares fitting. For these fits, ln(R) is used instead of R. All retrievals are performed using iter-ative non-linear least squares fitting. For these fits, ln(R) is used instead of R.
Fig. 1. Example of an Oxygen A band reflectance spectrum at
0.005 nm spectral resolution (black) and at SCIAMACHY resolu-tion (red).
3 Retrieval from simulated measurements
Dubuisson et al. (2001), among others, have shown that aerosols significantly affect surface pressure retrievals from Oxygen A band measurements. Furthermore, they showed that the effects of aerosols depend on surface albedo. To study the effects of aerosols on the retrieval of surface pres-sure from SCIAMACHY, SCIAMACHY meapres-surements are simulated for atmospheres with different aerosol loads and above several surface albedos. Subsequently, the apparent surface pressure from these simulated measurements are re-trieved using a forward model with only Rayleigh scattering included. For these retrievals, the state vector x (see Eq. 1) contains only the surface pressure and surface albedo and the linear spectral dependence of the surface albedo. The SCIA-MACHY measurements are simulated for a nadir viewing ge-ometry with a solar zenith angle of 40◦and the US standard atmosphere with a surface pressure of 1000 hPa. Desert dust aerosols are included of which the characteristics are given in Table 1. The optical aerosol properties are calculated using Mie theory.
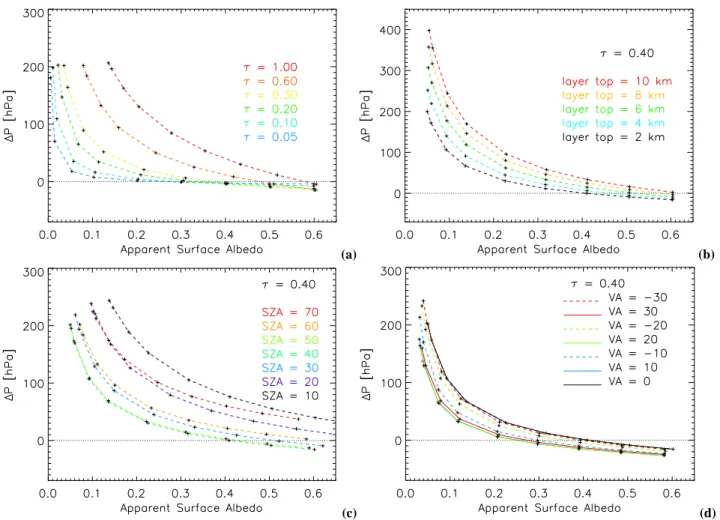
Figures 2a and 2b show the difference between the true surface pressure and the retrieved apparent surface pres-sure (1P =Ptrue−Papparent) as a function of retrieved
appar-ent surface albedo, for differappar-ent aerosol optical thicknesses and height distributions, respectively. Figures 2c and 2d show 1P as a function of apparent surface albedo for vary-ing solar zenith angles and viewvary-ing geometries, respectively. Although depending on aerosol optical thickness, aerosol height distribution, aerosol type and geometry, two general effects are observed: (1) For low and moderate surface albe-dos the surface pressures are underestimated in the retrieval. This is due to the relatively high contribution to the measured
Table 1. Characteristics at 765 nm of the two modes of the desert
dust aerosols used in this study, based on aerosol model DL from Torres et al. (2001). A log-normal size distribution is assumed. The relative contribution of the modes to the number concentration is represented by the fraction. The aerosols are evenly distributed over the first 2 kilometres and decrease in number as P3 from 2 to 10 km, unless indicated otherwise. The single scattering albedo of the aerosols used is 0.97605.
mode Effective Size Refr. index fraction radius variance real imag.
1 0.105 µm 0.323 µm2 1.53 0.001 0.99565 2 1.605 µm 0.418 µm2 1.53 0.001 0.00435
radiances of photons that are scattered back by the aerosol layer, reducing the photon path. Furthermore, most of the light penetrating through the aerosol layer is absorbed by the surface. This effect was also identified by Dubuisson et al. (2001). (2) At large surface albedos, the surface pressures are, in general, overestimated in the retrieval. Here, most photons penetrating through the aerosol layer are reflected by the surface and travel through the aerosol layer once more. Due to (multiple) scattering in the aerosol layer the photon path is enhanced, resulting in an overestimation of the sur-face pressure. This effect was not previously recognised by Dubuisson et al. (2001).
Furthermore, the results show that the effects of aerosols on the surface pressure retrieval increase with increasing aerosol optical thickness, while the aerosol height distribu-tion only significantly impacts the surface pressure retrieval above low albedos. The solar zenith angles (SZA) impact the sensitivity of surface pressure retrieval on aerosols above all surface albedos. Starting at SZA=10◦, the values for
1P first decrease towards larger SZA, reach a minimum for SZA≈40◦, and then increase towards larger SZA. This be-haviour is due to the fact that, on the one hand, an increase in SZA, and therewith geometrical path, causes (1) an enhanced optical path due to multiple scattering and on the other hand (2) leads to a decrease in optical path due to increased extinc-tion. Below SZA≈40◦, the former effect dominates, while the latter effect dominates for higher SZA. Also the viewing geometry significantly impacts the sensitivity of surface pres-sure retrieval on aerosols above all surface albedos. Maxi-mum values of 1P occur at nadir geometries. The aerosol type affects the apparent surface pressure retrieval as well (not shown). Generally, a decrease in the aerosol particle size leads to an increase in multiple scattering and therewith, apparent surface pressures.
To summarise, Fig. 2 shows that due to varying aerosol op-tical thickness and height distribution and varying geometry, the expected range in 1P is about 30 hPa above high surface albedos and about 300 hPa above low surface albedos. This is
(a) (b)
(c) (d)
Fig. 2. The difference between the true surface pressure used in the simulated measurements including aerosols and the apparent surface
pressure retrieved ignoring aerosols, 1P =Ptrue−Papparent, as a function of retrieved apparent surface albedo. The true surface albedos are
0, 0.01, 0.05, 0.1, 0.2, 0.3, 0.4, 0.5 and 0.6. The retrieved values are indicated by plusses. A nadir viewing geometry with a solar zenith angle of 40◦is used. Panel (a) shows the retrieved values for different values of the total aerosol optical thickness τ at 765 nm. To obtain τ at the more common wavelength of 550 nm, the values have to be multiplied by 1.11. Panel (b) shows the retrieved values for different height distributions. Here, our standard aerosol distribution (see Table 1) is modified such that the lower layer with evenly distributed aerosols is extended to higher levels, indicated by the layer top. In panel (c), the retrieved 1P and surface albedos are shown for varying solar zenith angles (SZA) with a nadir viewing geometry. Panel (d) shows the retrieved values for different viewing angles (VA), when a relative azimuth angle of 50◦is taken. Solid and dashed lines indicate negative and positive viewing angles, respectively. In Panels (b), (c) and (d) an aerosol optical thickness of 0.4 is taken.
in agreement with what is found by other authors (Vanbauce et al., 1998; Dubuisson et al., 2001; Ramon et al., 2004).
The spectral fitting residuals between the simulated mea-surements for an atmosphere including aerosols and the fit-ted reflectances ignoring aerosols are shown in Fig. 3a and b, for different aerosol optical thicknesses and height distri-butions, respectively. The residuals show a large negative peak in the centre of the deep R branch and positive values in the P branch. The amplitude of the residuals increases with increasing aerosol optical thickness (Fig. 3a) and increasing height of the bulk of the aerosols (Fig. 3b). Furthermore, it depends on type of the aerosols and slightly on the surface albedo (not shown). The shape of the residuals, however, is characteristic.
Figures 2 and 3 show a clear dependence of both 1P and the spectral fitting residual on the aerosol height distribution and optical thickness. This implies that, when the true sur-face pressure and the aerosol type are known, information about the aerosol optical thickness and height distribution can be retrieved from the Oxygen A band measurements. This was previously demonstrated by Koppers et al. (1997).
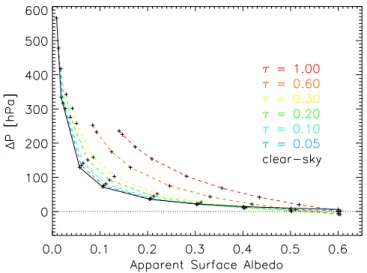
In addition to aerosols, Rayleigh scattering also has a large effect on the surface pressure retrievals, although the Rayleigh scattering optical thickness at these wavelengths is relatively low (∼0.025). This effect is illustrated in Fig. 4, which shows 1P retrieved while neglecting all scatter-ing from simulated SCIAMACHY measurements for atmo-spheres including aerosols and, additionally, for a clear-sky
(a) (b)
Fig. 3. Residuals between the simulated reflectance measurements Rmeasfor an atmosphere including aerosols and the fitted reflectances
Rmod ignoring aerosols. The residuals are defined as (Rmod−Rmeas)/Rmeas×100%. A surface albedo of 0.1 is used. The residuals are
shown for different values of the aerosol optical thickness (a) and different height distributions (b), similar to Fig. 2a and Fig. 2b respectively.
atmosphere including only Rayleigh scattering. In the clear-sky case, neglecting Rayleigh scattering in the retrieval leads to an underestimation of the surface pressure above all sur-face albedos. For aerosol loaded atmospheres, a comparison of Fig. 4 with Fig. 2 shows that, at low albedos and for a low aerosol optical thickness, the effect of neglecting Rayleigh scattering dominates the effect of neglecting aerosols. Fur-thermore, at large albedos the effect of neglecting Rayleigh scattering can partly compensate for the effect of neglecting aerosols. The large effect of Rayleigh scattering can be ex-plained by the fact that the Oxygen A band contains a large number of optically thick absorption lines (see Fig. 1) for which only few photons penetrate through the atmosphere to high pressure levels. At low pressure levels, aerosol op-tical depths are generally low and thus the reflectance at the wavelengths of these optically thick absorption lines is mainly determined by Rayleigh scattering. Therefore, ne-glecting Rayleigh scattering in the forward model leads to an increase in the depth of these absorption lines which leads to an underestimation of the surface pressure.
The simulations in this section show that aerosols signif-icantly affect the Oxygen A band measurements. When re-trieving surface pressure neglecting aerosol scattering, char-acteristic residuals as shown in Fig. 3 are expected. Fur-thermore, surface pressures retrieved using the Oxygen A band are expected to underestimate the actual surface pres-sure at low and moderate albedos and overestimate them at high albedos.
Fig. 4. Similar to Fig. 2a, but when 1P and the apparent surface
albedo are retrieved while neglecting all scattering. The solid black line shows results of retrievals from simulated measurements for a clear-sky case including only Rayleigh scattering.
4 Retrieval from SCIAMACHY measurements
4.1 Data
For this study, the reflectances in the Oxygen A band mea-sured by SCIAMACHY and GOME are analysed. The char-acteristics of the Oxygen A band measurements for both in-struments are summarised in Table 2.
The SCIAMACHY reflectances (level 1b data) used in this study are improved by replacing calibration data using
(a) (b)
Fig. 5. False colour images from SCIAMACHY (left) and GOME (right) measurements. For this study data from SCIAMACHY orbits 4700
(West) and 4699 (East) and GOME orbits 30 123 106 (West) and 30 123 092 (East) are used. The PMDs of SCIAMACHY and GOME used to produce these images measure in different wavelength ranges, resulting in different colouring.
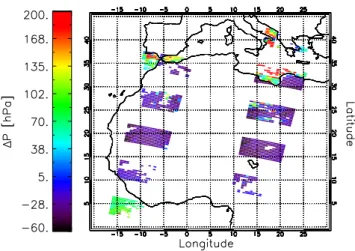
Fig. 6. The absolute differences between the reference sur-face pressures and the retrieved apparent sursur-face pressures (1P =Preference−Papparent) for the SCIAMACHY measurements
from orbit 4700 (west) and 4699 (east).
SCIA PATCH NL11. For both instruments all calibration options are applied, with the exception of the polarisation sensitivity correction, which is not needed because the po-larisation sensitive measurement is modelled directly (see Sect. 2). Furthermore, on the reflectances measured by SCIAMACHY a multiplicative correction factor of 1.2 is ap-plied. This correction factor was found by Acarreta et al. (2004) and Acarreta and Stammes (2005) by comparing the
1Available at http://www.sron.nl/∼hees/SciaDC.
Table 2. Characteristics of the SCIAMACHY and GOME
measure-ments in the Oxygen A band from 755–775 nm.
SCIAMACHY GOME
Channel 4 4
Spectral resolution ∼0.4 nm ∼0.25 nm Spectral sampling ∼0.22 nm ∼0.22 nm Footprint size 30×60 km2 320×40 km2 Scanning angles (East to west) −30◦to 30◦ −30◦to 30◦
measured reflectances with those measured by MERIS, also on ENVISAT.
Cloudy pixels are excluded from the data. To identify clouds in SCIAMACHY measurements, we use the SPICI method developed by Krijger et al. (2005) using the PMD measurements. For GOME, an adapted version is used.
As reference surface pressures for validation, the pres-sure profile data from the UKMO Stratospheric Assimilated dataset are combined with the TerrainBase surface elevation database. The UKMO dataset has a spatial resolution of 2.5×3.75◦ and the grid-box containing the centre of the
in-strument footprint is taken. The TerrainBase data has a res-olution of 5×5 arc-minutes and is averaged over the instru-ment footprint. To calculate the absorption cross-sections, the temperature profiles are taken from the UKMO dataset.
Table 3. Mean and standard deviation of the retrieved wavelength
shifts 1λ and response function parameters a0.
mean standard deviation
1λ −0.0772 nm 0.00115 nm
a0 1.09573 0.0356539
4.2 Retrieval results
First, SCIAMACHY and GOME measurements above south-ern Europe and northsouth-ern Africa on 23 January 2003 are anal-ysed. False colour images of the data used are shown in Fig. 5. In SCIAMACHY, Nadir and Limb measurements are alternated. Since for this study only Nadir measurements are used, the SCIAMACHY orbits are broken up into sev-eral blocks, gensev-erally referred to as states. The solar zenith angles and relative azimuth angles for these data range from about 40–60◦and 30–60◦, respectively.
To retrieve apparent surface pressures from SCIAMACHY measurements, the state vector x (Eq. 1) contains (1) the sur-face pressure, (2) the sursur-face albedo at 756 nm, (3) the lin-ear spectral dependence of the surface albedo, (4) a wave-length shift 1λ and (5) the response function parameter a0
(see Eq. 4). The instrument parameters (4 and 5) did not sig-nificantly interfere with the other retrieved parameters and are very similar for each retrieval. The mean and standard deviation of the instrument parameters retrieved are given in Table 3.
Figure 6 shows the absolute differences between retrieved apparent surface pressures and the reference surface pres-sures (1P =Preference−Papparent). Figure 7 shows 1P as a
function of the retrieved surface albedo. Much variation is seen, ranging from 1P =−60 to 300 hPa. Clearly, systematic differences are seen between retrievals above land and sea, i.e. high and low surface albedos. In general, 1P is positive for albedos lower than 0.1 and negative for higher surface albedos. The few low surface pressures retrieved above high surface albedos are probably due to clouds not flagged by the cloud filter used.
Also shown in Fig. 7 are results from the simulated mea-surements as presented in Fig. 2, for an aerosol optical thick-ness of 0.1 and 0.3, respectively. The retrieved values match the results from the simulated measurements well for low albedos (<0.1). However, for higher albedos, the retrieved values for 1P are systematically about 20 hPa lower. Sev-eral other aerosol types and height distributions were tried, none of which match these retrievals.
For comparison, surface pressures retrieved from the GOME measurements are shown in Fig. 8. Similar varia-tions as in the SCIAMACHY retrievals of Figs. 6 and 7 are seen. However, the values of 1P are systematically about
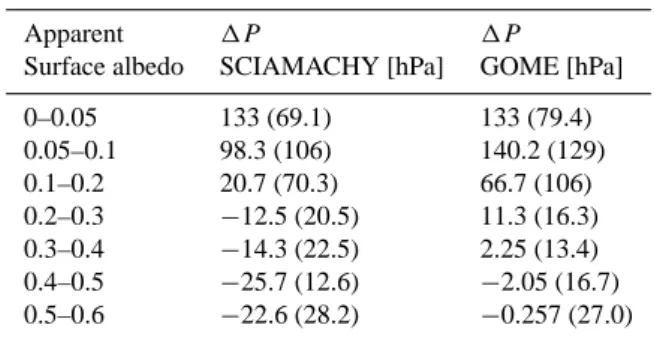
Table 4. Mean values and standard deviations (in brackets) of 1Pretrieved from SCIAMACHY and GOME data of the extended dataset, within several apparent surface albedo bins.
Apparent 1P 1P
Surface albedo SCIAMACHY [hPa] GOME [hPa] 0–0.05 133 (69.1) 133 (79.4) 0.05–0.1 98.3 (106) 140.2 (129) 0.1–0.2 20.7 (70.3) 66.7 (106) 0.2–0.3 −12.5 (20.5) 11.3 (16.3) 0.3–0.4 −14.3 (22.5) 2.25 (13.4) 0.4–0.5 −25.7 (12.6) −2.05 (16.7) 0.5–0.6 −22.6 (28.2) −0.257 (27.0)
20 hPa higher than those retrieved from SCIAMACHY and are more in line with the simulations presented in Sect. 3.
To verify the observed systematic difference in 1P re-trieved by SCIAMACHY and GOME for other data, e.g. for other geometries and geolocations, values of 1P are re-trieved from an extended dataset. This dataset includes all cloud-free measurements in two orbits from 23 August 2002 and two orbits from 23 January 2003, all over Europe, Africa and the South Atlantic Ocean (i.e. orbits 2509, 2510, 4699 an 4700). The solar zenith angles and relative azimuth angles in this dataset range from about 20–80◦and 0–60◦, respectively. Table 4 shows the mean values and standard deviations of
1P retrieved from SCIAMACHY and GOME data, within several apparent surface albedo bins. Above low albedos (<0.2), the standard deviations become large, as expected from the conclusions made in Sect. 3. Therefore, the com-parison between 1P retrieved by SCIAMACHY and GOME is very sensitive to varying atmospheric conditions and ge-ometries. Above moderate and high albedos, on the other hand, values of 1P retrieved by GOME are systematically about 20 hPa higher, confirming the conclusions made above. Thus, it seems likely that the surface pressures retrieved from SCIAMACHY data suffer from a systematic error(s), proba-bly due to a calibration error(s) in the measurements.
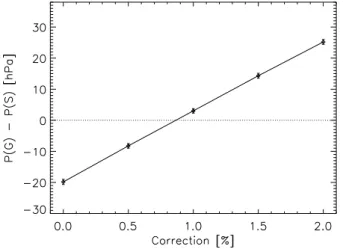
The effect of several SCIAMACHY calibration errors on the retrieved surface pressures is investigated. First, it is found that changing the multiplicative factor applied on the measured reflectances (Acarreta et al., 2004, see Sect. 4.1) only minimally affects the retrieved surface pressure. The reason for this is that the relative depth of the Oxygen A band contains the surface pressure information. On the other hand, the retrieved surface pressures are affected when an offset is added to the measured reflectances. To determine a suitable calibration correction for SCIAMACHY, apparent surface pressures are retrieved from the SCIAMACHY measure-ments on which several offsets are applied. The offsets are defined as a percentage of the continuum reflectance around 756 nm, after multiplication by 1.2. Figure 9 compares, for
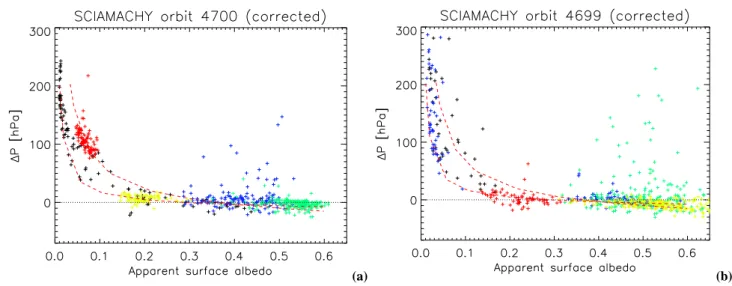
(a) (b)
Fig. 7. 1P as a function of apparent surface albedo for SCIAMACHY orbits 4700 (left) and 4699 (right). Results from the 5 individual
SCIAMACHY states per orbit, as seen in Fig. 6, are colour-coded in black, blue, green, yellow and red going from north to south. Two results from simulated measurements for atmospheres with aerosol optical thicknesses of 0.1 and 0.3, as presented in Fig. 2, are plotted with dashed lines.
(a) (b)
Fig. 8. 1P retrieved by the GOME instrument, as a map-projection (a) and as function of apparent surface albedo (b), similar to Figs. 6 and
7, respectively.
each applied offset, the mean surface pressure retrieved from SCIAMACHY with the corresponding mean surface pres-sure retrieved from GOME. For this, the extended dataset described above is used. GOME ground pixels are larger than those of SCIAMACHY and do not overlap perfectly. Therefore, surface pressures and apparent surface albedos re-trieved from SCIAMACHY ground pixels with their centre within a GOME ground pixel are averaged. Furthermore, SCIAMACHY and GOME observations with apparent sur-face albedos differing more than 2% are rejected. Because the 1P retrieved by SCIAMACHY and GOME above low albedos is very sensitive to varying atmospheric conditions
and sampling effects (see Sect. 3), only observations with apparent surface albedos above 0.1 are used in this analysis. From Fig. 9 it follows that the difference in retrieved appar-ent surface pressure between SCIAMACHY and GOME de-pends linearly on the applied offset. An offset of 0.86% of the continuum reflectance around 756 nm needs to be added to the SCIAMACHY Oxygen A band reflectance measure-ments, so that the retrieved surface pressures agree with those retrieved from the GOME data. Figure 10 shows 1P as a function of surface albedo when this correction is applied. With this correction, the retrievals behave as expected from the study presented in Sect. 3 and compare well with the
Fig. 9. The mean of the difference in apparent surface pressures
retrieved from co-located SCIAMACHY and GOME observations as a function of the correction applied to the SCIAMACHY data. The error bars represent the standard deviation of the mean. Sur-face pressures and surSur-face albedos retrieved from SCIAMACHY pixels with their centre within a GOME ground pixel are averaged. SCIAMACHY and GOME observations with apparent surface albe-dos below 0.1 or differing more than 2% are rejected. In total, 100 observations are compared.
GOME retrievals shown in Fig. 8b. The offset found is prob-ably related to the inaccuracies in the reflectance calibration (Acarreta et al., 2004; No¨el, 2004; Lichtenberg et al., 2005). The different colours in Fig. 10 correspond to different SCIAMACHY states, i.e. different geolocations (see Figs. 6 and 7). Significant differences in the retrieved values of 1P between states are seen. Because all states have approxi-mately similar geometries, it is likely that these differences are due to the varying aerosol optical thickness, as follows from Fig. 2. In particular, the retrievals from data from the most northern state of orbit 4700 (in black) match well with results from simulated measurements corresponding to an aerosol optical thickness of 0.05–0.2, while the most south-ern state of orbit 4700 (in red) matches better with results from simulated measurements for an aerosol optical thick-ness of 0.2–0.6. This increase in aerosol optical thickthick-ness at the location of the most southern state is confirmed by the aerosol optical thickness retrieved by the MISR instrument on EOS Terra (Diner et al., 2001) on the same day, as shown in Fig. 11. However, the absolute values of the MISR opti-cal thicknesses do not match those derived from Fig. 10. As is illustrated in Fig. 2b, this can be due to an incorrect as-sumption about the aerosol height distribution in our forward model. Also, the true aerosol type can be different than the one assumed. Furthermore, the MISR optical thicknesses are given at a wavelength of 558 nm, while we use a wavelength of 765 nm. However, our results are in qualitative agreement with the aerosol optical thickness retrievals from MISR.
4.3 Spectral fitting residuals
A closer inspection of the spectral fitting residuals yields valuable information. Figure 12 shows residuals from a SCIAMACHY and a GOME measurement above approxi-mately the same location with an apparent surface albedo of ∼0.16. The residuals are very much alike. Also shown is a residual from a simulated measurement similar to those shown in Fig. 3. The residual from the simulated measure-ment is very similar to those from the real SCIAMACHY and GOME measurements. This confirms that the spectral fitting residuals are for a large part caused by neglecting aerosols in our retrieval.
However, also some high frequency scatter of about 2–5% is seen in the residuals from the SCIAMACHY and GOME measurements, which are not observed in the simulations and can thus not be caused by neglecting aerosols in the retrieval. Again these features are very common in all our spectral fitting residuals. They might be due to errors in the spec-troscopy data (Chance, 1997; Rothman et al., 2003, 2005) or the instrument response functions. Furthermore, solar Fraun-hofer lines (e.g. at 766.5 nm) could appear in the reflectances due to calibration errors.
5 Conclusions and discussion
In this paper we have presented surface pressure retrievals from cloud-free SCIAMACHY Oxygen A band measure-ments. The retrievals have been performed using a radia-tive transfer model that fully includes multiple Rayleigh scat-tering and polarisation but does not include the effect of aerosols. Using synthetic measurements, the effects of ne-glecting aerosols on the retrieved surface pressures have been investigated. It was found that for low and moderate surface albedos, aerosols lead to an underestimation of the retrieved surface pressures due to a reduction of the light path. For high surface albedos, scattering by aerosols leads to an en-hancement of the light path and thus to an overestimation of the surface pressure. The magnitude of these effects de-pends on aerosol optical thickness, the aerosol height distri-bution and the geometry. Variations in these parameters re-sult in expected ranges in retrieved surface pressures of about 30 hPa above high surface albedos and about 300 hPa above low surface albedos. It has also been observed that aerosols cause a characteristic spectral feature in the fitting residuals, of which the amplitude depends on the aerosol optical thick-ness and height distribution as well.
The apparent surface pressures retrieved from SCIA-MACHY have been validated with reference surface pres-sures from the UKMO meteorological dataset. The differ-ence between the SCIAMACHY apparent surface pressures and the reference surface pressures shows a dependence on surface albedo that can be explained by the fact that aerosols are neglected in the retrieval. However, also a systematic
(a) (b)
Fig. 10. Same as Fig. 7, but when the SCIAMACHY reflectances are corrected by adding an offset of 0.86% of the continuum reflectance to
the reflectances.
Fig. 11. Aerosol optical thicknesses at 558 nm retrieved using the
MISR instrument on EOS Terra on 23 January 2003. Data from MISR orbits 16486 (west) and 16485 (east) are shown. These data were obtained from the NASA Langley Research Centre Atmo-spheric Sciences Data Centre. The contours of the SCIAMACHY states are indicated in red.
offset of about 20 hPa was observed that cannot be ex-plained by the effect of aerosols. The same offset was found by comparing the surface pressures retrieved from SCIA-MACHY with surface pressures retrieved from co-located GOME measurements. This indicates the presence of a cal-ibration error in the SCIAMACHY measurements. Adding an offset of 0.86% of the continuum reflectance at 756 nm to the SCIAMACHY reflectance measurements removes this systematic bias. This offset has been determined by compar-ing the surface pressures retrieved from SCIAMACHY mea-surements, on which several offsets are applied, with those
Fig. 12. Residuals of spectral fits of a SCIAMACHY (black) and a GOME (red) Oxygen A band measurement with a nadir viewing geometry and a solar zenith angle of approximately 40◦. Both measurements are taken at approximately 13◦latitude and
−10◦longitude and have an apparent surface albedo of ∼0.16. Note that on the SCIAMACHY measurements the correction suggested in Sect. 4.2 is applied. In blue, a residual from a simulated SCIA-MACHY measurement, similar to those in Fig. 3, is shown. For this, an atmosphere including aerosols with an optical depth of 0.45 and a layer top of 8 km (see Fig. 2) is taken. The true surface pres-sure and apparent surface albedo are similar to those in the SCIA-MACHY and GOME measurements.
retrieved form co-located GOME measurements. The fitting residuals observed for the SCIAMACHY and GOME mea-surements are very similar and both show the characteristic spectral features due to neglecting aerosols in the retrieval, as were also found in the study using synthetic measurements.
The clear dependence of both the retrieved surface pres-sure and the spectral fitting residuals on the aerosol optical thickness and height distribution, as shown in this paper, in-dicates that both parameters may be retrieved from Oxygen A band measurements, when one assumes the surface pressure as known. This was previously demonstrated by Koppers et al. (1997).
For similar retrievals of total columns of other species than O2, e.g. H2O, CO, CO2 and CH4, similar effects due
to aerosols as discussed in this paper, i.e. under- or over-estimation of the total column, can be expected (Dubuisson et al., 2004; Houweling et al., 2005). The retrieved total col-umn of these species are often scaled to oxygen to correct for the light path (No¨el et al., 1999; O’Brien and Rayner, 2002; Kuang et al., 2002; Dufour et al., 2004) or to obtain volume mixing ratios of the species (Buchwitz et al., 2005a,b). As pointed out by O’Brien and Rayner (2002), the light paths are affected by the height distribution and optical thickness of the absorption lines of individual species, which needs to be considered when applying such a scaling. Indeed, comparing the results shown in Fig. 2 with those presented by Houwel-ing et al. (2005, Fig. 4a), it is apparent that aerosols impact the retrieval of CO2and O2differently. Furthermore, results
shown in this paper imply that care must be taken when using the Oxygen A band for scaling of retrievals at other wave-lengths, because the effects of aerosols are shown to depend significantly on surface albedo, which is spectral dependent. Additionally, the optical thickness of Rayleigh scattering and therewith its relative contribution to the total scattering varies with wavelength as well. These problems can be avoided by retrieving aerosol properties simultaneously with the total column of the trace gas, the surface albedos and the surface pressure (Kuang et al., 2002).
To conclude, this paper shows that surface pressure re-trievals can be used to validate the calibration of the Oxygen A band measurements. This approach could also be used to validate the calibration of the SCIAMACHY measurements of other oxygen bands, i.e. O2B and γ and O4bands.
Acknowledgements. SCIAMACHY and GOME data were provided by ESA. The SCIAMACHY data were processed using SCIA PATCH NL1, available at http://www.sron.nl/∼hees/SciaDC.
The MISR data were obtained from the NASA Langley Research Center Atmospheric Sciences Data Center. Part of this work was supported by the Dutch User Support Programme 2001–2005 (USP) under project number EO-069.
Edited by: H. Kelder
References
Acarreta, J. R. and Stammes, P.: Calibration comparison between SCIAMACHY and MERIS on board ENVISAT, IEEE Geosci., 2, 31–35, 2005.
Acarreta, J. R., Stammes, P., and Tilstra, L. G.: Reflectance Comparison Between SCIAMACHY and MERIS, in: ESA SP-562: Atmospheric Chemistry Validation of ENVISAT (ACVE-2), 2004.
Barton, I. J. and Scott, J. C.: Remote measurements of surface pres-sure using absorption in the Oxygen A band, Appl. Optics, 25, 3502–3507, 1986.
Bovensmann, H., Burrows, J. P., Buchwitz, M., Frerick, J., Noel, S., Rozanov, V. V., Chance, K. V., and Goede, A. P. H.: SCIA-MACHY: Mission objectives and measurement modes, J. Atmos. Sci., 56, 127–150, 1999.
Br´eon, F.-M. and Bouffi´es, S.: Land Surface Pressure Estimate from Measurements in the Oxygen A Absorption Band, J. Appl. Met., 35, 69–77, 1996.
Buchwitz, M., de Beek, R., Burrows, J. P., Bovensmann, H., Warneke, T., Notholt, J., Meirink, J. F., Goede, A. P. H., Bergam-aschi, P., K¨orner, S., Heimann, M., and Schulz, A.: Atmospheric methane and carbon dioxide from SCIAMACHY satellite data: initial comparison with chemistry and transport models, Atmos. Chem. Phys., 5, 941–962, 2005a,
SRef-ID: 1680-7324/acp/2005-5-941.
Buchwitz, M., de Beek, R., No¨el, S., Burrows, J. P., Bovensmann, H., Bremer, H., Bergamaschi, P., K¨orner, S., and Heimann, M.: Carbon monoxide, methane and carbon dioxide columns re-trieved from SCIAMACHY by WFM-DOAS: year 2003 initial data set, Atmos. Chem. Phys. Discuss., 5, 1943–1971, 2005b,
SRef-ID: 1680-7375/acpd/2005-5-1943.
Burrows, J. P., Weber, M., Buchwitz, M., Rozanov, V., Ladst¨atter-Weißenmayer, A., Richter, A., Debeek, R., Hoogen, R., Bramst-edt, K., Eichmann, K., Eisinger, M., and Perner, D.: The Global Ozone Monitoring Experiment (GOME): Mission Concept and First Scientific Results, J. Atmos. Sci., 56, 151–175, 1999. Chance, K.: Improvement of the O2A band spectroscopic database
for satellite-based cloud detection, J. Quant. Spectrosc. Radiat. Transfer, 58, 375–378, 1997.
Diner, D., Abdou, W., Ackerman, T., Crean, K., Gordon, H., Kahn, R., Martonchik, J., McMuldroch, S., Paradise, S., Pinty, B., Ver-straete, M., Wang, M., and West, R.: Level 2 Aerosol Retrieval, ATBD-MISR-09, 2001.
Dubuisson, P., Borde, R., Schmechtig, C., and Santer, R.: Sur-face pressure estimates from satellite data in the Oxygen A-band: Applications to the MOS sensor over land, J. Geophys. Res., 106(D21), 27 277–27 286, 2001.
Dubuisson, P., Dessailly, D., Vesperini, M., and Frouin, R.: Wa-ter vapor retrieval over ocean using near-infrared radiometry, J. Geophys. Res., 109, D19106, doi:10.1029/2004JD004516, 2004. Dufour, E., Br´eon, F.-M., and Peylin, P.: CO2 column averaged mixing ratio from inversion of ground-based solar spectra, J. Geophys. Res., 109, D09304, doi:10.1029/2003JD004469, 2004. Hasekamp, O. P. and Landgraf, J.: A linearized vector radiative transfer model for atmospheric trace gas retrieval, J. Quant. Spec-trosc. Radiat. Transfer, 75, 221–238, 2002.
Hasekamp, O. P., Landgraf, J., and van Oss, R.: The need of polarization modeling for ozone profile retrieval from backscattered sunlight, J. Geophys. Res., 107(D23), 4692, doi:10.1029/2002JD002387, 2002.
Houweling, S., Hartmann, W., Aben, I., Schrijver, J., Skidmore, J., Roelofs, G.-J., and Br´eon, F.-M.: Evidence of systematic errors in SCIAMACHY-observed CO2 due to aerosols, Atmos. Chem. Phys. Discuss., 5, 3313–3340, 2005,
SRef-ID: 1680-7375/acpd/2005-5-3313.
Koelemeijer, R. B. A., Stammes, P., Hovenier, J. W., and de Haan, J. F.: A fast method for retrieval of cloud parameters using Oxygen A band measurements from the Global Ozone Monitoring Experiment, J. Geophys. Res., 106(D4), 3475–3490, doi:10.1029/2000JD900657, 2001.
Koppers, G. A. A., Jansson, J., and Murtagh, D. P.: Aerosal optical thickness retrieval from GOME satellite data in the Oxygen A band, in: ESA SP-414: Third ERS Symposium on Space at the service of our Environment, 693–696, 1997.
Krijger, J., Aben, I. and Schrijver, H.: Distinction between clouds and ice/snow covered surfaces in the identification of cloud-free observations using SCIAMACHY PMDs, Atmos. Chem. Phys. Discuss., 5, 815–845, 2005,
SRef-ID: 1680-7375/acpd/2005-5-815.
Kuang, Z., Margolis, J., Toon, G., Crisp, D., and Yung, Y.: Space-borne measurements of atmospheric CO2 by high-resolution
NIR spectrometry of reflected sunlight: An introductory study, Geophys. Res. Lett., 29(15), 1716, doi:10.1029/2001GL014298, 2002.
Lichtenberg, G., and The SCIAMACHY Calibration Team: SCIA-MACHY Level1 data: Calibration concept and in-flight calibra-tion, Atmos. Chem. Phys. Discuss., in press, 2005.
No¨el, S.: Determination of correction factors for SCIAMACHY radiances and irradiances, Technical Report IFE-SCIA-SN-20040514, University of Bremen, Germany, 2004.
No¨el, S., Buchwitz, M., Bovensmann, H., Hoogen, R., and Bur-rows, J. P.: Atmospheric water vapor amounts retrieved from GOME satellite data, Geophys. Res. Lett., 26, 1841–1844, 1999. O’Brien, D. M. and Rayner, P. J.: Global observations of the car-bon budget, 2, CO2column from differential absorption of
re-flected sunlight in the 1.61 µm band of CO2, J. Geophys. Res.,
107(D18), 4354, doi:10.1029/2001JD000617, 2002.
Ramon, D., Santer, R., Dilligeard, E., Jolivet, D., and Vidot, J.: MERIS Land Products Validation, in: ESA SP-549: Proceedings of MERIS User Workshop, 10.1, 2004.
Rothman, L. S., Barbe, A., Benner, D. C., Brown, L. R., Camy-Peyret, C., Carleer, M. R., Chance, K., Clerbaux, C., Dana, V., Devi, V. M., Fayt, A., Flaud, J.-M., Gamache, R. R., Goldman, A., Jacquemart, D., Jucks, K. W., Lafferty, W. J., Mandin, J.-Y., Massie, S. T., Nemtchinov, V., Newnham, D. A., Perrin, A., Rins-land, C. P., Schroeder, J., Smith, K. M., Smith, M. A. H., Tang, K., Toth, R. A., Vander Auwera, J., Varanasi, P., and Yoshino, K.: The HITRAN molecular spectroscopic database: edition of 2000 including updates through 2001, J. Quant. Spectrosc. Ra-diat. Transfer, 82, 5–44, 2003.
Rothman, L. S., Jacquemart, D., Barbe, A., Benner, D. C., Birk, M., Brown, L. R., Carleer, M. R., Chackerian, Jr., C., Chance, K., Coudert, L., Dana, V., Devi, V. M., Flaud, J. M., Gamache, R. R., Goldman, A., Hartmann, J. M., Jucks, K. W., Maki, A. G., Mandin, J. Y., Massie, S. T., Orphal, J., Perrin, A., Rinsland, C. P., Smith, M. A. H., Tennyson, J., Tolchenov, R. N., Toth, R. A., Vander Auwera, J., Varanasi, P., and Wagner, G.: The HI-TRAN 2004 molecular spectroscopic database, J. Quant. Spec-trosc. Radiat. Transfer, in press, 2005.
Rozanov, V. V. and Kokhanovsky, A. A.: Semianalytical cloud re-trieval algorithm as applied to the cloud top altitude and the cloud geometrical thickness determination from top-of-atmosphere re-flectance measurements in the Oxygen A band, J. Geophys. Res., 109(D5), D05202, doi:10.1029/2003JD004104, 2004.
Schutgens, N. A. J. and Stammes, P.: A novel approach to the polar-ization correction of spaceborne spectrometers, J. Geophys. Res., 108(D7), 4229, doi:10.1029/2002JD002736, 2003.
Stam, D. M., De Haan, J. F., Hovenier, J. W., and Aben, I.: De-tecting radiances in the O2A band using polarization-sensitive
satellite instruments with application to the Global Ozone Mon-itoring Experiment, J. Geophys. Res., 105(D17), 22 379–22 392, 2000.
Torres, O., Decea, R., Veefkind, P., and de Leeuw, G.: OMI aerosol Retrieval Algorithm, ATBD-OMI-03, 2001.
Vanbauce, C., Buriez, J. C., Parol, F., Bonnel, B., S`eze, G., and Couvert, P.: Apparent pressure derived from ADEOS-POLDER observations in the Oxygen A-band over ocean, Geophys. Res. Lett., 25, 3159–3162, 1998.