Detection and measurement of total ozone from stellar spectra: Paper 2. Historic data from 1935?1942
11
0
0
Texte intégral
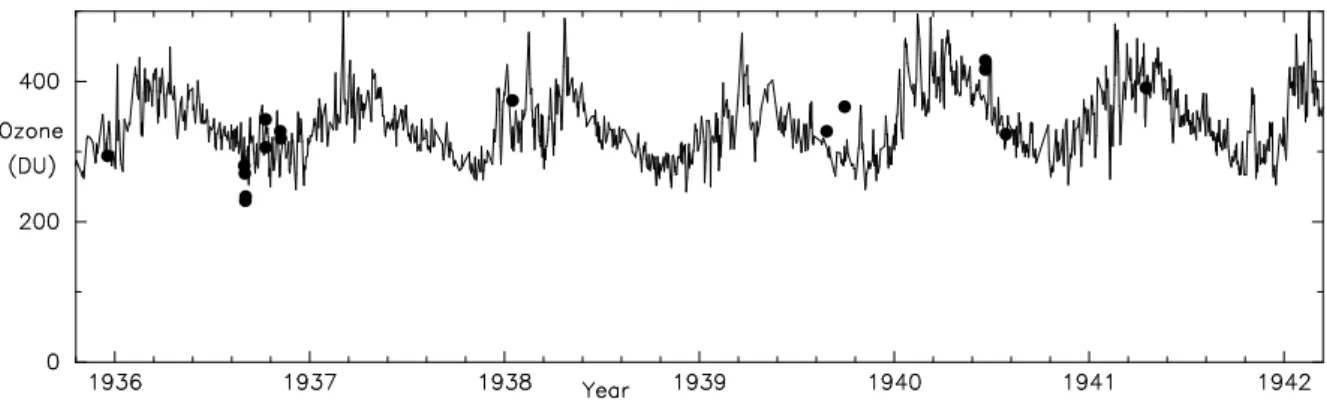
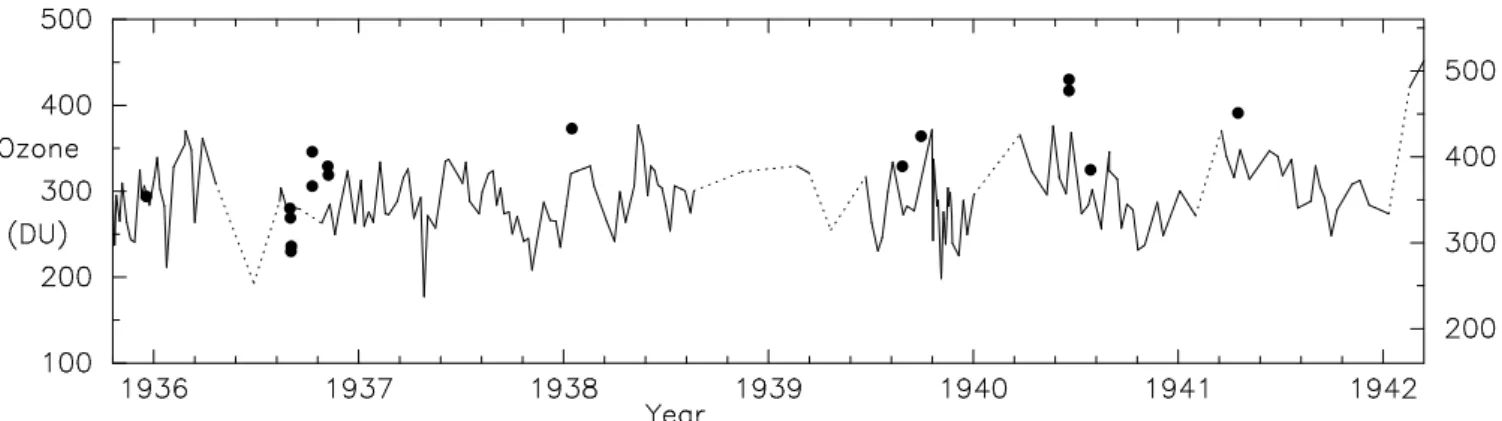
Figure
+3
Documents relatifs