HAL Id: hal-02368234
https://hal.archives-ouvertes.fr/hal-02368234
Submitted on 21 Jul 2020HAL is a multi-disciplinary open access
archive for the deposit and dissemination of sci-entific research documents, whether they are pub-lished or not. The documents may come from teaching and research institutions in France or abroad, or from public or private research centers.
L’archive ouverte pluridisciplinaire HAL, est destinée au dépôt et à la diffusion de documents scientifiques de niveau recherche, publiés ou non, émanant des établissements d’enseignement et de recherche français ou étrangers, des laboratoires publics ou privés.
catalysts derived from perovskites
Hilma Fonseca, Nicolas Bion, Florence Epron, Doris Ruiz, Sergio Gustavo
Marchetti, José Fernando Bengoa, Maria Do Carmo Rangel
To cite this version:
Hilma Fonseca, Nicolas Bion, Florence Epron, Doris Ruiz, Sergio Gustavo Marchetti, et al.. Partial oxidation of methane over lanthana-supported catalysts derived from perovskites. Catalysis Today, Elsevier, 2020, 344, pp.212-226. �10.1016/j.cattod.2019.02.010�. �hal-02368234�
TITLE:
Partial oxidation of methane over lanthana-supported catalysts derived from perovskites
AUTHORS:
Hilma C Fonsecaa,b, Nicolas Bionb, Florence Epronb, Doris Ruizc, Sergio Gustavo Marchettid, José Fernando Bengoad and Maria do Carmo Rangela,e*
AFFILIATION:
aInstituto de Química, Universidade Federal da Bahia. Campus Universitário de Ondina, Federação, 40 170-280, Salvador, Bahia, Brazil.
bInstitue de Chimie de Milieux et Matériaux de Poitiers (IC2MP), 4 rue Michek Brunet, TSA 51106, 86073 Potiers CEDEX9, France.
cFacultad de Ciencias Químicas, Universidad de Concepción, Casilla 160-C, Concepción, Chile.
dCentro de Investigación y Desarrollo en Ciencias Aplicadas “Dr. Jorge J. Ronco”-CINDECA (UNLP-CONICET-CICBA). Calle 47 Nº 257, (1900) La Plata, Argentina.
eInstituto de Química, Universidade Federal do Rio Grande do Sul. Av. Bento Gonçalves,
9500, Agronomia, 90650-001 Porto Alegre, RS, Brazil. *E-mail: [email protected]
ABSTRACT
Partial oxidation of methane is the most attractive route to produce syngas, since it produces H2/CO (molar)= 2, suitable for Fischer-Tropsch and methanol synthesis, besides the low energy consumption and low tendency to coke formation. A promising catalyst for the reaction is based on cobalt which has low cost and low tendency to coke formation. However, it tends to oxidize and then deactivates during reaction. With the goal of preparing alternative and more efficient catalysts, lanthana-supported catalysts derived from perovskites containing lanthanum, iron and cobalt were studied in this work, using titania as support. Perovskites were prepared by the amorphous citrate method and then reduced to produce the catalysts. The samples were characterized by X-ray diffraction, Mössbauer, temperature programmed reduction, acidity measurements using ammonia temperature programmed desorption, transmission electron micrographs, specific surface area measurements and isotopic exchange reaction. The catalysts were evaluated at 1 atm and 800 oC in methane partial oxidation and analyzed by temperature programmed oxidation after reaction. Iron-based perovskite (LaFeO3) was not reduced regardless the support while cobalt-based perovskite (LaCoO3) produced cobalt oxides (Co3O4 and CoO), metallic cobalt and lanthanum oxide (La2O3). It was found that both titania and iron are beneficial to make cobalt reduction easier, producing more active and stable catalysts. At the end of reaction, the catalyst derived from cobalt-based perovskite (LaCoO3/TiO2) was the most active and selective, the activity and selectivity increasing during reaction. However, the supported catalyst based on iron and cobalt (LaFe0.5Co0.5O3/TiO2) is the most promising for industrial applications since it is highly active and selective since the beginning of reaction. The catalysts produced a negligible amount of coke during reaction.
1. INTRODUCTION
Although natural gas is known as a fossil resource, it is currently the most used feedstock to produce commercial hydrogen and synthesis gas or syngas (a mixture of hydrogen and carbon monoxide). Its large utilization is related to the great reserves in the world, besides the shale gas development in last decade, mainly in North America. This increased assessment of resources producible at low cost renewed the interest for the use of natural gas, which is expected to expand in the future [1]. However, the largest deposits of natural gas worldwide are located in remote areas, which are frequently far from the markets. Since it should be transported across large distances, it is more convenient to convert natural gas to more easily transportable liquids. Therefore, natural gas is first converted to syngas, which is subsequently transformed to liquid hydrocarbons by Fischer-Tropsch synthesis. Methane, the main component of natural gas, can also be obtained from the conversion or fermentation of biomass [2, 3]. The methane conversion to produce hydrogen or synthesis gas is thus a promising technology to contribute to a carbon-neutral energy chain in the future.
Different types of reforming processes are commercially available to produce hydrogen and syngas, such as steam reforming, dry reforming, partial oxidation of methane and their combination (autothermal reforming) [4-8]. These processes differ mainly by the compound that reacts with the hydrocarbon, which can be either steam (steam reforming), oxygen (partial oxidation) or both (autothermal reforming), besides carbon monoxide (dry reforming). During theseprocesses, the reaction occurs over an appropriated catalyst to produce hydrogen and carbon monoxide. Among these possibilities, the catalytic partial oxidation of methane is the most convenient route to produce synthesis gas because it can produce the hydrogen to carbon monoxide molar ratio of 2 which is suitable for Fischer-Tropsch reaction [9]. Partial oxidation of methane has other advantages, such as lower
energy consumption than steam reforming due to the exothermic reaction and lower tendency to coke formation due to oxygen [10].
Several kinds of catalysts have been evaluated in the partial oxidation of methane, showing activity and selectivity to synthesis gas and hydrogen. Noble and non-noble metals of group VIII (iron, cobalt, nickel, ruthenium, iridium, silver, rhodium and palladium) [11-18] were found to be active and selective. In addition, several authors [13, 17] have found that nickel-based catalysts are very attractive, due to its low cost in combination with high activity and selectivity to hydrogen in partial oxidation of methane, this last being assigned to its redox properties. However, these catalysts deactivate during reaction due to coke deposition on the surface [19, 20]. Furthermore, noble metals show high resistance against coke but have a high cost, which is an obstacle to their wide application [21, 22]. On the other hand, cobalt-based catalysts have low cost and show greater resistance to coke deposition and then may be considered a promising catalyst. Although they have presented low activity, cobalt performance strongly depends on the preparation method and on the kind of support [9, 17, 23-25]. Among the supports, titanium oxide (TiO2) has been widely studied due to its high chemical and thermal stability. Several studies [26-28] addressed to catalysts based on rhodium, ruthenium, silver, palladium and others, for partial oxidation of methane, have shown that the particles size and the kind of interaction between the metal nanoparticles and titanium oxide can strongly influence the activity and selectivity.
Since cobalt has a tendency to oxidize, a promoter can be useful to improve its reducibility at lower temperatures. Several bimetallic catalysts using noble metals were thus evaluated such as Co-Pt [29], Co-Ni, Co-Rh, Co-Ru and Co- Pd [30]. They showed higher activity, selectivity and stability than monometallic cobalt-based catalysts, which were related to the easier reduction of cobalt oxide to metallic cobalt which is the active phase of the catalyst [31]. Various oxides (Fe3O4/Cr2O3, La2O3, SnO2 and K2O) were also tested as dopants [30] but only lanthanum oxide has shown a stabilizing effect. In another study [31],
cobalt catalysts doped with oxides of Ni, Fe, Cr, Re, Mn, W, Mo, V and Ta were evaluated in partial oxidation of methane. It was noted that W, Mo, V and Ta decreased the conversion and the selectivity to syngas, due to the low availability of reduced cobalt sites. Iron also showed a negative effect, which was related to heavy carbon formation.
In order to overcome these limitations, there is an increasing interest in the development of alternative catalysts with high stability, activity and resistance to coke formation. An attractive class of catalysts for partial oxidation of methane consists of solids derived from perovskites [11, 32, 33]. During reduction, these solids decompose to produce composites containing finely dispersed particles of transition metals, which are resistant to sintering and carbon deposition [33].
Aiming to prepare alternative and more efficient catalysts to partial oxidation of methane, lanthana-supported catalysts derived from perovskites containing lanthanum, iron and cobalt was studied in this work. Titanium oxide (titania) was used as support. Although iron has been pointed out as a not efficient dopant, it is well known that the preparation method can affect this action [34].
2. EXPERIMENTAL
2.1 Titanium dioxide preparation
For the preparation of titanium dioxide (used as the catalysts support) the sol-gel method [35] with some modifications was used. In this procedure, 15 mL of titanium (IV) isopropoxide (98%) was slowly added to a vessel containing 180 mL of deionized water and 1.8 mL of nitric acid under stirring, at 30 °C. The system was heated at 80 °C, for 30 min and kept under reflux for 2 h, at the same temperature. It was then heated (5 °C min-1) under air flow (80 mL.min-1) up to 400 °C and kept at this temperature, for 5 h. The produced solid was named T sample.
2.2. Perovskite preparation
The supported perovskites were prepared by thermal decomposition of amorphous citrate precursor [8, 11], using concentrated solutions of lanthanum nitrate (La(NO3)3.6H2O), iron nitrate (Fe(NO3)3.9H2O ) and cobalt nitrate (Co(NO3)2.6H2O), besides citric acid as complexing agent. These solutions were transferred to a reactor containing titania in an amount enough to obtain 50 % (w/w) of the support in the final solid. The concentrated solutions were prepared to obtain a La:Fe:Co atomic ratio of 1: (1-x): x, where x is the degree of substitution. The citric acid solution was prepared to have the ratio of citric acid to metals equal to 1 (nA:Co:M = 1 acid). The support dispersion was transferred to a glass reactor and stirred at 40 °C for 1 h to increase the viscosity [36]. The excess water was removed by keeping the system at 70 °C under residual vacuum to produce the perovskite [8, 11]. The precursors were heated (1 °C min-1) in air up to 250 °C, for 1 h and then heated (5 °C min -1) in air up to 600 °C, being kept at this temperature for 4 h. Solids with the nominal composition of LaFe(1-x)CoxO3 (x = 0, 0.5 and 1.0) supported on titanium oxide were obtained. Unsupported perovskites were prepared following the same method but in the absence of titanium oxide. The samples were named F (LaFeO3), C (LaCoO3), FC (LaFe0.5Co0.5O3) and the letter T was used to indicate the presence of titanium oxide.
2.3. Catalysts preparation
The catalysts were obtained by reducing perovskites under a reducing flow (10% H2/He). During the experiments, the perovskite was heated (10 °C min-1) under the reducing flow up to 800 °C and kept at this temperature, for 1 h. The reduced perovskites were identified by the letter R.
2.4. Samples characterization
The X-ray diffraction experiments were performed at room temperature in a Shimadzu XRD-6000 model equipment, using a CuKα radiation (=1.54059 Å) generated at 40 kV and 30 mA and a nickel filter. The diffractograms were registered using a scanning velocity of 2 o min−1 in the range of 10-80 º (2). The crystalline phases of reduced perovskites were identified by X-ray diffraction in the XRD line of LNLS (National Synchrotron Light Laboratory, Brazil) using energy of 8 keV (=1.7712 Ả). The experiments were performed at a scan interval of 10 to 100 degrees and counting of 8 s per point.
Mössbauer spectra were obtained in a spectrometer with 512 channels with constant acceleration and geometry of transmission. A source of 57Co in Rh matrix of nominally 50 mCi was used. The velocity calibration was performed against a 12 μm-thick α-Fe foil. All isomer shifts (δ) mentioned in this paper are referred to this standard. For each component of the spectra, Lorentzians lines of the same width were used. The spectra were obtained at room temperature and folded to minimize geometric effects, being evaluated by a commercial computer fitting program named Recoil. For the reduced samples, perovskites were previously reduced in a stainless steel reactor with two on-off valves. After reduction, the sample was isolated in this atmosphere and the reactor was placed inside a glove box in argonium atmosphere. The catalysts were transferred inside a tightness Mössbauer cell to obtain the spectra without air contact in any step, in order to avoid a possible re-oxidation.
The experiments of temperature programmed reduction (TPR) of the catalysts were performed in a Micromeritics model TPD/TPR 2900 equipment, equipped with thermal conductivity detector (TCD). Samples (0.25 – 0.30 g) were reduced in the range of 30 to 600 oC, at 10 oC min-1, under a 5% H
2/N2 mixture flow. The hydrogen consumption in the experiments was calculated from the area under the peaks, using the calibration curve obtained with a cooper oxide (CuO) standard. The acidity of the samples was determined by ammonia temperature programmed desorption (TPD-NH3) using the same equipment.
The sample (0.05 g) was heated up to 300 oC, under helium flow and cooled to room temperature. It was then heated up to 110 oC under the same gas flow and saturated with ammonia, by the injection through a calibrated loop. The system was heated up to 775 oC, under helium flow, for obtaining the ammonia TPD profile. The acidity was calculated from the areas of the adsorption peaks for ammonia, taking the last peak for calibration.
The transmission electron micrographs (TEM) were obtained in a Jeol JEM 1200 EXII microscope. Each catalyst was ground in an Agatha mortar and dispersed in ethanol. Diluted drops of these dispersions were placed on a 150 mesh copper grid with carbon. The micrographs were obtained in both bright and dark fields.
The specific surface area (Sg) measurements were carried out by physical nitrogen adsorption (BET method). During the experiments, a Micromeritics model AZAP 2020 apparatus was used on 0.3 g of sample, previously heated under vacuum at 200 oC, for 1 h. The isotopic exchange reaction experiments were performed in a recycling closed system, connected to a Pfeiffer Vacuum mass spectrometer. The sample (0.020 g) was placed into a quartz reactor, previously oxidized under oxygen flow (30 mL min-1, 600 °C, 1 h). Then it was evacuated for 30 min, reduced under hydrogen flow (30 mL min-1, 600 °C, 1 h) and then evacuated again, for 30 min. The sample was cooled down to reaction temperature. For temperature-programmed oxygen isotopic exchange experiments, the exchange reaction was followed from 300 °C to 600 °C (2 °C min-1), after introducing 65 mbar dose of pure 18O
2 (≥ 99 at.%, ISOTEC). The masses of 32 (16O2), 34 (18O16O), 36 (18O
2), 44 / 46 (to detect the carbonate presence) and 28 (N2, to detect a possible leak) were continuously monitored by the mass spectrometer.
2.5. Catalytic evaluation
For the catalysts evaluation, a quartz fixed bed reactor (internal diameter= 12 mm) was used. The catalyst (0.060 g) was diluted in silicon carbide (SiC/catalyst= 5.6) to avoid
temperature gradients in the catalyst bed, since the reaction is highly exothermic. Before reaction, the sample was heated (10 °C min-1) under hydrogen (99.99%) flow up to 800 °C and kept at this temperature, for 1 h. The reaction mixture (99.99% methane, 99.99% oxygen and 99.99% nitrogen) was then fed to the reactor. The experiments were carried out using the reagents diluted in nitrogen in a molar ratio of N2:CH4:O2= 4:2:1. The total flow used was 175 mL min-1.
After reaction, the coke deposited on the catalysts was analyzed by temperature programmed oxidation (TPO) in a Micromeritics model TPD/TPR 2900 equipment, equipped with thermal conductivity detector (TCD). Samples (0.10 g) were previously treated at 110
oC, under helium flow and then oxidized in the range of 30 to 1000 oC, at 10 oC min-1, under
a 5% O2/N2 mixture flow.
3. RESULTS AND DISCUSSION
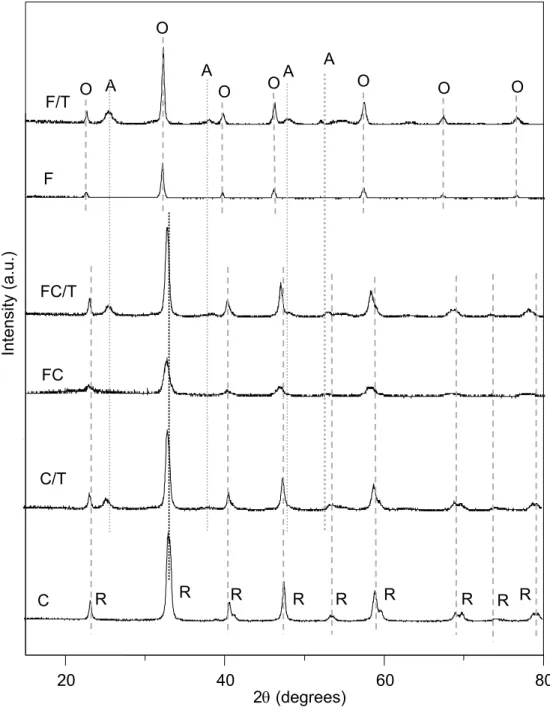
Figure 1a shows the diffractograms of perovskite-type oxides. Only peaks related to perovskite structure were noted for all cases and no other phase (such as other segregated oxides) was identified, except for supported samples. In these cases, the tetragonal anatase phase of titanium oxide (JCPDS 21-1272) was also found. The F and F/T samples showed orthorhombic symmetry structures (ICSD 028255) while the C and C/T samples presented rhombohedral symmetry structures (ICSD 201766). The samples containing both cobalt and iron (FC and FC/T samples) presented rhombohedral structures, regardless the support. In addition, it can be noted that the peaks of FC sample were slightly shifted to lower angles, as compared to those of C sample. This finding can be related to the bigger ionic radius of Fe3+ species (0.064 nm) as compared to Co3+ species (0.061nm), causing an increase in cell parameters, as a result of an expansion of unit cell due to the incorporation of Fe3+ into perovskite lattice.
The diffractograms of perovskites after reduction are shown in Figure 1b. It can be noted that only the orthorhombic structure of iron-based perovskite (ICSD 028255) was found for F and F/T samples. It shows that these perovskites are very stable regardless the support and were not reduced under the experimental conditions used in this work. On the other hand, several phases were produced for the cobalt-containing perovskites, during reduction. For all samples, cubic lanthanum oxide, La2O3 (ICSD 831345); cubic cobalt oxide, Co3O4 (ICSD 011152), hexagonal cobalt oxide, CoO (ICSD 043458) and hexagonal (ICSD 044990) and cubic (ICSD 041507) metallic cobalt were found. For the supported samples, anatase phase was also detected. No iron-containing phase was found in these samples, regardless the support, indicating that cobalt is more reducible than iron in the rhombohedral structure of perovskites. These findings show that Fe3+ species are very stable in both orthorhombic and rhombohedral structures.
Direct evidence about the state oxidation of iron ions can be obtained by Mössbauer spectroscopy. For F sample, the Mössbauer spectrum measured at 298 K (Figure 2) shows only a sextet with relatively narrow absorption lines and hyperfine parameter values typical of octahedrally coordinated Fe3+ ions with high spin configuration in perovskite structure [37]. The hyperfine parameters are presented in Table 1. The sextet with a relatively narrow hyperfine magnetic fields distribution ( 7 kG) indicates that all Fe3+ ions have similar coordination spheres.
The spectrum of FC sample measured at 298 K (Figure 2) shows six lines highly overlapped, a very intense central peak and a curved background. This magnetic behaviour indicates that the sample is near to its magnetic order–disorder transition. Therefore, the curve was fitted using the relaxation model of two states of Blume and Tjön [38]. In the crystalline structure of LaFeO3, eight lanthanum ions occupy the second coordination sphere (nearest cation neighbours) and four other iron ions occupy the next cationic shell (next nearest neighbours). Taking this structure into account, when Fe3+ ions are replaced by Co3+
ions, it would be considered that these cobalt ions randomly substitute the Fe3+ species in four possible positions. Following the model proposed by Russo et al. [39], the probability of an iron atom with “n” total neighbours (in this situation n = 4) have “p” cobalt neighbours (p = 0, 1, 2, 3, 4) is given by a binomial distribution (Eq. 1), where x = 0.5.
n
p
x
p
x
n p
p
n
p
P
1
!
!
!
)
(
(1)Therefore, the population of different surroundings of the central iron atom was obtained and each configuration is characterized by a set of Mössbauer parameters. The populations calculated are: P(0) = 0.0625, P(1) = 0.2500, P(2) = 0.3750, P(3) = 0.2500 and P(4) = 0.0625. Only contributions with probability higher than 10%, defined as relevant, were considered in the fitting. Therefore, P(0) was added to P(1) and P(4) was added to P(3) since they are the closest configurations. Therefore, the spectrum of FC sample was fitted with three relaxing sextets, assignable to three different iron sites with three different number of Co3+ neighbours ions (Table 1) and a doublet corresponding to a superparamagnetic fraction of this compound. In order to assign the different Fe3+ sites, it was considered that a higher number of cobalt ions produce a lower value of magnetic hyperfine field [40]. The existence of magnetic relaxation indicates that the substitution of Fe3+ by Co3+ ions produced a decrease of perovskite crystals size. On the other hand, it is important to remark that it was not necessary to include a singlet assignable to Fe4+ in the fitting procedure. This anomalous high oxidation state of iron ions appears when they are replaced by bivalent ions [39]. We can thus conclude that the Co2+ ions, used in the synthesis process are oxidized to Co3+ during the preparation steps.
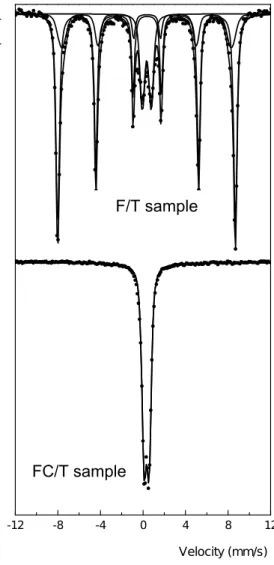
The supported perovskites showed some important structural differences in comparison with the unsupported ones. The Mössbauer spectra and their corresponding hyperfine parameters are shown in Figure 3 and Table 2 respectively. The spectrum of F/T samples at room temperature shows six peaks with their inner side broadened and with a
central doublet. The fitting was performed with two sextuplets and one doublet. The sextuplet with higher hyperfine magnetic field has the same parameters that unsupported LaFeO3. On the other hand, the second sextuplet related to broad signal has the hyperfine magnetic field considerably decreased. Considering that perovskite is produced in the presence of titanium oxide, it would be possible that a fraction of perovskite is produced inside the support (of about 5 nm). This small size would explain the important decrease of the hyperfine magnetic field. The central doublet presents parameters typical of high spin Fe3+ ions, this species being produced by diffusion of these ions inside titanium oxide lattice during the calcination step.
On the other hand, the spectrum of FC/T sample only shown a central doublet. Their parameters are very similar to the doublet of FC sample, previously assigned to superparamagnetic LaFe0.5Co0.5O3. Following the same idea, related to the preparation, some perovskite could be produced inside titanium oxide. However, the presence of high spin Fe3+ ions cannot ruled out because their signal would be completely overlapped by the doublet of LaFe0.5Co0.5O3.
The Mössbauer spectra of reduced F and F/T samples are shown in Figure 4. The spectrum of unsupported perovskite showed only one sextuplet and the hyperfine parameters (Table 3) are nearly identical to the unreduced sample. However, there are same minor differences that can be related to the thermal treatment at 800 °C. The hyperfine magnetic field increase from 516.4 to 522.1 kG. This effect is associated with an increase of particles size due to sintering. In the same way, the wide of the distribution of the magnetic hyperfine field decrease from around 7 to around 3.1 kG. This effect is related to a more homogeneous surrounding of the Fe3+ ions in the LaFeO
3 crystalline structure. Therefore, the high temperature of reduction produced sintering and an increase of crystallinity for LaFeO3. However, no reduced species was detected for this sample.
A very similar behaviour was shown by the supported perovskite (F/T sample) during reduction. After this process, the inner sextuplet disappeared and only one narrow sextet was detected. The hyperfine parameters are identical to F sample and their percentages are equal to the sum of signals assigned to both crystal size fractions in the solid before reduction. Therefore, reduction produced mainly an increase of crystals size and a fraction of Fe3+ ions diffused inside titanium oxide lattice are reduced to Fe2+ ions. Two doublets are detected, assignable to ions located in sites with different symmetry. The signal with higher quadrupole splitting corresponds to sites with more distorted geometry.
The reduction profiles of perovskites are in line with the results of X-ray diffraction and Mössbauer spectroscopy. From Figure 5, one can see that cobalt-based sample (C) exhibited a curve with two peaks, related to cobalt species reduction since La3 + species are not reducible under TPR conditions [5, 7]. The peaks began at around 223 and 461 °C, the low temperature peak being assigned to the reduction of Co3+ to Co2+ species whereas the other one at higher temperatures may be associated with the reduction of Co2+ to Co0 species [11]. The presence of Co+3 species in perovskites was shown by X-ray diffraction and inferred by Mössbauer spectroscopy. The C/T sample exhibited a similar profile but with the first peak beginning at 300 oC and the second one starting at 438 oC. It means that the support delayed the reduction of Co3+ to Co2+ species in perovskite structure but made the reduction of Co2+ to Co0 species easier. This is an important finding since metallic cobalt is the active phase of methane partial oxidation [11, 31]. It can be noted that the hydrogen consumption of supported samples during the experiments (Table 4) was less that the unsupported one. This can be related to the lower amount of reducible species of cobalt and iron in the samples, since 50% w/w correspond to titanium oxide.
On the other hand, the reduction of iron-based sample (F) began at much higher temperature (694 °C), this fact being related to reduction of iron species (Fe3+) in perovskite structure. The supported sample showed a similar profile suggesting that there was no effect
of the support on solids reduction. The hydrogen consumption during the experiments (Table 4) shows that the F and F/T samples are the least reducible solids. Also, it can be noted that very low amounts of perovskite were reduced at temperatures higher than 694 oC. Indeed, some Fe2+ ions were detected in F sample after reduction, by Mössbauer spectroscopy.
From Figure 5 and Table 4, it can be seen that iron increased cobalt reduction, by the two peaks shifted to lower temperatures for FC sample, as compared to F sample. It should be also considered that some Fe3+ species were probably reduced together with Co3+ species. As found in previous works [34, 41], the reduction of Fe3+ species occurs in the range of 250 to 450 oC, depending on the solid. The support shifted the first peak to even lower temperatures, indicating that the reduction of Co2+ to Co0 species was easier. The peak at around 600 oC can also be assigned to the reduction of Fe2+ to Fe0 species [34, 41] simultaneously with the reduction of Co2+ to Co0 species. The broad peak at temperatures higher than 700 oC is assigned to the reduction of Fe2+ to Fe0 [34, 41]. The hydrogen consumption during the experiments (Table 1) shows that the iron and cobalt-based species consumed less hydrogen than cobalt-based ones, a fact that can be related to the reducibility of iron in perovskite structure.
The particles size distribution and the average particles size of perovskites are shown in Figure 6 and the TEM images are illustrated in Figure 7. The biggest particles were shown by F sample, with an average value of 36.7 nm and particles ranging from 10 to 80 nm. As expected, the support decreased the average particle size and narrowed the particles size distribution, as shown in the histogram of F/T sample and in Figures 7a and 7b. In this case, the average particle size decreased to 15.7 nm and the distribution was shifted to lower values (10-35 nm). This finding is in accordance with the Mössbauer spectra. The FC sample showed the distribution shifted to lower values (10-50 nm) and lower average size (21,5 nm) as compared to F sample (Figure 7a and 7c), indicating the role of cobalt in decreasing
the particles size, as concluded by Mössbauer spectroscopy. The FC/T sample showed an average particle size smaller than the FC sample (Figure 7c and 7d) but the distribution was clearly shifted to lower values indicating that the support increased the population of small particles, in agreement with the results of Mössbauer spectroscopy. The C sample showed an average particle diameter slightly lower than F sample but much higher than the FC sample, showing the role of iron in decreasing the particles sizes of cobalt-based perovskites. The support slightly shifted the distribution to lower values, as illustrated in Figure 7e and 7f.
The particles size distribution and the average particle size of reduced perovskites also changed with the composition as shown in Figure 8, while the TEM images are illustrated in Figure 9. F sample shows the biggest average diameter (58.4 nm) and particles ranging from 10 to 180 nm. As expected, the support decreased the average particle size and narrowed the particles size distribution, as shown in the histogram of F/T sample. It can be noted that titania decreased the average particle size to 23.2 nm and the distribution was shifted lower values (10-50 nm). As found for unreduced perovskites, cobalt led to a decrease of average particle size and a shift of distribution to smaller particles (Figures 9a and 9c) and titania caused a decrease in particles size (Figures 9c and 9d). The comparison of the iron-containing samples shows that reduction led to an increase of particles, in accordance with the conclusions from Mössbauer spectroscopy. However, an opposite effect was noted for the C and C/T samples for which titanium oxide caused an increase of particles size from 14.1 nm (C) to 25.2 nm (C/T) and a shift of the distribution to bigger particles. In addition, these reduced sample showed smaller particles than the unreduced ones. These findings can be related to the different phase transitions that occurred during reduction. As shown by hydrogen consumption during TPR experiments (Table 4) the C sample was the most reduced sample. The lowest average value was shown by the C-R sample whereas the biggest one was shown by the F-R sample (Figure 7a and 7c).
The specific surface areas of perovskites are shown in Table 5. The unsupported samples showed low values ranging from 10 to 15 m2 g-1, which are typical of perovskites [8, 11]. The C sample showed the highest value while the F sample showed the lowest one. As expected, the supported perovskites showed higher specific surface areas than unsupported ones, due to the contribution of the support. Pure titanium oxide presented the highest value (162 m².g-1), which is characteristic of anatase phase, in agreement with the results of X-ray diffraction. This high specific surface area is related with the presence of mesopores, as found by a type IV isotherm (not shown). Table 5 also shows the specific surface area of perovskite after reduction. We can observe that the values increased during reduction due to the transformation of perovskites in lanthanum oxide, cobalt oxide and metallic cobalt, as shown by X-ray diffraction. The supported catalysts showed the highest values, as expected. These results are in agreement with the particles size distribution obtained by TEM.
Figure 10a shows the total number of atoms exchanged as a function of temperature up to 700 °C. F and F/T samples showed activation temperatures at about 300 and 350 °C, respectively. On the other hand, C and C/T samples showed values at 220 and 250 °C. This decrease is due to the high reducibility of cobalt species in perovskite structure. FC sample presented an activation temperature similar to C sample. The difference in oxygen mobility in solids can be better explained by the evolution of the rate of change as a function of temperature (Figure 10b). The lower the maximum speed temperature, the greater the number of mobile oxygen atoms in the solid. We can note that all samples exhibited two maximum speeds with different activation energies. The first occurred at lower temperatures, due to oxygen species on the surface while the second one, at higher temperatures, can be related to oxygen species in the lattice. The C and LC samples showed the lowest activation temperatures in the first region. It can be also noted that the support increased the velocity of exchange in the first region, which may be associated with the
reducibility of the support. In high temperature region, FC sample showed slightly higher temperature, while C sample showed the highest maximum velocity (1.01 x 10¹⁸ atm.g-1.s -1).
The values of methane conversion as a function of time over reduced perovskites during partial oxidation are shown in Figure 11a. All catalysts were active in the reaction, in the experimental conditions of this work, leading to conversions in the range of 8 to 35 % in the beginning of reaction. The F sample led to the lowest conversion which decreased even more during reaction, this being related to the difficulty of Fe3+ species to be reduced in perovskite structure. As shown by X-ray diffraction, Mössbauer spectroscopy and TPR experiments, most of this sample remained unreduced. The support slightly increased methane conversion, in accordance with previous work [26-28], this being related to the decrease of particles size, as shown by TEM. The stability of the catalyst was also improved by titanium oxide. In the beginning of reaction, C sample also led to low conversion, which was close to F sample. However, the conversion increased continuously during reaction and achieved values higher than 35 %. This behavior suggests that cobalt oxides, identified by X-ray diffraction, were continuously reduced to produce metallic cobalt during reaction. However, C/T sample led to high conversions since the beginning and increased even more during reaction, probably due to the role of titania in making the reduction of Co2+ species easier, as found by TPR. In addition, it should be noted that the active sites of C/T sample were much more active than the sites of C sample, since 50% of C/T sample is made of titanium oxide. FC sample led to similar conversion that C/T sample, in the beginning and slightly increased with time showing stability during reaction. On the other hand, FC/T sample showed low values of conversion since the beginning and were kept stable during reaction. It would be expected that FC/T sample would be more active than FC sample, since titania made cobalt reduction easier and decreased the particles sizes. However, Figure 11a showed that an opposite behavior occurred, a fact that can be associated to the
different amounts of phases in each sample, generating less metallic iron in the supported sample. From these results and as well as from the characterization results, it can be concluded that both iron and the support improved the activity of cobalt sites, as well as the stability of the catalyst.
The particles size changed during reaction, as we can see by comparing Figures 8 and 9 and Figures 12 and 13. It can be noted different behaviors depending on the catalyst composition. For F sample, the average particles size did not change while for the supported sample (F/T) it increased during reaction, leading to a slightly decrease in conversion (Figure 11). The particles size of FC sample decreased during reaction, but it did not affect the conversion, suggesting that most of the decrease occurred in the beginning of reaction. In this case, the support contributes to avoid particles increasing and no change in the size was noted for FC/T catalyst, resulting in the stability of conversion. For C sample, the particles size increased during reaction, but the conversion also increased, a fact that can be associated to the generation of particles of metallic cobalt, increasing the number of active sites. In the case of C/T sample, the support was able to improve cobalt reduction (as shown by TPR) and the catalyst was active since the beginning of reaction.
These beneficial effects of the support and of iron are mostly related to the amount of cobalt active size. As shown by the comparison of particles size distribution of the catalysts before (Figure 8) and after reaction (Figure 12), no simple relationship can be found between particles size and activity or selectivity. Moreover, both iron and the support led to a large decrease of acidity (Figure 14 and Table 6), a fact that can be important to prevent coke deposition. In fact, the results of TPO analysis for the spent catalysts (Figure 15) showed that the catalysts produced no coke, except for FC/T sample which showed a very small peak, indicating a negligible coke production.
Except for F and F/T samples, which led to negligible values of hydrogen to carbon monoxide molar ratio (Table 7), all catalysts produced values lower than 2, being suitable catalysts for methanol production and for Fischer-Tropsch reaction.
4. CONCLUSION
Supported and unsupported perovskites, based on lanthanum, iron and cobalt, were used to obtain lanthana-supported catalysts deposited on titanium oxide. The iron-based perovskite (LaFeO3) was not reduced in the experimental conditions used in this work and remained stable during reduction and reaction. By supporting this compound on titanium oxide (LaFeO3/TiO2) the particles size decreased but no catalytic improvement was noted. On the other hand, the cobalt-based perovskite (LaCoO3) produced cobalt oxides (Co3O4 and CoO), metallic cobalt and lanthanum oxide (La2O3). The support and iron made cobalt reduction easier, resulting in more active and stable catalysts. At the end of reaction, the supported catalyst derived from cobalt-based perovskite (LaCoO3/TiO2) showed the highest activity and selectivity, as a result of their increase during reaction. On the other hand, the supported catalyst containing iron and cobalt (LaFe0.5Co0.5O3/TiO2) showed high activity and selectivity since the beginning of reaction, being the most promising for industrial applications.
ACKNOWLEDGMENTS
HCF thanks CNPq and CAPES-COFECUB program for the scholarships. The authors acknowledge the financial support of CNPq, CAPES and Petrobras and to LNLS (National Synchrotron Light Laboratory, Brazil) for the X-ray diffraction experiments.
REFERENCES
[1] E. Moniz, A. Meggs, G. S. MCrae, C. Ruppel, The Future of Natural Gas. An Interdisciplinary MIT Study, Cambridge, 2011.
[2] S.C. Chiesa, J.F. Manning Jr., Biotechnol. Adv. 7 (1989) 499-526. [3] X. Tong, L.H. Smith, P.L. McCarty, Biomass 21 (1990) 239-255.
[4] P. Nikolaidis, A. Poullikkas, Renew. Sustain. Energy Rev. 67 (2017) 597-611. [5] J. S. Moura, M. C. Rangel, M. O. G. Souza, Fuel 87 (2008) 3627-3630.
[6] S. Z. Baykara, Hydrogen: A brief overview on its sources, production and environmental impact. Int. J. Hydrogen Energy 43 (2018) 10605-10614.
[7] L. C. P. Fernandes Junior, S. de Miguel, J. L. G. Fierro, M. C. Rangel, Stud. Surf. Sci. Catal. 167 (2007) 499-504.
[8] G. C. Araujo; S. Lima; J. M. Assaf; M. A. Peña; J. L.G. Fierro; M. C. Rangel, Catal. Today. 133-135 (2008) 129-135.
[9] A. L. C. Pereira, J. M. González-Carballo, F. J. Pérez-Alonso, S. Rojas, J. L. G. Fierro, M. C. Rangel, Top. Catal. 54 (2011) 179-189.
[10] Z. Shang; L. Shinguang; G. Li; G. Liu; X. Liang, Appl. Catal., B. 2017, 201, 302-309. [11] G. C. Araujo; S. Lima; V. L. Parola; M. A. Peña; J. L.G. Fierro; M. C. Rangel, Catal. Today. 2005, 107-108, 906-912.
[12] Z.Luo,, D. A. Kriz, R. Miao, C-H Kuo, W. Zhong, C. Guild, J. He, B. Willis, Y. Dang, S. L. Suib, P.Nandi, Appl. Catal. A: Gen. 554 (2018) 54-63.
[13] R. K. Singha, A. Shukla, A. Yadav, L. N. S. Konathala, R. Bal, Appl. Catal. B: Environm. 202 (2017) 473–488.
[14] R. K. Singha, A. Shukla, A. Yadav, S. Sain, C. Pendem, L.N. S. K. Konathala, R. Bal, Molecular Catalysis 432 (2017) 131-143.
[15] Z. Boukha, M. Gil-Calvo, B. de Rivas, J. R. González-Velasco, J. I. Gutiérrez-Ortiz, R. López-Fonseca, Appl. Cat. A: Gen. 556 (2018) 191-203.
[16] E. Ruiz-Trejo, P. Boldrin, J.L. Medley-Hallam, J. Darr, A. Atkinson, N.P.Brandon, Chem. Eng. Sci. 127 (2015) 269-275.
[17] G. P. Berrocal, A. L. M. Silva, J. M. Assaf, Jose M. A. Albornoz, M. C. Rangel, Catal. Today (2010) 240-247.
[18] R. Lanza, P. Canu, S.G. Järás, Appl. Catal. A: Gen. 375 (2010) 92–100.
[19] M. Morales, F. Espiell, M. Segarra, Int. J. of Hydrogen Energy. 39 (2014), 6454-6461. [20] R. K. Singha; A. Shukla; A. Yadav; S. Sain; C. Pendem ; L. N. S. K. Konathala ; R. Bal, Molec. Catal. 2017, 432, 131-143.
[21] A A. G. Dedov, A. S. Loktev, D. A. Komissarenko, K. V. Parkhomenko, A.-С. Roger, O. A. Shlyakhtin, G. N. Mazo, I.I. Moiseev, Fuel Process. Technol. 148 (2016) 128–137. [22] H. E. Figen; S. Z. Baykara, Int. J. of Hydrogen Energy 43 ( 2018) 1129-1138. [23] B. C. Enger; R. Londeng; A. Holmen, Appl. Catal., A. 364 (2009) 364, 15-26.
[24] D. Kaddeche; A. Djaidja; A. Barama, Int. J. of Hydrogen Energy 42 (2017) 15002-15009.
[25] J. S. Moura, M. O. G. Souza, J. D.A Bellido, E. M. Assaf, M. Opportus, P. Reyes, M. C. Rangel, Int. J. Hydrogen Energy 37 (2012) 3213-3224.
[26] Z. Luo ; D. A. Kriz ; R. Miao; C-H. Kuo; W. Zhong ; C. Guild ; J. He ; B. Willis ; Y. Dang ; S. L. Suib ; P. Nandi, Appl. Catal., A. 554 (2018), 54-63.
[27] F. Niu ; S. Li ; Y. Zong ; Q. Yao, J. of Phys. Chem. C 118 (2014), 19165-19171.
[28] C. Elmasides ; D. I. Kondarides ; S.G. Neophytides ; X. E. Verykios, J. of Catal. 2001, 198, 195-207.
[29] S. Tang, J. Lin, K.L. Tan, Catal. Lett. 59 (1999) 129-135.
[30] R. Lødeng, E. Bjørgum, B.C. Enger, J.L. Eilertsen, A. Holmen, B. Krogh, M. Rønnekleiv, E. Rytter, Appl. Catal. A 233 (2007) 11-23.
[31] B. C. Enger, R. Lødeng, A. Holmen, Appl. Catal. A: Gen. 346 (2008) 1–27. [32] A. Slagtern, U. Olsbye, Appl. Catal. A Gen. 110 (1994) 99–108.
[33] A.G. Dedov, A.S. Loktev, D.A. Komissarenko, K.V. Parkhomenko, A.-С. Roger, O.A. Shlyakhtin, G.N. Mazo, I.I. Moiseev, Fuel Process. Technol. 148 (2016) 128–137.
[34] M. De S.Santos, A. Albornoz, M. C. Rangel, Studies in Surface Science and Catalysis 162 (2006) 753-760.
[35] N. Couselo; F. S. G. Einschlag; R. J. Candal; M. Jobbagy, J. of Phys. Chem. 112 (2008) 1094-1100.
[36] N. Wang; X. Yu; Y. Wang, Wei Chu; M. Liu, Catal. Today 212 (2013) 98-107.
[37] B. P. Barbero, L. E. Cadús, S. G. Marchetti, Hyperfine Interactions 194 (2009) 367–379. [38] M. Blume, J.A. Tjön, Phys. Rev. 165 (1968) 446–456.
[39] U. Russo, L. Nodari, M. Faticanti, V. Kuncser, G. Filoti, Solid State Ion. 176(1–2) (2005) 97–102.
[40] N. A. Merino, B. P. Barbero, P. Ruiz, L. E. Cadús, Journal of Catalysis 240 (2006) 245– 257.
[41] A. L. C.Pereira, N. dos Santos, M. O. Ferreira, A. Albornoz, M. C. Rangel, Stud. Surf. Sci. Catal. 167 (2007) 225-230.
LEGENDS TO THE FIGURES
Figure 1. X-diffratograms for perovskites (a) before and (b) after reduction. Samples: F= LaFeO3; C= LaCoO3 and FC= LaFe0.5Co0.5O3. Phases: O= orthorhombic; R= rhombohedral; A= anatase (TiO2); cubic La2O3; cubic Co3O4; hexagonal CoO; hexagonal and cubic metallic cobalt.
Figure 2. Mӧssbauer spectra for unsupported iron-based perovskites measured at 298 K. Samples: F= LaFeO3 and FC= LaFe0.5Co0.5O3.
Figure 3. Mӧssbauer spectra for supported iron-based perovskites measured at 298 K. Samples: F= LaFeO3 and FC= LaFe0.5Co0.5O3. T= titanium oxide.
Figure 4. Mӧssbauer spectra for iron-based perovskites after reduced measured at 298 K. Sample: F= LaFeO3. T= titanium oxide.
Figure 5. Temperature programmed reduction for perovskites. Samples: F= LaFeO3; C= LaCoO3 and FC= LaFe0.5Co0.5O3. T= titanium oxide. C sample C/T sample FC sample; FC/Tsample; F sample; F/T sample.
Figure 6. Particles size distribution for perovskites. Samples: F= LaFeO3; C= LaCoO3; FC= LaFe0.5Co0.5O3 and T= titanium oxide. D represents the average diameter for the particles.
Figure 7. Transmission electron micrographs for perovskites. Samples: F= LaFeO3; C=
LaCoO3; FC= LaFe0.5Co0.5O3 and T= titanium oxide.(a) F sample; (b) F/T sample; (c) FC
Figure 8. Particles size distribution for perovskites after reduction. Samples: F= LaFeO3; C= LaCoO3 and FC= LaFe0.5Co0.5O3. T= titanium oxide; R= reduced. D represents the average diameter for the particles.
Figure 9. Transmission electron micrographs for perovskites after reduction. Samples: F= LaFeO3; C= LaCoO3 and FC= LaFe0.5Co0.5O3. T= titanium oxide; R= reduced. (a) F-R
sample; (b) F/T-R sample; (c) FC-R sample; (d) FR sample; (e) C-R sample and (f) C/T-R sample.
Figure 10. (a) Number of exchanged atoms (Ne) as a function of temperature for perovskites. . C sample C/T sample FC sample FC/T sample F sample F/T sample. (b) Rate of exchange (Re) as a function of temperature during the experiments of isotopic exchange in perovskites. F/T sample; F sample; FC/T sample; FC sample
and C/T sample; C sample. Samples: F= LaFeO3; C= LaCoO3 and FC= LaFe0.5Co0.5O3. T= titanium oxide.
Figure 11. (a) Methane conversion, (b) hydrogen selectivity and (c) hydrogen yield as a function of time over the catalysts during methane partial oxidation. Samples: F= LaFeO3; C= LaCoO3 and FC= LaFe0.5Co0.5O3. T= titanium oxide; S= spent catalyst. () F/T sample, () F sample () FC sample, () FC/T, () C/T and () FC/T.
Figure 12. Particles size distribution for the catalysts after partial oxidation of methane. Samples: F= LaFeO3; C= LaCoO3 and FC= LaFe0.5Co0.5O3. T= titanium oxide; S= spent catalyst. D represents the average diameter for the particles.
Figure 13. Transmission electron micrographs for perovskites after reduction. Samples: F= LaFeO3; C= LaCoO3 and FC= LaFe0.5Co0.5O3. T= titanium oxide; R= reduced. (a) F-R
sample; (b) F/T-R sample; (c) FC-R sample; (d) FR sample; (e) C-R sample and (f) C/T-R sample.
Figure 14. Acidity distribution for perovskites after reduction. Samples: F= LaFeO3; C= LaFeO3; FC= LaFe0.5Co0.5O3; T= titanium oxide and R= reduced. . C sample C/T sample FC sample FC/T sample F sample and F/T sample.
Figure 15. Temperature programmed oxidation for the spent catalysts. Samples: F= LaFeO3;
C= LaCoO3 and FC= LaFe0.5Co0.5O3. T= titanium oxide. C sample C/T sample
Figure 10 (b) Temperature (°C) Re / 10 17 atm. g -1. s -1 200 300 400 500 600 700
Figure 11 (a)
Time (min) Methane co nversion (%) 20 40 60 80 100 120 140 0 20 40Time (min) Hydroge n selectivity (%) 0 20 40 60 80 100 120 140 0 10 20 30 Figure 11 (b)
Figure 11 (c) Time (min) Hydrog en yield (%) 0 20 40 60 80 100 120 140 0 3 6 9 12
Figure 1 (a) FC 2 (degrees) Intensity (a.u.) 20 40 60 80 O A A O OA O F/T O R R R R R R R C F C/T O R R FC/T
Figure 1(b) F FC/T FC C 2ϴ (degrees) Intensity (a.u.) (u.a.) 20 40 60 80 100 F/T O O O O O O O O O O O O O O OO O O A OO A C/T
-12 -8 -4 0 4 8 12 T ra ns m is si on Velocity (mm/s) LaFe0.5Co0.5O3 LaFeO3 F sample FC sample Figure 2
Figure 3 -12 -8 -4 0 4 8 12 T ra ns m is si on Velocity (mm/s) LaFe0.5Co0.5O3/TiO2 LaFeO3/TiO2 F/T sample FC/T sample
Figure 4 -12 -8 -4 0 4 8 12 T ra ns m is si on Velocity (mm/s) LaFeO3/TiO2 Reduced
LaFeO3 Reduced
F/T-R sample F-R sample
0.00 0.02 0.04 0.06 0.08 0.10 0.12 0.14 0.16 0.18 0 100 200 300 400 500 600 700 800 900 1000 T C D S ig na l ( a .u .) Temperature (°C) Figure 5
Figure 6 10 20 30 40 50 60 70 80 0 2 4 6 8 10 12 14 F re qu en cy ( % ) D iameter (nm) 0 20 40 60 80 100 0 5 10 15 20 25 30 F re q u e n cy ( % ) D iameter (nm) 10 20 30 40 50 0 5 10 15 20 25 30 F re qu en cy ( % ) D iameter (nm) 10 20 30 40 50 60 70 0 5 10 15 20 25 F re q u e n cy ( % ) D iam eter (nm ) 10 20 30 40 50 0 5 10 15 20 25 F re q u e n cy ( % ) D iameter (nm) 5 10 15 20 25 30 35 0 5 10 15 20 25 F re qu en cy ( % ) D iameter (nm) F/T sample (D=15.7 nm) C sample (D=35.2 nm) C/T sample (D=31.2 nm) F sample (D=36.7 nm) FC sample (21.5 nm) FC/T sample (D=26.2 nm)
(c) (d)
(e) (f)
Figure 8 10 20 30 40 50 0 5 10 15 20 25 F re qu en cy ( % ) D iameter (nm) F/T-R sample (D=23.1 nm) 20 40 60 80 100 120 140 160 180 0 5 10 15 20 F re qu en cy ( % ) D iameter (nm) F-R sample (D=58.4 nm) 10 20 30 40 50 0 5 10 15 20 25 30 F re qu en cy ( % ) D iameter (nm) 20 30 40 50 60 0 5 10 15 20 25 F re qu en cy ( % ) D iameter (nm) FC/T-R sample (D=20.6 nm) FC-R sample (D=31.8 nm) 10 15 20 25 30 35 40 45 50 0 5 10 15 20 F re qu en cy ( % ) D iameter (nm) 10 15 20 25 30 35 40 45 50 0 5 10 15 20 25 F re qu en cy ( % ) D iameter (nm) C/T-R sample (D=25.2 nm) C-R sample (D=14.1 nm)
(a) (b) (c) (d) (e) (f) Figure 9.
Figure 10 (a) Temperature (°C) Ne /10 21 (atom g -1) 200 300 400 500 600 700 800 0 1.0 2.0 3.0 4.0 5.0
10 20 30 40 50 0 5 10 15 20 25 30 F re qu en cy ( % ) D iameter (nm) 5 10 15 20 25 30 0 5 10 15 20 25 F re qu en cy ( % ) D iameter (nm) 10 20 30 40 50 60 0 5 10 15 20 25 F re qu en cy ( % ) D iameter (nm) 0 20 40 60 80 100 120 140 160 180 200 0 5 10 15 20 F re qu en cy ( % ) D iam eter (nm ) 50 100 150 200 250 0 5 10 15 20 F re qu en cy ( % ) D iameter (nm) C-S sample (D= 35.1 nm) C/T-S sample (D= 15,8 nm) F-S sample (D= 55 nm) FC-S sample D= 24.7 nm FC/T-S sample (D= 20,1 nm) 20 30 40 50 60 70 0 2 4 6 8 10 12 14 16 18 F re qu en cy ( % ) D iameter (nm) F/T-S sample (D= 95.7 nm) Figure 12
(c) (d) (e) (f) Figure 13.
0.185 0.195 0.205 0.215 0.225 0.235 0.245 0 200 400 600 800 1000 T C D S ig na l(a .u .) Temperature (°C) Figure 14
0 200 400 600 800 1000 0.18 0.20 0.22 0.24 0.26 0.28 0.30 0.32 0.34 0.32 0.30 0.28 0.26 0.24 0.22 0.20 0.34 0.18 Figure 14
TCD Signa
l (a.u.)
Temperature (oC)LaFeO3 and FC= LaFe0.5Co0.5O3.
H: hyperfine magnetic field in kG; : isomer shift (all the isomer shifts are referred to -Fe at 298 K); 2: quadrupole shift; : quadrupole splitting.
(*): parameter held fixed during fitting. (sp): superparamagnetic species.
Species Parameters F sample FC sample
H (kG) 516.4 0.2 --- (mm/s) 0.37 0.01 ---2 (mm/s) -0.07 0.01 ---LaFeO3 % 100 ---H (kG) --- 452 13 (mm/s) --- 0.37 (*) 2 (mm/s) --- 0.00 (*) Fe3+ site 1 (0 Co + 1 Co) % --- 32 2 H (kG) --- 442 4 (mm/s) --- 0.37 (*) 2 (mm/s) --- 0.00 (*) Fe3+ site 2 (2 Co) % --- 20 2 H (kG) --- 439 1 (mm/s) --- 0.37 (*) 2 (mm/s) --- 0.00 (*) Fe3+ site 3 (3 Co + 4 Co) % --- 19 1 (mm/s) --- 0.35 0.01 (mm/s) --- 0.31 0.01 LaFe0.5Co0.5O3 (sp) % --- 29 1
F= LaFeO3; FC= LaFe0.5Co0.5O3 and T=TiO2.
H: hyperfine magnetic field in kG; : isomer shift (all the isomer shifts are referred to -Fe at 298 K); 2: quadrupole shift; : quadrupole splitting.
(sp): superparamagnetic species.
Species Parameters F/T sample FC/T sample
H (kG) 517.9 0.2 --- (mm/s) 0.37 0.01 ---2 (mm/s) -0.07 0.01 ---LaFeO3 % 63 1 ---H (kG) 494 3 --- (mm/s) 0.37 0.02 ---2 (mm/s) -0.05 0.03 ---LaFeO3 with
lower crystal size
% 20 1 --- (mm/s) 0.83 0.02 --- (mm/s) 0.36 0.01 ---Paramagnetic Fe3+ diffused inside TiO2 % 17 1 --- (mm/s) --- 0.47 0.01 (mm/s) --- 0.34 0.01 LaFe0.5Co0.5O3 (sp) % --- 100
Samples: F= LaFeO3; FC= LaFe0.5Co0.5O3; T= TiO2 and R= reduced.
H: hyperfine magnetic field in kG; : isomer shift (all the isomer shifts are referred to -Fe at 298 K); 2: quadrupole shift; : quadrupole splitting.
Species Parameters F-R sample F/T-R sample
H (kG) 522.1 0.2 521.7 0.5 (mm/s) 0.37 0.01 0.38 0.01 2 (mm/s) -0.07 0.01 -0.08 0.01 LaFeO3 % 100 79 2 (mm/s) --- 2.7 0.1 (mm/s) --- 1.04 0.05 Paramagnetic Fe2+ diffused inside TiO2 % --- 9 1 (mm/s) --- 1.02 0.08 (mm/s) --- 0.98 0.04 Paramagnetic Fe2+ diffused inside TiO2 % --- 12 112 122
experiments. Samples: F= LaFeO3; C= LaCoO3; FC= LaFe0.5Co0.5O3 and T=TiO2.
Sample Peak number
Maximum temperature (oC) Hydrogen consumption (mol g-1) F/T 1 2 Total 380 992 154.2 977.6 1131.8 F 1 2 3 Total 395 477 995 124.5 111.6 991.2 1227.2 FC/T 1 2 3 Total 396 581 860 576.6 154.1 1321.4 2052.1 FC 1 2 3 Total 376 773 987 1071.8 1402.3 1457.3 3931.3 C/T 1 2 Total 392 568 820.3 1442.2 2262.48 C 1 2 Total 438 563 2300.5 3838.4 6138.9
F= LaFeO3; C= LaCoO3; FC= LaFe0.5Co0.5O3 and T=titanium oxide. Sample Sg (m2 g-1) Sg* (m2 g-1) T 162 ---F/T 16 58 F 10 17 FC/T 22 57 FC 11 15 C/T 23 63 C 15 9.0
F= LaFeO3; C= LaCoO3; FC= LaFe0.5Co0.5O3 and T=TiO2. Sample N° Peak Maximum temperature (°C) Amount (µmol NH3 g-1) Total (µmol NH3 g-1) F/T 1 296.76 78.9941 78.9941 1 322.03 1438.0046 2 445.03 169.3438 3 581.51 57.2274 F 4 742.93 261.5496 1926.125 FC/T 1 322.28 603.5093 603.5093 FC 1 344.57 2489.8834 2 452.94 196.8516 3 705.10 381.6611 3068.3961 C/T 1 327.25 933.2166 2 647.92 100.7181 1033.9347 1 345.64 2664.0555 2 458.66 147.8378 C 3 648.86 671.7938 3483.6871
oxidation after 140 min in stream. Samples: F= LaFeO3; C= LaCoO3; FC= LaFe0.5Co0.5O3 and T=titanium oxide.
Sample H2/CO F/T 0.2 F 0.1 FC/T 1.2 FC 1.5 C/T 1.7 C 1.7