HAL Id: halshs-00107375
https://halshs.archives-ouvertes.fr/halshs-00107375
Submitted on 18 Oct 2006
HAL is a multi-disciplinary open access
archive for the deposit and dissemination of sci-entific research documents, whether they are pub-lished or not. The documents may come from teaching and research institutions in France or abroad, or from public or private research centers.
L’archive ouverte pluridisciplinaire HAL, est destinée au dépôt et à la diffusion de documents scientifiques de niveau recherche, publiés ou non, émanant des établissements d’enseignement et de recherche français ou étrangers, des laboratoires publics ou privés.
Ownership, Contractual Practices and Technical
Efficiency: The Case of Urban Public Transport in
France
William Roy, Anne Yvrande-Billon
To cite this version:
William Roy, Anne Yvrande-Billon. Ownership, Contractual Practices and Technical Efficiency: The Case of Urban Public Transport in France. Journal of Transport Economics and Policy, University of Bath, 2007, 41 (2), pp.257-282. �halshs-00107375�
Ownership, Contractual Practices and Technical Efficiency:
The Case of Urban Public Transport in France
William Roy∗ and Anne Yvrande-Billon∗∗ Final version: March 2006
Forthcoming in the Journal of Transport Economics and Policy, May 2007
Abstract
This paper investigates the impact of ownership structure and contractual choices on technical efficiency in the French urban public transport sector. The central proposition, which relies on classical contract theory arguments, is that ownership regime and contractual practices are key determinants of performances.
To test this proposition, we use an original panel data set covering 135 different French urban transport networks over the period 1995-2002 and we apply a stochastic frontier methodology.
The econometric results corroborate our proposition: the technical efficiency of urban public transport operators depends on the ownership regime and on the type of contract governing their transactions.
This research has been supported by the French governmental research program PREDIT. We are
grateful to the members of the CERTU, the GART and the UTP for providing us with precious data and for their fruitful comments. We also would like to thank an anonymous referee, the editor, David Starkie, the participants at the 22nd JMA (Hammamet, 2005), at the 9th Thredbo Conference (Lisbon,
2005), at the 9th ISNIE Conference (Barcelona, 2005), and at the ATOM seminars, more particularly
Alexandra Lechaffotec and Emmanuel Raynaud, for helpful comments.
∗ Laboratoire d’Economie des Transports, Université Lumière Lyon 2, 14 av. Berthelot, 69007 Lyon, France. William.Roy@let.ish-lyon.cnrs.fr.
∗∗ ATOM, University of Paris I Panthéon-Sorbonne, 106-112 Bd de l’Hôpital, 75013 Paris, France.
1. Introduction
For the last two decades, a number of European countries have been implementing significant changes in the organisational and regulatory frameworks of their local public transport systems (Van de Velde 1999, MARETOPE 2002). These reforms, promoted by the European Commission (European Commission 2005), aim at curbing the decline of the sector, restoring economic efficiency and improving the quality of the service in a context of severe public budget constraints. The hypothesis underlying these policies is therefore that organisational and regulatory settings affect performance.
Our main objective in this paper is to test this hypothesis by investigating to what extent the ownership structure and the type of regulatory contract influence the transport operator’s performance. More precisely, our aim is to assess the impact of the property regime and of the contractual risk-sharing rules on the technical efficiency of the French urban transport operators. This case is indeed of particular interest because, in France, the local authorities in charge of regulating the procurement of urban public transport services can choose between several modes of provision. Direct administration (“régie”) is one possibility but authorities massively (90%1) prefer to turn to the technical expertise and the managerial skills of private operators and contract out the operation of services either to semi-public companies (“sociétés d’économie mixte”) or to fully private firms. Moreover, once they have decided to delegate, authorities have then to select the type of regulatory contract they will sign with the operator. Three main categories of delegation contracts are traditionally distinguished, according to the type and proportion of risks that are shouldered by each contracting party. This variety of governance structures and contractual practices therefore provides a great opportunity to test the core hypotheses of contract theory according to which ownership structures and contractual choices are key determinants of performances. To our knowledge, no other empirical studies of the French urban public transport sector have already addressed both issues.
Our second contribution regards the methodology and the data that we use. To test our proposition and obtain an indicator of technical efficiency, we use an original panel data set covering 135 different French urban transport networks over the period 1995-2002 and we apply the production frontier methodology developed by Battese and Coelli (1995). The empirical literature in transport economics makes an intensive use of frontier approaches to assess the efficiency of transportation systems (Oum, Waters, Yu 1999; De Borger, Kerstens, Costa 2002). However, these works either simply ignore the impact of contractual arrangements and regulatory policies on efficiency, or take these variables into account but use a two-stage method that we consider as
ad-hoc and inconsistent (Dalen, Gomez-Lobo 2003). The present paper is therefore
original on two other aspects. Firstly, our work is one of the few that studies both the level of efficiency and the effects of ownership structure and regulatory contract in the French urban transport system (Kerstens 1996), and the only one to use the data of the “1995-2002 period”. Secondly, our paper uses a stochastic frontier model that simultaneously estimates the networks production function and the production inefficiency for each network, taking into account variables that do not impact on the production technology per se but may explain why some networks are more or less far from their production frontier.
The structure of the paper is as follows. Section 2 describes the regulatory and contractual framework of public urban transport in France and provides some descriptive statistics of the current situation of this sector. In section 3, we develop our model and hypotheses. Section 4 presents our dataset. Section 5 discusses our empirical findings and section 6 offers a summary of our findings as well as concluding remarks.
2. Organization of the French urban public transport sector
In the last two decades, France is one of the few European countries to have experienced a growth in transit ridership (Kerstens 1996). Local authorities have been very proactive in promoting urban transport, especially since the 1982 Law (the Domestic Transport Orientation Law, known as the LOTI law), which made them responsible for the organization and the management of their transit system. Investments in urban public transport infrastructure (as well as in equipment and rolling stock) and promotion of this mode of transportation have been a way for local authorities to improve the quality of life in their municipality and to show their concerns on environmental issues.
The institutional context in which urban transport services are provided in France can be concisely portrayed as follows.
As already mentioned, responsibility for urban public transport is decentralised to the local authorities2. This means that they have the authority to define the characteristics as well as the level of services to be procured and to choose the mode of organization of their urban transport system. More precisely, the local authorities define the network route, schedules, fares as well as the amount of subsidies given to the sector. As regard organizational choices, regulatory rules prevent competition on the market, that is the coexistence of several operators in the same transport perimeter. The urban public transport services have therefore to be supplied by a single operator and for a certain period of time. The local authorities can nevertheless choose between several modes of organization for the procurement of these services.
Indeed, they may decide to operate the service directly, in which case the operator is a public administration (“régie”). They may also choose to delegate the operation to a semi-public company3 (“société d’économie mixte”) or to a private company within the framework of a contractual agreement. In this latter case, the contractor is selected through a tendering process.
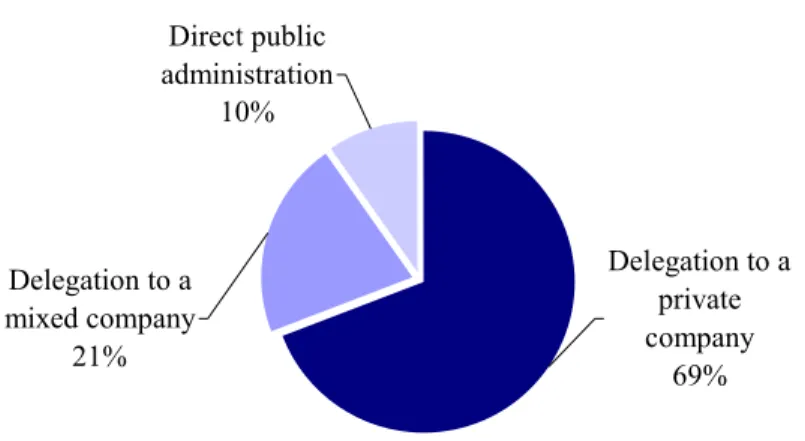
As shown by figure 1, local authorities massively (69%) prefer to turn to the technical expertise and the managerial skills of private operators, that is to say to contract out the operation of services to private companies. Therefore, France is among several Western European countries (UK, Scandinavian countries) where the private sector is playing a substantial role in the urban transit industry. The “hybrid” solution, which consists in operating the service via a mixed company, is nevertheless a widespread practice, with 21% of the local authorities choosing this procurement mode, while direct administration is the less preferred option (10%).
2 The local authority can be any municipality or association of municipalities. Various legal forms of
associations coexist (see GART 2002 for more details on this institutional aspect).
Figure 1: Modes of organization of the French urban public transport in 2002
(in % of the number of networks)4
Delegation to a mixed company 21% Delegation to a private company 69% Direct public administration 10%
In the case where the local authorities delegate the operation of the service, three forms of regulatory contracts can be envisaged. Indeed, the legal framework of the urban public transport sector specifies the main types of arrangements that can be used. These formal contracts between the local authority (the franchisor) and the operator (the franchisee) mainly differ in their degree of risk-sharing. Basically, this typology focuses on two types of on-going risks: the production risk, that is the risk associated to the production costs of a fixed production quantity, independent of the amount of passengers, and the revenue risk, that is the risk associated to the sale of transport services. These risks can be allocated in different ways. The various possible allocations of risks give rise to the following basic classification of contracts:
Net cost contract: in this type of contract, both production and revenue risk are
borne by the transport company. The difference between anticipated total operating costs and revenues determines the price the local authority pays to the transport company. A realised difference between costs and revenues that does not correspond to the anticipated difference between costs and revenues is for account of the transport company;
Gross cost contract: in this type of contract the production risk is taken by the
transport company while the revenue risk is borne by the local authority. An agreed price will be paid for the production of a fixed amount of services. Revenues accrued to the local authority. The difference between realised production costs and anticipated production costs is for account of the transport company;
Management contract: the management contract is the mirror image of the net
cost contract because in the management contract both production and revenue risk are borne by the local authority instead of the transport company. The manager of the transport activities receives a remuneration which is (in the pure form of this contract) independent of his achievements. This last category is therefore risk-free for the operator.
This typology therefore echoes the traditional distinction between fixed-price and cost-plus contracts (Laffont & Tirole 1993). Indeed, the two first types of contracts
4 Source: our database of 165 local authorities out of a total of 241 existing local authorities in France.
(net cost and gross cost contracts) are variants of fixed-price contracts whereas management contracts correspond to cost-plus contracts. To our knowledge, all the empirical studies dealing with the organization of the French urban public transport sector have restricted the variety of contractual arrangements to this binary typology (Kerstens 1996, 1999, Gagnepain 1998, Gagnepain & Ivaldi 2002). One of our objectives in this paper is to use a more sophisticated classification to describe the contractual practices of the local authorities and to analyse their impact on performance. We intend to investigate whether gross cost contracts and net costs contracts are equivalent in terms of incentives to technical efficiency. Therefore, in our study of the effects of contractual choices on technical efficiency, we will distinguish between the three kinds of contracts that have been described above and that correspond to the current practices of the local authorities.
This typology is modelled in table 1, adapted from Quinet and Vickerman (2004).
Table 1: A typology of urban public transport delegation contracts
Contractual form Production riskborne by Revenue riskborne by Payment received bythe operator
Net Cost
contracts Operator Operator s = se
Fixed-Price
contracts Gross cost
contracts Operator Local Authority s = se + (re-r) Cost-Plus
contracts
Management
contracts Local Authority Local Authority s = se + (re-r)-(ce-c) Where se is the amount of subsidies the local authority is expected to give to the operator5 and s the
amount he finally receives;
re is the expected commercial revenues and r the realised revenues; ce is the expected operating costs and c the effective operating costs.
In fact, besides these three types of contracts, all kinds of variants are possible. The most interesting are the gross cost contract with revenue incentives and the net cost contract with shared revenue risk. Additional incentives for the realisation of special objectives can be added in all types of contract, for example, a premium that is related to the number of passengers or a positive influence on the modal split. However, in this paper, since we could not have access to all the contracts, we had to retain the basic typology described above, which is, nevertheless, more precise than the binary typology used in previous studies and which is the one used and approved by experts of the sector like the members of the CERTU, the UTP or the GART.
Figure 2 reports the share of each contractual type in 2002 for our sample of 165 networks. As indicated on the figure, a fourth type of contract -the concession contract- is utilized but only in a minority of cases. In this form of contract, not only does the operator shoulder the industrial and commercial risks, but he also has to realize the investments in dedicated infrastructure, equipment and rolling stock. This type of contract is therefore associated with longer duration but is rarely used by the local authorities who prefer to delegate only the operation.
As can be noticed, few local authorities who choose to delegate the operation of the urban public transport services adopt management contracts (20%). The vast majority of them (80%) rather turn to contracts involving a positive risk-sharing, that is to say producing higher incentives.
Figure 2: Modes of delegation of the French urban public transport in 2002
(in % of the number of networks)6
Management contract 20% Concession 2% Net cost contracts 51% Gross cost contract 27%
Furthermore, as pointed out by table 2 and figure 3, this preference for high-powered incentives contracts is consistent with the trend that has been observed for three decades and which reveals a clear determination of the local authorities to make the operators bear a growing proportion of risks. Indeed, while in the seventies, cost-plus contracts were employed in 100% of the cases, this proportion has significantly fallen from the eighties to reach a level of 25% in the nineties.
Table 2: Evolution of the proportion of local authorities using management contracts7
Decade 1970’s 1980’s 1990’s
Average proportion of management contracts 100% 60% 25%
Figure 3: Evolution of the modes of delegation of the French urban public transport (in % of the number of networks)8
0% 10% 20% 30% 40% 50% 60% 70% 80% 90% 100% 1995 1996 1997 1998 1999 2000 2001 2002 Management contracts Gross cost contracts Net cost contracts Concession
6 Source: our database of 165 local authorities. 7 Sources: CERTU (2003) and GART (2002). 8 Source: our database of 165 local authorities.
In other words, many authorities that previously used cost-plus contracts have now switched to fixed-price contracts, which have therefore become the most popular type of delegation arrangements.
In proposing private operators more high-powered incentives contracts, the objective of the local authorities was to try and reduce the financial support needed to insure the procurement of urban public transport services. As in most countries, subsidies are inevitable in the French urban transit system since budgets are rarely balanced. Thus, for 2002, revenues from fares were estimated to cover only 34% of the operating costs in average, which corresponds to an operating deficit of more than € 1.6 billions9. Consequently, additional sources of financing are required. These financial supports can come from the budget of the local authorities (€1260m in 2002), from selective state subsidies (€112m in 2002) or from a special tax (“le versement transport10”) (€1864m in 2002).
One reason for the budget being unbalanced is that transport companies face a variety of community service obligations and operate under ‘universal service, universal price’. Indeed, prices are regulated by the local authorities and maintained at a low level in order to ensure affordable access to all consumers of public transportation. Moreover, special fares are provided to special groups like pensioners and students. But, another source of explanation might be the inefficiency of operators. In view of the financial situation that we have described, it is indeed of interest to determine whether urban transport operators are working in a technically efficient way. Furthermore, considering the variety of regulatory contracts existing in the French system and the organizational changes that the local authorities have introduced for two decades, it is of even greater interest to investigate the link between contractual choices and technical efficiency.
3. Hypotheses and model
Our objective in this paper is to contribute to the discussions on the respective merits of private and public provision and on the relative impacts of various regulatory contracts on technical efficiency. In other words, we aim at investigating to what extend different types of property regimes and different kinds of delegation contracts affect operator performance.
Ownership structure, contracts and performance: some hypotheses
The issue of the performance differential between public and private has motivated a large amount of empirical studies since the 1950’s and is still largely debated. There is indeed no clear consensus in the theoretical literature as to whether private monopolies outperform public ones and the empirical literature also remains inconclusive (Megginson & Netter 2001). However, in this paper, we support and intend to test the basic argument developed in incomplete contract theory according to which production is organized and carried out more efficiently in a privatized firm than in a public firm for at least two main reasons: firstly, because the objectives of a
9 Source: GART (2002).
10 This is a unique French locally levied tax, earmarked for supporting public transport and paid by any
private firm are clearer and less diffuse and secondly because better incentives can be given to the managers and workers (Tirole 1994, Schmidt 1996, Hart, Shleifer, Vishny 1997). Moreover, in our case, private participation is associated with ex ante competition since delegation contracts are awarded through a tendering process, while direct public administration is not subject to such competitive pressures. Competition issues therefore reinforce the expectation that public service provision tends to be less efficient than private service provision. Hence, our first hypothesis is the following:
Hypothesis 1a: Private operators show higher performance than public ones.
Considering that, in our case, there is also a hybrid ownership regime -the semi-public regime-, we have to complete hypothesis 1a. Since in the mixed regime (“société
d’économie mixte”) the majority of the capital of the operator is under public control,
we assume that this hybrid regime is in between the two other modes in terms of efficiency. We indeed expect the semi-public operators to perform better than completely public ones because these hybrid structures may introduce some of the expertise, incentives and managerial skills of the private sector. However, because of remaining bureaucratic rigidities and due to the absence of competition in the selection process of semi-public operators, this form of governance is assumed to lead to worse efficiency than the completely private one. In other words, we conjecture that:
Hypothesis 1b: Semi-public operators show higher performance than public ones but lower performance than private operators.
It is important at this stage to discuss the definition of performance that we use and consider as appropriate for this study. We decided to use technical efficiency measures rather than profitability ratios or price indexes for several reasons
Technical efficiency refers to the degree to which service provision is maximised given the resources at hand11 and its measurement involves a comparison between observed and optimal values of services and resources. Therefore, focusing on technical efficiency to compare public and private provision of utilities allows us not to worry about the manifold and sometimes contradictory objectives public operators may have (Blank 2000). Indeed, technical efficiency is the only objective which does not prevent the achievement of other goals. “Being technically inefficient cannot be
justified on the basis of other objectives [and, in the same way], allocating too many resources to a production process for social or environmental reasons does not necessarily imply that the allocation is technically inefficient” (European Commission
1999, page 114).
Moreover, this indicator of physical performance suffers less from problems of data availability and reliability. The information required to measure technical efficiency are the service and resource quantities, which are very often available at the firm level and are, most of the time, more reliable than financial or monetary data (like profits or costs for instance).
We will come back later in this section on the methodology that we use to evaluate technical efficiency. For now, we would like to go on with the discussion on the potential explanatory variables of efficiency differential. Indeed, other aspects than
11 Depending on the circumstances, efficiency can also be measured from the opposite orientation, as
the ownership regime might be considered in the analysis of operators’performances. The second dimension we would like to study is the type of contractual agreement governing delegation. As described earlier, the French urban transport market is heavily regulated and this regulation appeals to three main types of contracts which differ in their degree of risk-sharing (management, gross cost and net cost contracts). This produces some useful heterogeneity with respect to the power of contracts faced by firms and our second objective in this article is to investigate the respective impact of these different types of contractual practices on technical efficiency.
The basic argument developed in the contract theory literature is that cost-plus contracts produce lower incentives than fixed-price contracts (Beesley & Littlechild 1989, Laffont & Tirole 1993, Bajari & Tadelis 2001). An operator whose costs are entirely reimbursed by the local authority does not have the same incentives to reduce these costs as an operator who bears all industrial risks. Therefore, cost-plus contracts are assumed to lead to a worse use of the production factors.
Hypothesis 2a: Cost-plus contracts (i.e. management contracts in our typology) provide lower technical efficiency than fixed-price contracts (either gross cost or net cost contracts).
Furthermore, we would like to test the implicit proposition made in the empirical researches dealing with the French urban public transport which do not distinguish between gross cost and net cost contracts (Gagnepain 1998, Gagnepain & Ivaldi 2002, Kerstens 1996, 1999). These works do not indeed take into account the existence of two types of fixed-price contracts, suggesting that their respective impact on performance is identical.
Hypothesis 2b: Net cost contracts and gross cost contracts are equivalent in terms of incentives to technical efficiency.
We therefore consider that operators are incited to be technically efficient when they bear industrial risks but that supporting commercial risks does not affect their incentive to minimize production costs (Hart, Shleifer & Vishny 1997). Whatever the proportion of commercial risks supported by operators under fixed-price contracts, that is to say whatever the type of fixed-price contract regulating the operators, their effort to organize the production efficiently and reduce costs might be the same. To our knowledge, this hypothesis has never been tested. Therefore, one of the contributions of our paper regarding the analysis of the French transport sector, and more broadly regarding the analysis of contractual forms, is the introduction of two types of fixed-price contracts. We intend such a distinction to enable us to deepen the analysis of the determinants of technical inefficiency and to give a more precise answer to the question we are addressing: is there a contractual design that is particularly suited to induce technical efficiency?
As deplored by De Borger et al. (2002), whereas the UPT sector has given rise to a lot of empirical works aimed at assessing the performance of the sector, too few studies have so far empirically looked at the impact of contractual arrangements to derive useful conclusions for regulatory policies. With this paper, we intend to somewhat bridge this gap.
A model for technical inefficiency effects
Since the seminal paper by Farrell (1957), who was the first to introduce the idea of best-practice frontiers, two sources of productive inefficiency are distinguished: technical and allocative inefficiency. Basically, technical inefficiency arises from an excessive use of inputs whereas allocative inefficiency is due to the wrong choice of technically efficient combinations given input prices. Any attempt to measure productive efficiency and analyse its determinants must therefore start by an estimation of the technical efficiency.
As suggested in the literature, there exists a wide range of methods that can be applied to evaluating the technical efficiency of a given firm or organisation (Murillo-Zamarano 2004). Furthermore, efficiency assessment has received considerable attention in the literature with regard to urban public transportation (De Borger et al. 2002). Among the more common approaches12, the one we use in this paper is the stochastic frontier analysis (SFA). This frontier method is not strictly preferable to the others. On the one hand, compared to the non-parametric methods, this method allows taking account of random errors. On the other hand, its main disadvantage is that it assumes that the boundary of the production possibility set can be represented by a particular functional form with constant parameters. However, we consider that the fact that SFA imposes an explicit functional form and distribution assumption on data is less of an issue since our large database allows us to run a translog function, which is a very flexible functional form. Moreover, as our objective in this paper is not only to estimate a frontier and collect inefficiency scores but also and above all to analyse the determinants of technical inefficiency, the more relevant method seems to be the stochastic frontier analysis and more precisely, the panel model proposed by Battese and Coelli (1995).
The stochastic production frontier13 of firm i in time t is thus defined by:
yit = f(xit, zit ; β) + vit - uit
where yit represents the production level of the i-th firm at date t; xit is a vector of inputs of the i-th firm at date t; zit is a vector of environmental variables for the i-th firm at date time t; β is a vector of unknown parameter to be estimated. The vit and uit are random variables. More precisely, vit is the idiosyncratic error component of the stochastic part. It corresponds to the usual disturbance introduced in regression models, and therefore represents all types of omitted or unobservable variables that have unbounded effects on output (such as weather uncertainty or measurement errors). uit is the technical inefficiency component of the stochastic part. It is therefore supposed to be a non-negative valued random variable (uit≥0) and it captures the technical and economic inefficiency under control of the operator.
The vit are assumed to be iid N(0, σv²) random errors, independently distributed of the
uit. The uit are assumed to be independently distributed as truncated normal N(witδ,
σu²), where wit is a vector of explanatory variables that affect technical inefficiency of firms over time and δ is a vector of unknown coefficients.
12 The three more common approaches are (1) parametric linear programming approach, (2) data
envelopment analysis and (3) stochastic production frontier. For a description of these different approaches, see Coelli, Rao & Battese (1998) or Coelli, Estache, Perelman & Trujillo (2003).
13 The production frontier gives the maximum output that can be produced from a specified set of
inputs, given the existing technology available or, put differently, the minimum resources employed for producing a certain level of output.
The parameters β and δ are estimated simultaneously with the method of maximum likelihood and the likelihood function is expressed in terms of the variance
parameters, 2 2 2 v u σ σ σ = + and 2
(
2 2)
v u u σ σ σγ = + . γ measures the importance of the variance of production inefficiency relative to total variance. A value close to one indicates that productive inefficiency is important relative to the random noise term affecting production level (for a more detailed explanation of this method, see Kumbhakar & Knox Lovell 2000).
A first advantage of the Battese and Coelli’s model is that it formulates a model for the technical inefficiency effects, which is not done in many studies estimating stochastic production frontiers. The second advantage is that it allows estimating simultaneously the parameters of the stochastic production frontier and the parameters of the inefficiency model. Therefore, this approach is statistically more relevant than the two-stage approach used in several studies which consists in predicting the technical inefficiency effects via the estimation of a stochastic production frontier and then regressing the inefficiency measures obtained in the first stage on some explanatory variables. Thus, in the first stage, inefficiency effects are assumed to be identically distributed whereas in the second stage these error terms are assumed to depend on some other variables. The model developed by Battese and Coelli allows avoiding this inconsistency (Dalen & Gomez-Lobo 2002).
4. Data
This subsection offers more details on the sample and the definition of our variables. The database used here assembles the results of two annual surveys conducted by the Centre d’Etude et de Recherche du Transport Urbain (CERTU), a ministerial agency, on the one hand, and the Groupement des Autorités Responsables du Transport (GART), a nationwide trade organization that gathers most of the local authorities in charge of a urban transport network on the other hand. The data are available between 1995 and 2002 and for a total of 165 networks (out of 241).
For a purpose of homogeneity, we have excluded the networks with at least one mass transit system (subway and tramway) which have obviously a different production function. We have also reduced our sample by excluding the small networks (under 30,000 inhabitants) that are also assumed to have a different production function. In addition, several observations (network-year) were discarded (99) because some data were missing or were suspected to be wrong after a careful scanning of the data14. The result is an unbalanced panel of 981 yearly observations that covers 135 different urban transport networks over eight recent years. This database is the biggest and the most updated on the French urban public transport system and one of the biggest ever used in the sector (De Borger et al. 2002).
Output and inputs
De Borger et al. (2002), in a recent survey of frontier studies in the urban transport sector, reported that an important characteristic of empirical studies is the wide variability in the use of inputs and outputs in urban technology specifications. This
14 It is assumed that this suspect observations were randomly distributed, such that the sample is still
variability in the input and output measures suggests that there is no generally accepted set of relevant variables in the bus industry.
Our output variable is the number of vehicle-kilometres. Other output measures can be found in the transportation literature. The definition of outputs is indeed the subject of numerous debates. Some authors argue that demand-related indicators (e.g. passenger-km or number of passengers) are more relevant than pure supply indicators (e.g. vehicle-km or seat km) because they take into account the economic motive for providing services (Berechman 1993). Ignoring demand may lead to consider that the most efficient operators are those whose buses are empty. Although this argument is powerful, the definition of output we retain in this paper is supply-orientated. The main argument explaining our choice is that demand-related measures do not necessarily vary with inputs, but are on the contrary extremely dependent upon exogenous determinants of the commercial performance such as the rates of unemployment and car ownership, the age-groups of the population or the tariff policy imposed by local authorities. Since these variables are not available at a disaggregated level in the actual version of our database, we prefer using a supply-related measure of output, considering that this type of measure requires introducing fewer control variables in the estimate of technical efficiency. What we therefore measure is the operators’ technical capability to produce the maximum level of vehicle-kilometres given the underlying technology, that is to say given a specified set of inputs. Although we are aware that performance encompasses other dimensions than technical efficiency as we measure it, we nevertheless think that the analysis of this particular dimension performance is a first and necessary step. Indeed, as put by De Borger et al. (2002), “independent of the achievement of broader goals defined in
terms of passenger transit services actually consumed, supplying bus services in the least costly way may be considered a reasonable requirement for operators” (De
Borger et al. 2002, page 18).
The inputs we consider in our study are the most frequently used in the literature. Indeed, our input set consists of capital, labour and energy. Capital is measured by the number of vehicles (bus, trolleybus, minibus, etc…) used to provide the service. We could not have enough reliable financial data to create another indicator of capital expenses. However, although incomplete, our indicator takes into account the major part of capital, that is rolling stock. Labour is measured by the number of employees including temporary work and subcontracting personnel with no distinction between driving labour and non-driving labour. The total number of employees is measured in equivalent full time and the quantity of labour in equivalent ‘employee-year’. At last, energy is measured in equivalent diesel m3.
We are aware that differences between operators may exist in terms of quality and composition of inputs. Thus, for instance, rolling stock consists of various vintages with different energy consumptions and used at different intensities. However, our data did not allow us correcting for input quality differences. The completion and refinement of the database is ongoing and we intend to be able to use more precise data in our future researches. For now, this limitation of our database does not however prevent us from estimating technical efficiency in a robust way because we consider that it is not unrealistic to assume that the level of output imposed to the operators by local authorities already takes into account the characteristics of the inputs available to them. More precisely, we make the assumption that the quality of rolling stock is endogeneized in the objectives of production determined by the local authorities.
Besides these input variables, two control variables are used. The first one is the length of the network (in kilometres). This variable is supposed to be a proxy of exogenous environmental characteristics of the network such as the size of the city and the existence of natural barriers. Since network’s length is determined by the local authority, this variable also captures the public services obligations imposed to the operator (e.g. extensions to the suburbs). The network’s length is assumed to have a positive impact on the level of production. We indeed consider that an operator is more productive in terms of vehicle-km if the network stretches far away, notably because the speed outside the city is higher than inside.
The second control variable is the number of inhabitants in the city or the group of cities controlled by the local authority. This variable allows us controlling for the demand impact on technical efficiency. Its effect on the level of production is supposed to be positive since we assume that the more inhabitants, the more vehicles-kilometres supplied by the operator.
Descriptive statistics on our output and input variables are provided in table 3.
Table 3: Sample descriptive statistics of the input and output variables
(135 networks and 8 years)
Variable Mean Standard
Deviation Minimum Maximum
Vehicle-km (Y) 2 461 508 2 543 857 178 106 11 380 524 Labour (XLAB) 145.50 165,40 8 958.75 Energy (XEN) 1 110.41 1 261.97 63 6 005.56 Vehicles (XVE) 64 64 5 365 Network length (ZNL) 157.20 127 14 645 Population (ZPOP) 100 593 77 102 22 579 380 375 Organisational variables
In order to test our hypotheses, that is to say to assess the influence of ownership and contractual choices on efficiency, the organisational variables we introduce in the inefficiency model are the following:
• PUBLIC is a dummy variable that takes the value 1 if the operator in a particular year is a public administration and 0 otherwise;
• MIXED is a dummy variable that takes the value 1 if the operator in a particular is a semi-public company and 0 otherwise;
• PRIVATE is a dummy variable that takes the value 1 if the operator in a particular year is a private company and 0 otherwise;
• MANAG is a dummy variable that takes the value 1 if the private franchisee
operates under a management (cost-plus) contract;
• GROSS is a dummy variable that takes the value 1 if the private franchisee
operates under a gross cost contract;
• NET is a dummy variable that takes the value 1 if the private franchisee operates under a net cost contract.
Table 4: Sample descriptive statistics of the organisational variables
(135 networks and 8 years)
Variable Mean Standard
deviation Minimum Maximum
PUBLIC 0.0653 0.2470 0 1 MIXED 0.2528 0.4348 0 1 PRIVATE 0.6819 0.4659 0 1 MANAG 0.1447 0.3520 0 1 GROSS 0.2110 0.4082 0 1 NET 0.3262 0.4690 0 1
5. Results
In order to determine the (in)efficiency properties of the different ownership regimes and regulatory contracts, we estimate the following translogarithmic production frontier model15: it it VE it VE it VE , VE VE it EN it VE , EN EN it EN it EN , EN VE it LAB it VE , LAB EN it LAB it EN , LAB LAB it LAB it LAB , LAB POP it POP NL it NL VE it VE EN it EN LAB it LAB 0 it u v X ln X ln X ln X ln X ln X ln X ln X ln X ln X ln X ln X ln Z ln Z ln X ln X ln X ln Y ln − + + + + + + + + + + + + = β β β β β β β β β β β β
with the technical inefficiency effect defined by two different equations:
it it MIXED it PUBLIC 0 it PUBLIC MIXED u =δ +δ ⋅ +δ ⋅ +ω (1) it it NET it GROSS it MANAG 0
it MANAG GROSS NET
u =δ +δ ⋅ +δ ⋅ +δ ⋅ +ω (2)
Thus, the first model (1) considers only the ownership variables in the inefficiency term and allows us to test hypotheses 1a and 1b, the parameters δ being interpreted
relative to the omitted case, the delegation to private operators (PRIVATE).
Model (2) allows to estimate the respective impacts on inefficiency of delegation to private companies through management contracts, and gross cost and net cost contracts and to compare them with the impact of the omitted cases, that is public administration (PUBLIC) and mixed ownership (MIXED). This model therefore allows
us to test hypotheses 2a and 2b.
All models were estimated using the FRONTIER 4.1 software (Coelli 1996). Our estimation results are presented in table 5 below. Tables 6 and 7 present some specification tests on our models.
15 In order to reduce the number of parameters to be estimated, we omit the cross-products between the
Table 5: Production frontier estimation results
Dependent variable: vehicle-kilometres; 981 observations
Parameter Model 1 Model 2
β0 8.698*** (27.779) 8.763***(28.067) βLAB 1.417*** (6.854) 1.464*** (7.124) βEN -0.068 (-0.266) (-0.486)-0.123 βVE -0.367* (-1.865) -0.354* (-1.820) βNL 0.015*** (2.375) 0.015***(2.349) βPOP 0.053*** (3.569) 0.051*** (3.480) βLAB,LAB 0.187*** (3.762) 0.188***(3.777) βLAB,EN -0.466*** (-4.996) -0.481*** (-5.213) βLAB,VE 0.005 (0.057) (0.179)0.018 βEN,EN 0.177*** (2.871) 0.191*** (3.105) βEN,VE 0.133 (1.469) (1.323)0.119 βVE,VE -0.046 (-0.748) -0.043 (-0.704) δ0 -0.439*** (-3.612) (0.815)0.009 δPUBLIC 0.294*** (4.467) -δMIXED 0.349*** (4.861) -δMANAG - -0.019 (-1.387) δGROSS - -0.245*** (-19.223) δNET - -0.050*** (-2.182) 2 u 2 v 2 σ σ σ = + 0.009*** (8.050) 0.007***(21.018) 2 2 u /σ σ γ = 0.303*** (3.050) 0.112***(16.476)
Log likelihood function 1074 1094
LR test of one sided errors 40.439 80.183
Number of restrictions 4 5
Table 6 : Specification tests (model 1)
Null hypothesis Test statistic16 Critical value Decision
(1) No inefficiency effects H0 : γ=δ0=δPUBLIC=δMIXED=0 40.44 2 % 1 χ (4)=12.48 Reject H0
(1’) No impact of ownership on efficiency H0 : δPUBLIC=δMIXED=0
33.68 χ12%(2)=9.21 Reject H0
Table 7 : Specification tests (model 2)
Null hypothesis Test statistic Critical value Decision
(2) No inefficiency effects H0 : γ=δ0=δMANAG=δGROSS=δNET=0
80.18 χ12%(5)=14.32 Reject H0
(2’) No impact of contractual schemes on efficiency. H0 : δMANAG=δGROSS=δNET=0
80.12 χ12%(3)=11.35 Reject H0
For all models, the parameter γ is statistically different from zero. Moreover, the hypothesis that γ and the parameters of the different inefficiency functions (the δs) are jointly equal to zero is strongly rejected (tests 1 and 2). This indicates that the stochastic production frontier is an appropriate approach and that the inefficiency functions provide meaningful explanations of the sources of inefficiency. But before analysing the estimates of the parameters δ, we briefly comment our estimates of the coefficients of the stochastic frontier (the βs).
To interpret more easily the estimated first-order parameters in the translog production functions, we calculated the production elasticities at the sample means17 and obtained the following ratios:
Table 8 : Production elasticities
Production elasticity
at the sample means Model 1 Model 2
Labour 0.095 0.096
Energy 0.651 0.653
Vehicles 0.177 0.172
Return to scale 0.923 0.921
As expected, the estimated production elasticities of labour, energy and capital are positive implying that an increase in transit inputs results in a larger output. However, the elasticities of labour and capital are low compared to the elasticity of energy. These differences might be explained by the fact that operators do not have the same room for manoeuvre for each type of input. They can modify the number of employees and the size of the fleet more easily than their energy consumption which translates into production elasticities of labour and capital that are lower than the elasticity of energy. Moreover, as noticed by De Borger & Kerstens (2000), in this
16
The likelihood-ratio test statistic, λ= -2{log[Likelihood(H0)-log[Likelihood(H1)]}, has
approximately chi-square distribution with parameter equal to the number of parameters assumed to be zero in the null hypothesis, H0, provided H0 is true.
17 For instance, labour elasticity is calculated at the sample means by the following formula :
VE VE LAB EN EN LAB LAB LAB LAB LAB LAB LAB x x x X Y ln ln ln . 2 ln ln , , , β β β β ε = + + + ∂ ∂ =
industry, the substitution possibilities between labour and capital are very limited and at the same time the technological complementarities between the inputs ‘vehicles’ and ‘fuel’ are very strong.
We also find that the returns to scale are below one at the sample means (table 8), which indicates that the medium-sized companies of our sample face limited decreasing returns to scale.
Furthermore, consistently with our hypothesis, the length of the network is found to have a significant positive impact on the level of production (table 5). The longer the network, the larger the volume of outputs offered.
At last, the number of inhabitants is found to have a positive impact on the number of vehicle-kilometres procured, which corroborates our hypothesis.
Let us now turn to the core results of our paper, which relate to the inefficiency models.
The null hypotheses 1’ and 2’, considered in tables 6 and 7, which specify that the inefficiency effects are not a linear function of the ownership regime and contractual schemes, are rejected at the 1% level of significance. This indicates that the inefficiency effects in the stochastic frontier are clearly stochastic and are not unrelated to the ownership regime and to the contractual modes chosen by local authorities. This first result corroborates our general hypothesis according to which organizational and regulatory factors are significant determinants of technical efficiency.
More precisely, it appears from model 1 that the ownership regime has a significant
impact on efficiency in the urban public transport sector since the parameters δ0, δPUBLIC
and δMIXED are all significantly different from zero at 1%. Consistently with our
hypothesis 1a, public administrations and semi-public companies exhibit higher
technical inefficiency than private operators (δPUBLIC and δMIXED are positive). In other
words, choosing private companies to operate urban public transport services leads to a better use of the inputs and therefore, indirectly, to lower production costs. As already mentioned, this could be due to differences in managerial competences and incentives. This could also be due to the fact that private operators face competition at the contract attribution stage while public administrations and semi-public companies do not.
On the other hand, hypothesis 1b is not corroborated by our results. The mixed form
of ownership indeed appears to be the most inefficient regime in terms of technical efficiency (δMIXED is equal to 0.349 whereas δPUBLIC is equal to 0.294). Choosing a
semi-public operator for the procurement of UPT services seems therefore to be the worst choice a local authority can make.
A possible interpretation of this result could be that mixed ownership induces opportunistic behaviours both from the local authority and from the private partner. With this governance regime, responsibilities are difficult to attribute. Hence incentives to be efficient are low. This result could also suggest that local authorities have less control over semi-public companies than over public administrations, or, in other words, that local authorities involved in semi-public companies are captured by their private partners so that their performance is even worse than the performance of public administrations. At last, an interpretation which does not exclude the previous ones refers to the dynamism of the local authorities that have chosen to operate their network directly, despite the general trend toward public-private partnership. One could indeed consider that the few public administrations of our sample are more
efficient than the semi-public companies because the municipalities who decided to manage directly their urban transport system are particularly proactive in that respect. However, this result has to be qualified since the coefficients δPUBLIC and δMIXED, although
significantly different from each other18, are very close. Hence, there is actually a difference in terms of technical efficiency between public administrations and semi-public operators but this difference is slight.
To summarize these results, we provide in table 9 the mean inefficiency scores of urban public transport operators by ownership regime. The average technical inefficiency on the whole sample is 0.9891 which means that the industry as a whole could increase output by an average of 1.1% without additional inputs. Furthermore, other things being equal, private operators produce on average 1% more bus-kilometres than public administrations and 1.6% more bus-bus-kilometres than semi-public companies.
The fact that all networks operate at the neighbourhood of their production frontier and consequently that the inefficiency scores are very close together is not surprising for two reasons. First, our sample only covers bus networks. The production technology is therefore homogeneous and does not allow operators to have a large amount of leeway. Second, for social and political reasons, both the number of employees and the level of output to be procured are, to a large extent, constrained by local authorities. It seems consequently natural to observe a low variation in the technical efficiency of operators. What is more surprising however is to find that, despite a low standard deviation, technical efficiency is powerfully explained by the ownership regime. This means that the ownership regime is at the origin of differences in performances, even when these differences are small, which supports our conjecture even more. Two conclusions can therefore be drawn from our results. Firstly, the low variation in the technical efficiency of operators illustrates the fact that the sector is highly regulated. The levels of production and human capital are imposed by local authorities even to private operators and seem to meet the same social and political requirements whether the network is operated by a public, a semi-public or a private operator. Secondly, what our results show is that, although private operators are extremely constrained by local authorities, they can manage to be more technically efficient than public administrations and semi-public operators. This suggests that benefits could be expected from letting a greater autonomy to private initiatives.
Table 9: Mean inefficiency scores by type of ownership regime Type of ownership regime Mean Min Max Stdev.
Public administrations 0.9837 0.9774 0.9873 0.002 Semi-public operators 0.9780 0.9638 0.9862 0.005
Private operators 0.9937 0.9921 1 0.0007
Total 0.9891 0.9638 1 0.007
Regarding the incidence of contractual schemes on efficiency, the results of model 2
suggest that private operators with management contracts are further from the production frontier than private operators with fixed-price contracts (δMANAG is superior
to δGROSSand δNET) but the coefficient of the variable MANAG is different from zero only
18 The null hypothesis H
0: δPUBLIC=δMIXED is indeed strongly rejected; the likelihood-ratio test statistic that we obtained is equal to 33.68 while the critical value of a chi-square at 1% is equal to 6.63.
at the 20% level of significance. This result therefore slightly supports our hypothesis
2a which conjectured that management contract was the worst regulatory scheme in
term of technical efficiency.
At last, hypothesis 2b is not validated by our estimations. Indeed, our results indicate
that gross cost and net cost contracts are not equivalent in terms of incentives to technical efficiency. There is a significant difference between these two types of fixed-price contracts in favour of the gross cost contracts. More precisely, private operators regulated by gross cost contracts are more technically efficient than operators under net cost contracts. This suggests that bearing the commercial risks as well as the industrial risks leads to lower technical efficiency. A possible interpretation of this counterintuitive result is that operators regulated by net cost contracts tend to focus on their commercial objectives (revenue increase) rather than on their cost minimizing objectives and are therefore less technically efficient than operators under gross cost contracts who do not support revenue risks.
To summarise these results, table 10 gives the mean inefficiency scores of the private operators of urban transport systems according to their type of contractual scheme. As for model 1, what is underlined in this table is the low standard deviation of the inefficiency scores, which is, according to us, a consequence of the low degree of autonomy of the operators. Nonetheless and as for the estimates of model 1, contractual schemes are found to have a significant impact on technical efficiency.
Table 10: Mean inefficiency scores by type of contracts
Type of contract Mean Min Max Stdev.
Public and semi-public 0.9737 0.9617 0.9823 0.004 Private operators with management contracts 0.9807 0.9714 0.9868 0.0031
Private operators with gross cost contracts 0.9969 0.9962 1 0.0009 Private operators with net cost contracts 0.9872 0.9822 0.9912 0.0015
Total 0.9840 0.9617 1 0.009
6. Conclusion
In this paper, we have estimated a production frontier model for an eight-year panel of French urban transport networks (981 network-year observations) using the methodology proposed by Battese and Coelli (1995). Our objectives were twofold. First, we intended to measure the impact of ownership structure on technical efficiency. Second, we aimed at investigating the effects of the contractual practices on technical efficiency.
The results of our estimations support the conjecture that technical efficiency cannot be measured independently of the institutional or regulatory constraints. According to our estimates, private operators outperform public ones and operators under cost-plus contracts exhibit a higher level of technical inefficiency than operators under fixed-price agreements. Moreover, our database allowed us to introduce a third type of ownership regime, namely the semi-public regime, and to distinguish between two types of fixed-price contracts. Although such distinctions are fundamental to characterize the French urban public transport system, to our knowledge, our study is the only one to take into account this diversity of governance structures and contractual practices and our results reveal that such distinctions are fruitful. Indeed, our estimations clearly indicate that creating a public-private partnership via a
semi-public company turns out to be the worst organisational choice a local authority can make in terms of technical efficiency. We also show that gross cost and net cost contracts have a differentiated impact on this measure of performance. Private operators regulated by gross cost contracts indeed reach the highest efficiency score. However, these results have to be qualified. Indeed, our study also shows that, although statistically significant, the performance differentials between the various regulatory schemes are slight. The efficiency scores of the operators, whether public, semi-public or private and, among the private operators, whether regulated under cost-plus, gross cost or net cost contracts, are never inferior to 96%. Thus, what our results demonstrate is that all operators operate at the neighbourhood of their relative production frontier, the closest ones being the private operators under gross-cost contracts.
In terms of policy implications, what our study therefore suggests is that, given the current objectives imposed to the operators by the local authorities, only marginal positive results on technical efficiency are to be expected from regulatory changes that would consist in a shift to delegated management and high-powered incentives regulatory contracts. This does not mean that the regulatory framework has no effect on technical efficiency but rather that the main cause of the financial crisis endured by the sector is not the technical inefficiency. Performance encompasses other dimensions than technical efficiency like service quality or commercial efficiency which will have to be considered in order to complete our research agenda.
References
Bajari, P., and S. Tadelis (2001): ‘Incentives versus Transaction Costs: A Theory of Procurement Contracts’, Rand Journal of Economics, 32(3), 387-407.
Battese, G.E., and T.J. Coelli (1995): ‘A Model for Technical Inefficiency Effects in a Stochastic Frontier Production Function for Panel Data’, Empirical Economics, 20, 325-332.
Beesley, M.E., and Littlechild S.C. (1989): ‘The Regulation of Privatised Monopolies in the United Kingdom’, Rand Journal of Economics, 20(3), 349-367.
Berechman, J. (1993): Public Transit Economics and Deregulation Policy, North Holland, Amsterdam. Blank, J.L.T. (ed.) (2000): Public Provision and Performance, Elsevier, Amsterdam.
CERTU (2003): Transports collectifs urbains – Evolution 1997-2002, Lyon.
Coelli, T. (1996): ‘A Guide to FRONTIER Version 4.1: A Computer Program for Stochastic Frontier Production and Cost Function Estimation’, CEPA Working Paper 96/07, University of New England, Australia.
Coelli, T., A. Estache, S. Perelman and L. Trujillo (2003): A Primer on Efficiency Measurement for
Utilities and Transport Regulators, The World Bank Institute, Washington.
Coelli, T., D.S.P. Rao and G.E. Battese (1998): An Introduction to Efficiency and Productivity
Analysis, Kluwer Academic Publishers, Boston.
Dalen, D.M., and A. Gomez-Lobo (2002): ‘Regulatory Contracts and Cost Efficiency in the Norwegian Bus Industry: Do High-powered Contracts Really Work?’, Discussion Paper No 6/2002, Norwegian School of Management, Oslo.
Dalen, D.M., and A. Gomez-Lobo (2003): ‘Yardsticks on the Road: Regulatory Contracts and Cost Efficiency in the Norwegian Bus Industry’, Transportation, 30, 371-386.
De Borger, B., K. Kerstens and A. Costa (2002): ‘Public Transit Performance: What does one Learn from Frontier Studies?’, Transport Reviews, 22(1), 1-38.
European Commission (1999): Liberalisation of Networks Industries, Reports and Studies, Vol.4. European Commission (2005): Proposal for a Regulation of the European Parliament and of the
Council on public passenger transport services by rail and by road, COM(2005) 319 final,
Farrell, M.J. (1957): ‘The Measurement of Productive Efficiency’, Journal of the Royal Statistical
Society (series A), 120(3), 253-281.
Gagnepain, P. (1998): ‘Structures productives de l’industrie du transport urbain et effets des schémas réglementaires’, Economie et Prévision, 135, 95-107.
Gagnepain, P., and M. Ivaldi (2002): ‘Incentive Regulatory Policies: The Case of Public Transit Systems in France’, Rand Journal of Economics, 33(4), 605-629.
GART (2002): Les chiffres de références des transports publics, Paris.
Hart, O.D., A. Shleifer and R.W. Vishny (1997): ‘The Proper Scope of Government: Theory and Application to Prisons’, Quarterly Journal of Economics, 92, 1127-1162.
Kerstens, K. (1996): ‘Technical Efficiency measurement and explanation of French urban transit companies’, Transportation Research –A, 30(6), 431-452.
Kerstens, K. (1999): ‘Decomposing Technical Efficiency and Effectiveness of French Urban Transport’, Annales d'économie et de statistique, 54, 129-155.
Kumbkakar, S.C., and C.A. Knox Lovell (2000): Stochastic Frontier Analysis, Cambridge University Press.
Laffont, J.-J., and J. Tirole (1993): A Theory of Incentives in Procurement and Regulation, MIT Press, Cambridge.
MARETOPE Consortium (2002): Managing and Assessing Regulatory Evolution in local public
Transport Operations in Europe, Office for Official Publications of the European Communities,
Luxembourg.
Megginson, W.L., and J.M. Netter (2001): ‘From State to Market: a Survey of Empirical Studies on Privatization’, Journal of Economic Literature, 39(2), 321-389.
Murillo-Zamarano, L.R. (2004): ‘Economic Efficiency and Frontier Techniques’, Journal of Economic
Survey, 18(1), 33-77.
Oum, T.H., W.G. Waters II and C. Yu (1999): ‘A Survey of Productivity and Efficiency Measurement in Rail Transport’, Journal of Transport Economics and Policy, 33(1), 9-42.
Quinet, E., and R. Vickerman (2004): Principles of Transport Economics, Edward Elgar, Cheltenham. Schmidt, K.M. (1996): ‘Incomplete Contracts and Privatization’, European Economic Review, 40,
569-579.
Tirole, J. (1994): ‘The Internal Organization of Government’, Oxford Economic Papers, 46, 1-29. Van de Velde, M. (1999): ‘Organisational Forms and Entrepreneurship in Public Transport’, Transport