HAL Id: hal-02326968
https://hal.archives-ouvertes.fr/hal-02326968
Submitted on 31 Oct 2019HAL is a multi-disciplinary open access
archive for the deposit and dissemination of sci-entific research documents, whether they are pub-lished or not. The documents may come from teaching and research institutions in France or abroad, or from public or private research centers.
L’archive ouverte pluridisciplinaire HAL, est destinée au dépôt et à la diffusion de documents scientifiques de niveau recherche, publiés ou non, émanant des établissements d’enseignement et de recherche français ou étrangers, des laboratoires publics ou privés.
Deposition Process of Amorphous Boron Carbide from
CH[sub 4]∕BCl[sub 3]∕H[sub 2] Precursor
Jérôme Berjonneau, Georges Chollon, Francis Langlais
To cite this version:
Jérôme Berjonneau, Georges Chollon, Francis Langlais. Deposition Process of Amorphous Boron Carbide from CH[sub 4]∕BCl[sub 3]∕H[sub 2] Precursor. Journal of The Electrochemical Society, Elec-trochemical Society, 2006, 153 (12), pp.C795. �10.1149/1.2353566�. �hal-02326968�
Available at: https://doi.org/10.1149/1.2353566
DEPOSITION PROCESS OF AMORPHOUS BORON CARBIDE FROM CH4/BCl3/H2 PRECURSOR
J. Berjonneau, G. Chollon* and F. Langlais
Laboratoire des Composites Thermostructuraux, UMR 5801 (CNRS-SNECMA-CEA-UB1), Université Bordeaux 1, 3 allée de La Boétie, 33600 Pessac, France
ABSTRACT
Amorphous boron carbide coatings have been prepared by CVD from CH4/BCl3/H2
precursor mixture at low temperature (800-1050°C) and reduced pressure (12kPa). A kinetic study has been conducted to determine the kinetic law (including apparent activation energy and reaction orders) related to the deposition within the regime controlled by the chemical reactions. On the basis of an in-situ gas phase analysis by FTIR spectrometry and a thermodynamic study of the homogeneous equilibrium, the HBCl2 species has been identified as an effective precursor of the boron element. The
evidence of correlations between the various experimental approaches has supported a discussion on the chemical process involved.
Key words: Boron carbide, Kinetics, Gas phase analysis, Chemical-structural analysis.
* Corresponding author (Tel : +33 5 56 84 47 27, Fax : +33 5 56 84 12 25, E-mail
1 INTRODUCTION
Multilayered (Si)-B-C matrices have been developed to improve the high temperature durability of SiC-based ceramic matrix composites.1 Boron carbide can be infiltrated in fibrous preforms using for instance a BCl3-CH4-H2 mixture as the gas
precursor.2 Such a CVD system has been widely studied through theoretical and experimental approaches. Most of them were carried out using cold wall reactors at relatively high temperature (T>1000°C) and either at atmospheric3-6 or reduced
pressure.7-12 Vandenbulcke et al.4-5 proposed mass transfer–equilibrium and mass transfer–kinetics models and compared the theoretical data to the experimental deposition rates. These authors evidenced the limiting kinetic effect of the carbon formation from the decomposition of CH4, particularly at low temperature, giving rise to carbon-rich
rhombohedral (B13C2 or B13C3) and amorphous (BCx) boron carbide. These results were
later confirmed by Janson et al.,8 who pointed out the difficulty to obtain a high carbon content in the films deposited under reduced pressure (xC<22at.% for 1<P<7kPa).
The chemical vapor infiltration (CVI) of a ceramic within fibrous preforms requires a hot-wall reactor operating at low temperature and reduced pressure, in order to promote the mass transfer with respect to chemical reaction rates.13 Except for the kinetic study
carried out by Hannache et al.,10 such conditions were not used in the previous works. With a view to control the CVI process of boron carbide and to collect data for a future overall modelling, an investigation of the chemical mechanism is proposed in the present contribution, by using a thermodynamic approach (particularly of the homogenous equilibrium) and three experimental studies : (i) kinetic law assessment, (ii) FTIR gas phase analysis and (iii) characterization of the coatings.
2 THERMODYNAMIC STUDY
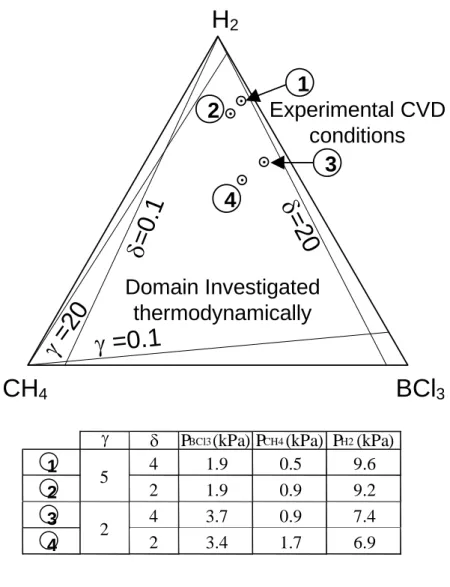
Thermodynamic calculations (Thermodata, France) have been carried out in the B-C-H-Cl system, on the basis of the minimization of the overall Gibbs free energy of the system. The aim of this study was to predict the influence of the various CVD parameters (T, P, initial gas mixture) on the composition of the gas phase and the coating during the process. The composition of the initial gas mixture is defined by the two parameters
=x0BCl3/x0CH4 and =x0H2/x0BCl3, where x0i are the initial mole numbers. A wide variation
range of the experimental parameters was investigated (700<T(°C)<1200; 1<P(kPa)<20; 0.1<<20; 0.1<<20) (Fig. 1). The standard enthalpies and entropies of formation of each species were taken from the Thermodata database. The mole number of each species at the equilibrium was obtained as a function of the T, P, and parameters and the yields at equilibrium were calculated with respect to the corresponding source species.
In order to anticipate possible intermediate gas species involved in the CVD process, the calculations were carried out assuming either the heterogeneous (gas + solids) or homogeneous (exclusively gas) equilibrium. The study of the homogeneous equilibrium, which can give a more realistic description of the gas phase in a hot-wall reactor under conditions of a surface kinetic regime, has not yet been used for the B-C-H-Cl system.3,8 Boron, graphite and crystalline boron carbide B
xC (the non-stoichiometry
was taken into account) were considered as the solid phases and 81 different gas species were examined.
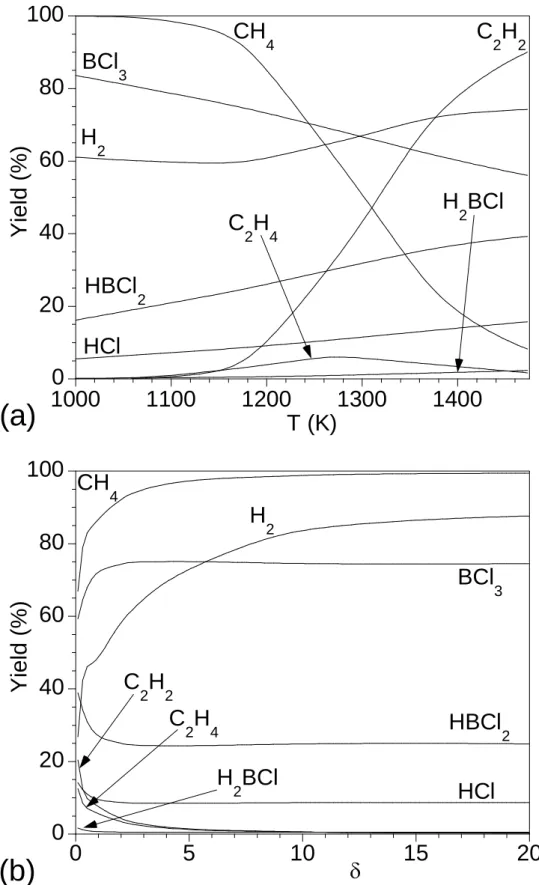
The computation results show that only the following gas species are present in significant concentrations at the homogeneous equilibrium: CH4, H2, BCl3, HBCl2, HCl,
C2H2, C2H4 and H2BCl. The thermodynamic yields of these various species, calculated as
defined in Table 1, are all higher than 1%.
As the temperature increases in the case of the homogeneous equilibrium, CH4
decomposes mainly into C2H2 and, in a lower ratio, into C2H4 (Fig. 2a). Simultaneously,
BCl3 reacts with hydrogen, yielding HBCl2 and HCl. The two main following reactions
account for the change of the gas phase at high temperature for the homogeneous equilibrium.
2 CH4 C2H2 + 3 H2 (1)
BCl3 + H2 HBCl2 + HCl (2)
Other reactions may also occur to a lesser extent, giving rise to C2H4 and H2BCl:
2 CH4 C2H4 + 2 H2 (3)
BCl3 + 2 H2 H2BCl + 2 HCl (4)
The increase of results in a decrease of the decomposition of CH4 and BCl3 and
the production of C2H2 and HBCl2 (Fig. 2b). For a given value, the higher H2/CH4 ratio
due to the increase of indeed inhibits the dehydrogenation of CH4. The higher hydrogen
concentration in the gas phase due to the increase of hinders the dehydrogenation of methane (eq. 1), whereas it promotes the decomposition of BCl3 (eq. 2) (Fig. 2c).
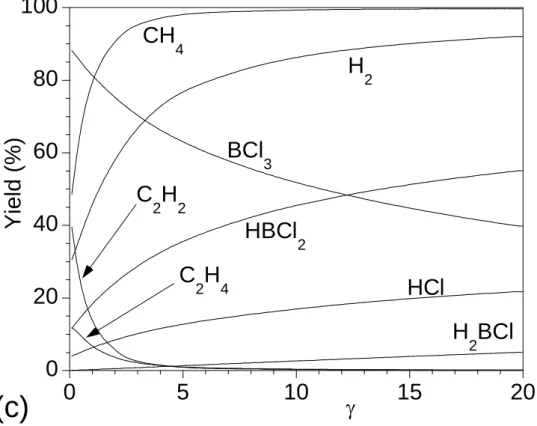
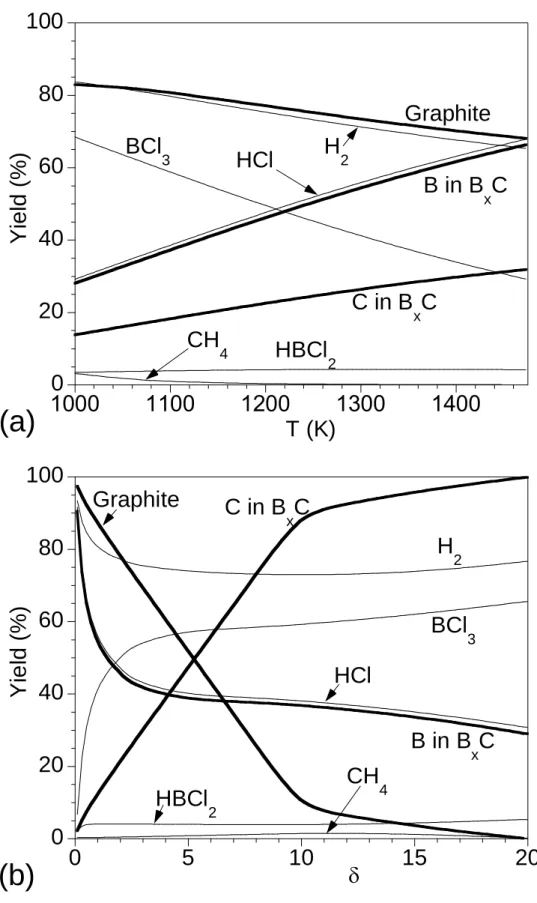
The solid obtained at the heterogeneous equilibrium almost always consists of a mixture of boron carbide (B4C) and varying amounts of graphite, except for the highest
equilibrium differs significantly from that obtained at the homogeneous equilibrium. The major species at the heterogeneous equilibrium are: H2, BCl3, HCl and HBCl2 for the gas
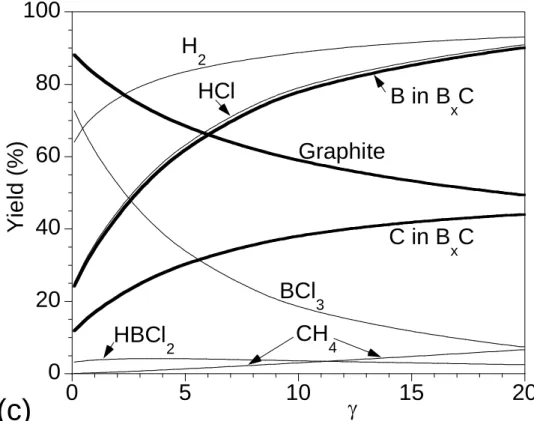
phase and boron carbide and graphite for the solid. The thermodynamic yields of the solid species were calculated as defined in Table 2. The influence of the temperature and the and parameters on the yields of the various gas and solid species is shown respectively in Fig. 3a, 3b and 3c. CH4 remains present in relatively large amounts at high
temperature for the homogeneous equilibrium, whereas it is almost fully decomposed for the heterogeneous equilibrium, to form boron carbide and graphite (Fig. 2-3). A high yield of C2H2 is observed at high temperature in the case of the homogeneous
equilibrium, whereas it is much lower for the heterogeneous equilibrium. The dehydrogenation of CH4 into C2H2 (eq. 1), which is promoted by a high temperature and
low P, and values, suggests the contribution of C2H2 as an intermediate species
involved in the CVD process. Similarly, the HBCl2 yield in the case of the heterogeneous
equilibrium is much lower than that obtained at the homogeneous equilibrium. Furthermore, the former remains almost constant, whereas the latter varies significantly with the T-P-- parameters, also supporting HBCl2 as an intermediate in the CVD of
boron carbide. HBCl2 has indeed been observed experimentally by FTIR analysis during
the CVD from the BCl3-CH4-H2 mixture.6
3 EXPERIMENTAL
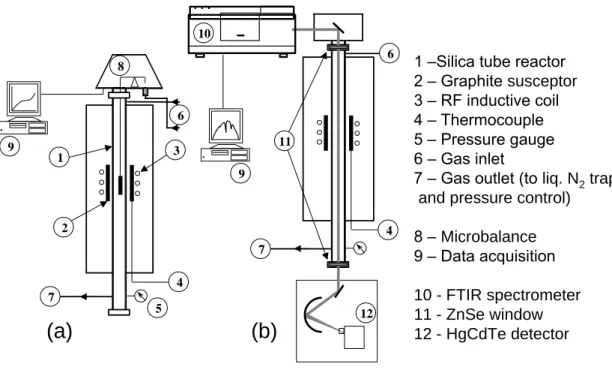
The deposition experiments were performed on graphite cylindrical substrates (10x10mm) in a low pressure hot-wall reactor (Fig. 4). The deposition chamber was a vertical silica tube heated by radio-frequency induction. The reactor was equipped with systems controlling accurately temperature, total pressure and various flow rates.
For the kinetic study, the reactor was connected to a high sensitivity microbalance to which the specimen was hung, allowing the in situ acquisition of the weight gain (Fig. 4a). The deposition rate (in gcm-2s-1) was determined assuming a constant surface area
of the specimen (4.7cm2), under stable temperature, pressure and gas flow conditions and only within a linear regime of the weight gain (the relative error is less than 0.5%, i.e., smaller than the symbol size). Temperature profiles (with an additional axial thermocouple inserted in a graphite specimen) were recorded under pure H2 and Ar flow,
prior to the CVD experiments, to assess the isothermal zone and the effective deposition temperature. The variation of the CVD rate as a function of total flow rate, temperature and initial partial pressures was used to determine the various kinetic regimes and the corresponding kinetic laws.
For the gas phase analysis, a FTIR spectrometer was coupled to the reactor (Fig. 4b). The in-situ detection of intermediate species and a semi-quantitative analysis of the gaseous mixture were performed using the transmission mode, the IR-beam going axially through the reactor. An annular porous substrate with a high specific area was also added in the hot zone, to more specifically assess the influence the heterogeneous reactions on the gas phase composition.
The deposited films were characterized in terms of chemical composition by recording Auger electron spectroscopy (AES) concentration profiles. The morphology of their free surface and fractured cross section was observed by scanning electron microscopy (SEM). X-ray diffraction (XRD) and Raman microspectroscopy were used to identify crystalline phases.
The experimental conditions were chosen compatible with the CVI process: (i) the pressure was P=12kPa ; (ii) the temperature T ranged from 750 to 1050°C ; (iii) the total
flow rate Q from 50 to 500sccm ; (iv) the initial gas phase composition (=PBCl3/PCH4 and =PH2/PBCl3) included a large excess of hydrogen, to promote the reduction of BCl3 and a
slight excess of BCl3 with respect to CH4, to adjust the stoichiometry of the boron carbide
(Fig. 1). Four typical compositions (1-4) are given in figure 1.
4 RESULTS
4-1 Kinetic study
The deposition rate R is plotted in figure 5 as a function of the total flow rate, for a total pressure of 12kPa, a temperature of 900°C and the four initial compositions of the gas phase defined in figure 1. Except for the most CH4–rich gas phase (=2; =2,
composition (4)), the total flow rate has a very low influence on the deposition rate. The kinetic process is apparently controlled by the chemical reactions, particularly for Q ranging from 250 to 500sccm. For composition (4), the decrease of R observed when Q increases could be attributed to a less reactive gas phase resulting from a decrease of the residence time. A similar behaviour has been previously reported for the CVD of pyrocarbon from propane, where the kinetics can be activated by increasing the residence time, favouring the maturation of the hydrocarbon gas phase.14 This behaviour might also be due to the less efficient heat transfer from the hot wall of the reactor towards the substrate (owing to a low thermal conductivity of a relatively H2–poor gas mixture) as the
total flow rate increases.
Arrhenius plots LnR=f(1000/T) are reported in figure 6 for the total pressure of 12kPa and the four initial compositions previously defined (Fig. 1). The deposition rate measurements were repeated, the deviation arising for the most part from changes of the
surface area of the specimen occurring mostly at high temperature (Fig. 6). In a relatively extended temperature range (i.e., between 800 and 975°C), linear curves are observed and apparent activation energies Ea can be derived, as shown in Table 3. The high values
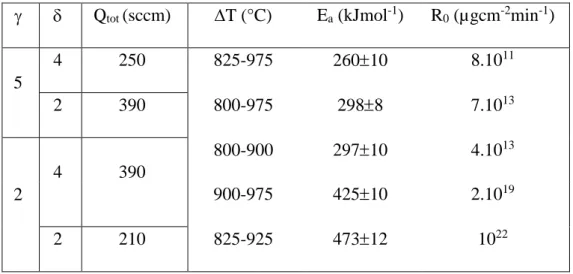
(Ea260kJ.mol-1) confirm the kinetic control by the chemical process under such conditions. The activation energies increase from composition (1) (26010kJmol-1) to composition (4) (47312kJmol-1). For composition (3), a transition is observed at about 900°C, with a marked increase of the activation energy from 29710 to 42510kJmol-1 as the temperature increases. The activation energy values reported by Hannache et al. and by Moss et al. (about 380kJmol-1) are included in the present range.10,12 A comparison of the deposition rates reveals relatively similar values except for the composition (4) showing higher values, in agreement with the corresponding R=f(Q) curve. The apparent activation energies gradually tend to zero when the temperature increases beyond T=1000°C, indicating a transition to a mass transfer regime.
Under the conditions of a chemical kinetics regime (as defined by the previous kinetic curves R=f(Q) and LnR=f(1000/T)), the apparent reaction orders with respect to the initial gaseous species (BCl3, CH4, H2) and one of the product species (HCl), can be
determined by varying a single partial pressure while keeping the others constant. The variations of the initial composition during the experiments were limited to a range inducing only a small deviation of total pressure around 12kPa. The results are shown in figure 7. The orders with respect to H2, CH4 and BCl3 are respectively nH2=0.060.06,
nCH4=1.060.16 and nBCl3=-0.420.03. Such a negative order with respect to BCl3 could
be related to a growth inhibition effect of HCl species produced by the homogeneous decomposition of BCl3 (reaction (2)).15 This is confirmed by the negative order with
respect to HCl (nHCl=-0.540.03, for the lowest partial pressures and nHCl=-1.110.02 for
the highest). The positive apparent reaction orders with respect to BCl3 reported by Moss
et al. and by Noyan Dilek et al., are not in agreement with the current value.6-12 However, the chemical kinetic regime may not be reached in the first case, owing to the too high CVD temperature, whereas in the second case, the cold-wall reactor probably hinders the homogeneous formation of inhibiting species such HCl.6-12
On the basis of these different kinetic results, a set of kinetic laws can be proposed obeying the general equation: R=R0exp(-Ea/RT)PCH4PBCl3-0,5, valid for a total pressure
close to 12kPa and where R0 and Ea depend on the initial composition and the
temperature range (Table 3).
4-2 Gas phase analysis
The gaseous species detected in situ by FTIR spectrometry were CH4, BCl3, HBCl2
and HCl. The characteristic peak areas are represented in figure 8 as a function of temperature, for P=12kPa, =4 and =5, either in the presence or without porous preform in the hot zone. It is worthy of note that the IR beam going through the whole reactor, the peak areas not only describe the gas concentrations in the hot zone but also the contribution of the inlet initial species in the upper part of the reactor and the outlet gases (products and unreacted species) in the lower part. The variation with temperature of the IR peak areas characteristic of the reactants (MTS, BCl3) is therefore underestimated with
respect to those of the intermediate species (e.g., HBCl2). The boron and carbon source
species decrease as temperature rises, from about 600°C for CH4 and 400°C for BCl3.
This result is qualitatively consistent with the homogeneous equilibrium calculated in part 2 (Fig. 2a). The initiation of the consumption of BCl3 at low temperature is directly
related to the starting production of HBCl2 and HCl (reaction (2)), in agreement with the
FTIR analyses carried out by Noyan Dilek et al.6 Conversely, the dehydrogenation of CH4 into C2H2, predicted by the homogeneous equilibrium calculation (reaction (1)), is
not observed in the present in-situ FTIR analysis, probably owing to a fast heterogeneous consumption of such a reactive hydrocarbon. The peak area of the HBCl2 intermediate
species exhibits a maximum at about 800-900°C, corresponding to the starting deposition of the solid. HBCl2 is homogeneously produced according to reaction (2) below this
temperature, whereas it is partly consumed beyond 900°C, probably through both homogeneous reaction (e.g. forming further reduced species such as H2BCl, as shown in
figure 2a) and heterogeneous reaction with a hydrocarbon, to produce boron carbide.
The various reactions described above are enhanced by the addition of a porous preform in the hot zone of the reactor. The homogeneous reactions indeed take place below 800°C (e.g. reaction (2)), while both the homogeneous and heterogeneous reactions occur above 800°C. The addition of a porous preform gives rise to a further consumption of CH4 and HBCl2, but only at temperatures beyond 800°C, corresponding
to the starting of the solid deposition. Both species can therefore be assumed to contribute rather directly to the heterogeneous process (Fig. 8a and 8c). It can also be noticed that when the temperature increases up to the highest investigated values (i.e. 1000-1050°C), the consumption of CH4 is apparently enhanced whereas that of HBCl2 tends to be
reduced.
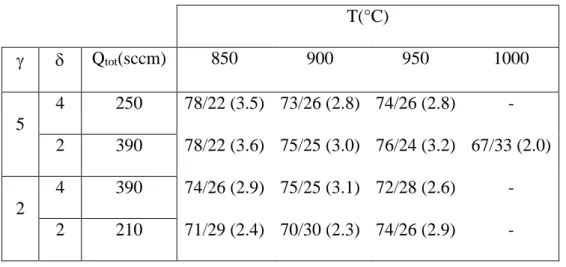
A collection of coatings was prepared, at a pressure of 12kPa and in various CVD conditions (T, Qtot, , ), to be submitted to chemical and structural analyses (Table 4).
The gas precursor compositions selected were the same as those investigated for the kinetic study and the temperature and total gas flow rate were chosen within the kinetic domain controlled by chemical reactions (Fig. 1, 5-6, Table 3-4). The average atomic concentrations of the various coatings and the B/C atomic ratio are presented in Table 4. The B/Cat ratio ranges from 2 to 3.5 for all the coatings. Such a range of B/Cat values
shows that the composition is relatively stable for all the CVD conditions investigated and reveals a carbon excess with respect to the stoichiometry of B4C. B/Cat generally
decreases when the deposition temperature increases and more especially between 950 and 1000°C, for =2 and =5. This feature can be related to the heterogeneous reactions of HBCl2, which decrease beyond 950°C (Fig. 8c), whereas the CH4 heterogeneous
reactions increase (Fig. 8a). The temperature dependence of the B/Cat ratio disagrees with
the thermodynamic study of the heterogeneous equilibrium. The calculations indeed predicted that the temperature increase, while promoting the decomposition of BCl3,
favoured the deposition of boron and, consequently, the increase of B/Cat. However, the
thermodynamic approach assumes the presence of graphite and crystalline boron carbide, while the coatings are all essentially in an amorphous state. The heterogeneous equilibrium is obviously not achieved in the CVD conditions and the influence of the temperature on the calculated yields of solid phases may not be valid in this case. The experimental effect of the gas phase composition parameters is however consistent with the thermodynamic data, the increase of both and promoting the decomposition of BCl3 and therefore, the deposition of a boron rich coating.
The morphology of the fractured coatings is homogeneous and amorphous-like for the low temperature coatings and shows an extremely fine nanotexture for the specimens
processed at the highest temperatures. The free surfaces of the coatings exhibit the same features in addition to micrometer-sized nodules, characteristic of high supersaturation CVD conditions. XRD could not evidence any organized phase. The presence of crystalline boron carbide and free aromatic carbon (with a sp2 hybridization), even in a
very disordered form, was not even revealed by Raman microspectroscopy. However, in agreement with the composition of the coatings (B/Cat<4), both free carbon and
crystalline boron carbide (B4C) phases were evidenced after a heat treatment in an inert
atmosphere beyond 1300°C.
5 DISCUSSION AND CONCLUSION
The various approaches presented here confirmed HBCl2 as an intermediate species
for the introduction of boron in the coating, during the CVD from the BCl3-CH4-H2
mixture, at 12kPa and 800-1050°C. The role of dehydrogenated hydrocarbons (such as C2H2) as carbon effective precursors, has not been directly established through the
experimental investigations. Nevertheless, a discussion on the influence of the initial composition of the gas phase can provide indications on the carbon route during the deposition process.
By moving first from composition (1) to composition (2) (Fig.1), the deposition rate increases, in agreement with the positive reaction order with respect to CH4 (Fig. 6
and 7). Simultaneously, the energy barrier is slightly increased, from 240 to about 300kJ.mol-1. This transition could be related to the contribution of a hydrocarbon intermediate species to form carbon in the solid. Such a phenomenon of dehydrogenation of carbon precursor, called maturation of the gas phase, has been recently identified by Le Poche et al.16 These authors have established that the maturation is favoured by
increasing the precursor pressure and is associated with an increase of the activation energy of the growth rate, attributed to a more complex homogeneous process. By moving from composition (2) to composition (3), the deposition rate is slightly decreased for low temperatures (i.e. T 900°C), in agreement with the negative reaction order with respect to BCl3. For composition (3), the transition at about 900°C corresponding to a
marked increase of the energy barrier (Fig. 6), can be related to the decrease of B/C atomic ratio from about 3 to 2.6. This feature might be explained by the effect of the temperature rise, favouring the dehydrogenation of carbon precursor into species like C2H2. This process gives rise to a carbon-enriched deposit obtained through a more
complex chemical route and resulting in a higher apparent activation energy. Finally, by moving from composition (3) to composition (4), the growth rate, the energy barrier and the carbon content of the deposit increase again, supporting the previous discussion.
The present work has permitted a better understanding of the deposition process of amorphous boron carbide containing a variable excess of carbon with respect to B4C. The
standard BCl3-CH4-H2 precursor was used, but under seldom investigated conditions,
compatible with the CVI of porous fibrous preforms. The kinetic laws generated are valid in a relatively large range of experimental conditions and will be useful for the overall modelling of the CVI process.
AKNOWLEDGEMENTS
The authors are indebted to CNRS and Snecma for providing the grant to J.B. They greatly acknowledge S. Bertrand and C. Descamps for valuable discussions.
REFERENCES
1- F. Lamouroux, S. Bertrand, R.Pailler and R. Naslain, Key Engineering Materials, 164-165, 365 (1999).
2- A.O. Sezer and J.I. Brand, Materials Science and Enginering, B79, 191 (2001). 3- M. Ducarroir and C. Bernard, in Proceedings of the 5th International Conference on CVD, J.M. Blochor et al., editors, p.72, The Electrochemical Society, Pennington, NJ
(1975).
4- L. Vandenbulcke, R. Herbin, M. Basutcu and J.N. Barrandon, J. Less-Common
Met., 80, 7 (1981).
5- L. Vandenbulcke, Ind. Eng. Chem. Proc. Res. Dev., 24, 568 (1985).
6- S. Noyan Dilek, H.Ö. Özbelge, N.A. Sezgi and T. Dogu, Ind. Eng. Chem. Res., 40, 751 (2001).
7- L. R. Newkirk, R. E. Riley, H. Sheinberg, F. A. Valencia and T. C. Wallace, in
Proceedings of the 7th International Conference on CVD, T. O. Sedwick et al., editors, p.
515, The Electrochemical Society, Pennigton, NJ (1979).
8- U. Jansson, J. O. Carlsson, B. Stridh, S. Soderberg and M. Olson, Thin Solid Films, 172, 81 (1989).
9- S. Lartigue, D. Cuzajous, M. Nadal and G.Male, in Proceedings of the 5th European Conference on CVD, p. 413, J. O. Carlsson and J. Lindsröm, editors, Uppsala, Sweden
(1985).
10- H. Hannache, F. Langlais and R. Naslain, in Proceedings of the 5th European Conference on CVD, p. 219, J. O. Carlsson and J. Lindström, editors., Uppsala, sweden
(1985).
12- T. S. Moss, W. J. Lackey and K. L. More, J. Am. Ceram. Soc., 81[12], 3077 (1998). 13- F. Langlais, Comprehensive Composite Materials, chap. 26, p. 611, A. Kelly and C. Zweben, editors (2000).
14- O. Féron, F. Langlais, R. Naslain and J. thebault, Carbon, 37, 1343 (1999).
15- T.M. Besmann, B.W. Sheldon, T.S. Moss and M. D. Kaster, J. Am. Ceram. Soc., 75[10], 2899 (1992).
16- H. Le Poche, X. Bourrat, M. A. Dourges, G. L. Vignoles and F. Langlais, in
Proceedings of the 5th International Conference on High Temperature Ceramic Matrix
Composites, M. Singh et al., editors, p. 81, The American Ceramic Society, Westerville,
Table captions
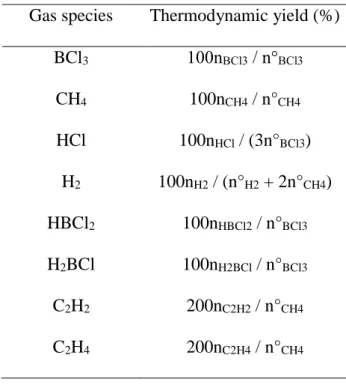
Table 1 : Thermodynamic yields of the main gas species. n°i and nj are respectively the
initial mole number of reactant i and the mole number of species j at equilibrium
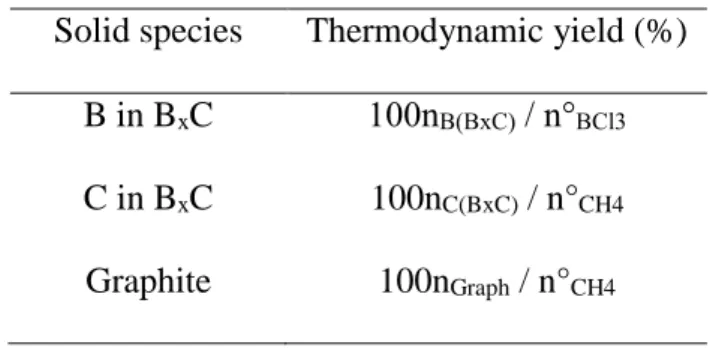
Table 2 : Thermodynamic yields of the solid species
Table 3 : Chemically controlled temperature domain (T), activation energies (Ea) and
pre-exponential constant (R0)for the various CVD condition
Gas species Thermodynamic yield (%) BCl3 100nBCl3 / n°BCl3 CH4 100nCH4 / n°CH4 HCl 100nHCl / (3n°BCl3) H2 100nH2 / (n°H2 + 2n°CH4) HBCl2 100nHBCl2 / n°BCl3 H2BCl 100nH2BCl / n°BCl3 C2H2 200nC2H2 / n°CH4 C2H4 200nC2H4 / n°CH4
Table 1 : Thermodynamic yields of the main gas species. n°i and nj are respectively the
Solid species Thermodynamic yield (%) B in BxC 100nB(BxC) / n°BCl3
C in BxC 100nC(BxC) / n°CH4
Graphite 100nGraph / n°CH4
Qtot (sccm) T (°C) Ea (kJmol-1) R0 (µgcm-2min-1) 5 4 250 825-975 26010 8.1011 2 390 800-975 2988 7.1013 2 4 390 800-900 29710 4.1013 900-975 42510 2.1019 2 210 825-925 47312 1022
Table 3 : Chemically controlled temperature domain (T), activation energies (Ea) and
T(°C) Qtot(sccm) 850 900 950 1000 5 4 250 78/22 (3.5) 73/26 (2.8) 74/26 (2.8) - 2 390 78/22 (3.6) 75/25 (3.0) 76/24 (3.2) 67/33 (2.0) 2 4 390 74/26 (2.9) 75/25 (3.1) 72/28 (2.6) - 2 210 71/29 (2.4) 70/30 (2.3) 74/26 (2.9) -
Figure captions
Fig. 1 : Ternary diagram showing the gas phase composition thermodynamically and experimentally investigated.
Fig. 2 : Calculated yields at homogeneous equilibrium (P=10kPa). (a) Influence of temperature (=2, =2), (b) influence of (T=1173K, =2), (c) influence of (T=1173K,
=2).
Fig. 3 : Calculated yields at heterogeneous equilibrium (P=10kPa). (a) Influence of temperature (=2, =2), (b) influence of (T=1173K, =2), (c) influence of (T=1173K,
=2).
Fig. 4 : CVD reactor configurations. (a) deposition rate assessment (microbalance), (b) gas phase analysis (FTIR spectrometer).
Fig. 5 : Influence of the total gas flow rate (Q) on the deposition rate R (T=900°C, Ptot=12kPa).
Fig. 6 : Influence of the temperature on the deposition rate (Ptot=12kPa).
Fig. 7 : Influence of the partial pressures (Pi) on the deposition rate (T=900°C,
Fig. 8 : Influence of the deposition temperature on the FTIR peak areas for the main gas species. (a) CH4, (b) BCl3, (c) HBCl2 and (d) HCl (Ptot=12kPa, =4, =5).
Domain Investigated
thermodynamically
H2
BCl3
CH4
3
1
2
4
Experimental CVD
conditions
=0.1
=
20
=
0
.1
=20
PBCl3 (kPa) PCH4 (kPa) PH2 (kPa)
1 4 1.9 0.5 9.6
2 5 2 1.9 0.9 9.2
3 4 3.7 0.9 7.4
4 2 2 3.4 1.7 6.9
Fig. 1 : Ternary diagram showing the gas phase composition thermodynamically and experimentally investigated.
0
20
40
60
80
100
1000
1100
1200
1300
1400
H2
T (K)
Yield (
%)
CH
4H
2BCl
3HBCl
2HCl
H
2BCl
C
2H
2C
2H
4(a)
0
20
40
60
80
100
0
5
10
15
20
CH
4H
2BCl
3HCl
H
2BCl
C
2H
2C
2H
4
Yield (
%)
(b)
HBCl
2Fig. 2 : Calculated yields at homogeneous equilibrium (P=10kPa). (a) Influence of temperature (=2, =2), (b) influence of (T=1173K, =2), (c) influence of (T=1173K,
0
20
40
60
80
100
0
5
10
15
20
CH
4H
2BCl
3HBCl
2HCl
H
2BCl
C
2H
2C
2H
4
Yield (
%)
(c)
Fig. 2 : Calculated yields at homogeneous equilibrium (P=10kPa). (a) Influence of temperature (=2, =2), (b) influence of (T=1173K, =2), (c) influence of (T=1173K,
1000
0
1100
1200
1300
1400
20
40
60
80
100
T (K)
Yield (
%)
CH
4H
2BCl
3HBCl
2HCl
Graphite
(a)
B in B
xC
C in B
xC
0
20
40
60
80
100
0
5
10
15
20
CH
4H
2BCl
3HCl
Yie
ld (%)
(b)
HBCl
2B in B
xC
C in B
xC
Graphite
Fig. 3 : Calculated yields at heterogeneous equilibrium (P=10kPa). (a) Influence of temperature (=2, =2), (b) influence of (T=1173K, =2), (c) influence of (T=1173K,
0
20
40
60
80
100
0
5
10
15
20
CH
4H
2BCl
3HBCl
2HCl
Yie
ld (%)
(c)
C in B
xC
B in B
xC
Graphite
Fig. 3 : Calculated yields at heterogeneous equilibrium (P=10kPa). (a) Influence of temperature (=2, =2), (b) influence of (T=1173K, =2), (c) influence of (T=1173K,
(a)
(b)
1 –Silica tube reactor 2 – Graphite susceptor 3 – RF inductive coil 4 – Thermocouple 5 – Pressure gauge 6 – Gas inlet
7 – Gas outlet (to liq. N2 trap and pressure control) 8 – Microbalance 9 – Data acquisition 10 - FTIR spectrometer 11 - ZnSe window 12 - HgCdTe detector 4 5 9 8 6 9 3 1 2 7 10 11 12 6 4 7
Fig. 4 : CVD reactor configurations. (a) deposition rate assessment (microbalance), (b) gas phase analysis (FTIR spectrometer).
0
1
2
3
4
5
6
0
100
200
300
400
500
600
=4 =5
=2 =5
=4 =2
=2 =2
Q (sccm)
R
(µ
g
c
m
-2m
in
-1)
1 2 3 4Fig. 5 : Influence of the total gas flow rate (Q) on the deposition rate R (T=900°C, Ptot=12kPa).
-4
-2
0
2
4
6
0.75
0.8
0.85
0.9
0.95
=4 =5
=2 =5
=4 =2
=2 =2
2
-2
1000/T (K
-1)
ln
R
(µ
g
c
m
-2m
in
-1)
1000
900
800
T(°C)
1 2 3 4-1
-0.5
0
0.5
1
1.5
-3
-2
-1
0
1
2
3
ln
R
(
µ
g
cm
-2m
in
-1)
lnP
i(kPa)
HCl
CH
4BCl
3H
2Fig. 7 : Influence of the partial pressures (Pi) on the deposition rate (T=900°C,
0
0.04
0.08
0.12
0.16
0.2
0.24
0.28
0.32
200
400
600
800
1000
CH
4(without preform)
CH
4(with preform)
P
e
a
k
a
re
a
(
a
.u
.)
T(°C)
(a)
0
5
10
15
20
200
400
600
800
1000
BCl
3(without preform)
BCl
3(with preform)
P
e
a
k
a
re
a
(
a
.u
.)
T(°C)
(b)
Fig. 8 : Influence of the deposition temperature on the FTIR peak areas for the main gas species. (a) CH4, (b) BCl3, (c) HBCl2 and (d) HCl (Ptot=12kPa, =4, =5).
0
5
10
15
20
25
30
200
400
600
800
1000
HBCl
2(without preform)
HBCl
2(with preform)
P
e
a
k
a
re
a
(
a
.u
.)
T(°C)
(c)
0
0.1
0.2
0.3
0.4
0.5
200
400
600
800
1000
HCl(without preform)
HCl(with preform)
P
e
a
k
a
re
a
(
a
.u
.)
T(°C)
(d)
Fig. 8 : Influence of the deposition temperature on the FTIR peak areas for the main gas species. (a) CH4, (b) BCl3, (c) HBCl2 and (d) HCl (Ptot=12kPa, =4, =5).