HAL Id: hal-02502307
https://hal.archives-ouvertes.fr/hal-02502307
Submitted on 16 Dec 2020
HAL is a multi-disciplinary open access
archive for the deposit and dissemination of
sci-entific research documents, whether they are
pub-lished or not. The documents may come from
teaching and research institutions in France or
abroad, or from public or private research centers.
L’archive ouverte pluridisciplinaire HAL, est
destinée au dépôt et à la diffusion de documents
scientifiques de niveau recherche, publiés ou non,
émanant des établissements d’enseignement et de
recherche français ou étrangers, des laboratoires
publics ou privés.
Distributed under a Creative Commons Attribution - NonCommercial| 4.0 International
A helical inner scaffold provides a structural basis for
centriole cohesion
Maeva Le Guennec, Nikolai Klena, Davide Gambarotto, Marine H. Laporte,
Anne-Marie Tassin, Hugo Hoek, Philipp S. Erdmann, Miroslava Schaffer,
Lubomir Kovacik, Susanne Borgers, et al.
To cite this version:
Maeva Le Guennec, Nikolai Klena, Davide Gambarotto, Marine H. Laporte, Anne-Marie Tassin,
et al.. A helical inner scaffold provides a structural basis for centriole cohesion. Science Advances ,
American Association for the Advancement of Science (AAAS), 2020, 6 (7), pp.eaaz4137.
�10.1126/sci-adv.aaz4137�. �hal-02502307�
M O L E C U L A R B I O L O G Y
A helical inner scaffold provides a structural basis
for centriole cohesion
Maeva Le Guennec1*, Nikolai Klena1*, Davide Gambarotto1*, Marine H. Laporte1*,
Anne-Marie Tassin2, Hugo van den Hoek3, Philipp S. Erdmann3, Miroslava Schaffer3,
Lubomir Kovacik4, Susanne Borgers1, Kenneth N. Goldie4, Henning Stahlberg4, Michel Bornens5,
Juliette Azimzadeh6, Benjamin D. Engel3,7†, Virginie Hamel1†, Paul Guichard1†
The ninefold radial arrangement of microtubule triplets (MTTs) is the hallmark of the centriole, a conserved organelle crucial for the formation of centrosomes and cilia. Although strong cohesion between MTTs is critical to resist forces applied by ciliary beating and the mitotic spindle, how the centriole maintains its structural integrity is not known. Using cryo–electron tomography and subtomogram averaging of centrioles from four evolutionarily distant species, we found that MTTs are bound together by a helical inner scaffold covering ~70% of the centriole length that maintains MTTs cohesion under compressive forces. Ultrastructure Expansion Microscopy (U-ExM) indicated that POC5, POC1B, FAM161A, and Centrin-2 localize to the scaffold structure along the inner wall of the centriole MTTs. Moreover, we established that these four proteins interact with each other to form a complex that binds microtubules. Together, our results provide a structural and molecular basis for centriole cohesion and geometry.
INTRODUCTION
Centrioles and basal bodies (hereafter referred to as centrioles) are conserved organelles characterized by a ninefold radial arrangement of microtubule triplets (MTTs). Centrioles template assembly of motile and sensory cilia and constitute the core structure of the centrosome, which organizes microtubule arrays during both interphase and cell division (1). While performing these crucial cellular functions, the centriole is subjected to physical forces that it must resist. Ciliary beat-ing transmits forces that have been shown to disrupt centrioles in Tetrahymena mutants lacking the centriolar proteins POC1 (Proteome of the Centriole 1) and FOP1 (FGFR1 Oncogenic Partner 1) (2–4). Similarly, pushing and pulling forces applied on centrosomes during mitosis have been shown to disintegrate human centrioles following antibody blocking of tubulin glutamylation (5). Together, these studies demonstrate that MTT assembly and cohesion are both required for centriole stability during fundamental cellular processes.
How are the centriole’s MTTs attached to each other? At the proxi-mal end, adjacent MTTs are connected through the A-C linker (Fig. 1A) (6, 7). At the central and distal regions, the core of the centriole is lined with a circular inner scaffold interconnecting the MTTs (Fig. 1A) (6), described as “peripheral fibers” in Paramecium tetraurelia (8), “connecting bridges” in Labyrinthula (9), or a “ring of links” in mammals, including humans (10). More recent studies using cryo–electron tomography (cryo-ET) on isolated Chlamydomonas reinhardtii and mammalian centrioles revealed the presence of Y-shaped (11) and
L-shaped (12) linkers, respectively, along the central/distal MTTs. Both structures have been proposed to be part of an inner scaffold that stabilizes the entire centriole. Despite these observations, the architecture, conservation, and protein composition of the inner scaffold remain a mystery, limiting our understanding of centriole cohesion. RESULTS
Here, we used cryo-ET to chart the architecture of centrioles from four evolutionary distant species to assess structural conservation. We examined centrioles isolated from P. tetraurelia, human lympho-blastic KE-37 cells, and Naegleria gruberi, as well as centrioles in situ within native C. reinhardtii cells thinned by focused ion beam milling (13). For each species, we quantified the proportion of the centriolar lumen covered by the inner scaffold compared to the A-C linker. Both types of structures were present in the four species with similar organization along the centrioles (Fig. 1, A to C, and fig. S1). On average, the A-C linker occupied the proximal 35 to 44% of the total length, while the inner scaffold covered the central/distal 62 to 71% of the centriole, with a maximum coverage of 85% in humans (Fig. 1C). Although the distal 40% of human centrioles consisted of micro-tubule doublets (MTDs), the inner scaffold spanned the whole region (fig. S2), indicating that it can also link MTDs.
To understand whether the inner scaffold can counter external forces to maintain centriole cohesion, we measured the variable deformation that isolated centrioles experience during cryo–electron microscopy (cryo-EM) grid preparation (14). We observed that upon slight compression of P. tetraurelia centrioles, the inner scaffold was distorted but remained attached to the MTTs (Fig. 1, D and E). This behavior of the inner scaffold was also observed in the human and N. gruberi centrioles, despite the massive compression in these samples (figs. S1, B and G, and S3, A to C). We found that 26% of total MTTs from the central region of the P. tetraurelia centrioles were damaged, in stark contrast to the proximal region, which dis-played 58% damaged MTTs (Fig. 1F). This suggests that the inner scaffold better resists external forces than the proximal A-C linker. In addition, we observed that the circumference of the centriole’s
1University of Geneva, Department of Cell Biology, Sciences III, Geneva, Switzerland. 2Institute for Integrative Biology of the Cell (I2BC), CEA, CNRS, Univ. Paris Sud, Université Paris-Saclay, 1 Avenue de la Terrasse, 91198 Gif-sur-Yvette, France. 3Department of Molecular Structural Biology, Max Planck Institute of Biochemistry, Am Klopferspitz 18, 82152 Martinsried, Germany. 4Center for Cellular Imaging and NanoAnalytics (C-CINA), Biozentrum, University of Basel, Basel CH-4058, Switzerland. 5Institut Curie, PSL Research University, CNRS-UMR 144, 75005 Paris, France. 6Université de Paris, Institut Jacques Monod, CNRS UMR7592, 75013 Paris, France. 7Helmholtz Pioneer Campus, Helmholtz Zentrum München, Ingolstädter Landstraße 1, 85764 Neuherberg, Germany.
*These authors contributed equally to this work.
†Corresponding author. Email: ben.engel@helmholtz-muenchen.de (B.D.E.); virginie. hamel@unige.ch (V.H.); paul.guichard@unige.ch (P.G.)
Copyright © 2020 The Authors, some rights reserved; exclusive licensee American Association for the Advancement of Science. No claim to original U.S. Government Works. Distributed under a Creative Commons Attribution NonCommercial License 4.0 (CC BY-NC). on December 16, 2020 http://advances.sciencemag.org/ Downloaded from
S C I E N C E A D V A N C E S
|
R E S E A R C H A R T I C L E
central region decreased without breaking (fig. S3D), highlighting that it can handle compression to maintain a cohesive structure. Furthermore, we found that in broken P. tetraurelia centrioles, the MTTs remained bound together by the inner scaffold (fig. S3E). Together, these observations demonstrate that the inner scaffold structure can adapt its shape to maintain MTT cohesion when the centriole is subjected to forces.
To test whether the position of the inner scaffold is correlated with specific geometrical features of the centriole, we plotted the twist angles of the MTTs from proximal to distal (Fig. 1, G to I) along uncompressed isolated P. tetraurelia and in situ C. reinhardtii centrioles (movies S1 and S2). We found that the MTT angle differed substantially between the proximal and distal regions, echoing the
presence of the two different MTT-bridging structures. The MTT angle in the proximal region, which is occupied by the A-C linker, steadily decreased from ~115° to ~106° in P. tetraurelia and from ~120° to ~109° in C. reinhardtii as the MTTs progressed toward the distal direction. Upon reaching the central and distal regions, the MTT angle remained fixed at ~100° in P. tetraurelia and ~103° in C. reinhardtii (Fig. 1, H and I), suggesting that the inner scaffold realigns the MTTs before cilia extension. Moreover, as previously described for isolated human centrioles (15), we observed that the C. reinhardtii centriole’s diameter was narrower on the proximal and far-distal sides but wider along the central core region (fig. S3, F and G), possibly reflecting intrinsic opposite forces applied on the centriole barrel (fig. S3H). Together, these observations suggest that MTT
Fig. 1. A circular scaffold inside the centriole resists deformation forces to help hold MTTs together. (A) Cryo–electron tomogram of a P. tetraurelia centriole showing the entire structure in longitudinal view (left) and ninefold symmetrized cross sections from two regions along its length (right). Orange, inner scaffold; turquoise, A-C linker. (B and C) Comparison of four species: (B) position along the centriole of the different MTT-attached structures and (C) percentage of the centriole covered by each structure. LECA, last eukaryotic common ancestor; Orange, inner scaffold; turquoise, A-C linker; gray, microtubule wall. Each dot in (C) is a different centriole. Error bars denote SD. N = 35 (P. tetraurelia), N = 6 (C. reinhardtii), N = 11 (N. gruberi), and N = 12 (human). (D and E) Cryo-ET cross sections through com-pressed P. tetraurelia centrioles (left) with corresponding schematic representations (right). Orange arrowheads indicate the inner scaffold attached to the MTTs. (F) Percentage of total P. tetraurelia centrioles (compressed and uncompressed) that are intact (black), have partially detached MTTs (white), or are broken (gray) in the central (N = 90 centrioles) and proximal (N = 72 centrioles) regions. (G) Schematic top views of a centriole at different cross sections showing the change in MTT orientation. Orange, inner scaffold; turquoise, A-C linker; gray, cartwheel. (H and I) MTT twist angle along the centriole length in P. tetraurelia (H) and in C. reinhardtii (I). Note that the A-C linker and the inner scaffold overlap in the region spanning 30 to 40%. Scale bars, 100 nm. n.s., not significant. *0.01 < P < 0.05; **0.001 < P < 0.01; ***0.0001 < P < 0.001; **** P < 0.0001.
on December 16, 2020
http://advances.sciencemag.org/
geometry is evolutionarily conserved and directed by the different MTT-linking structural elements along the centriole’s length.
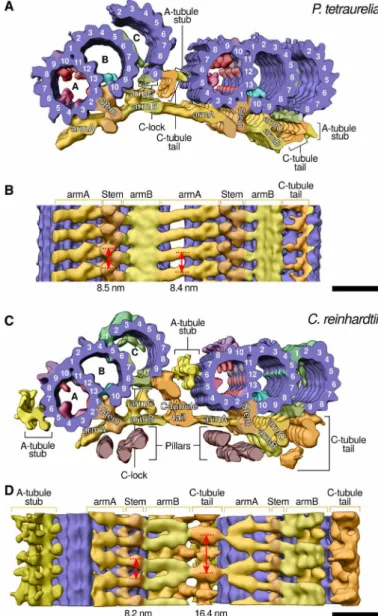
A key prediction is that the Y- and L-shaped linkers, previously observed in C. reinhardtii and mammalian centrioles (11, 12), compose parts of the circular inner scaffold. We took advantage of our un-compressed P. tetraurelia and C. reinhardtii centrioles to generate independent subtomogram averages of the MTTs and the connec-tions between them and then used the common structural features to reconstruct the full inner scaffold from both species (Fig. 2 and figs. S4 to S6). In P. tetraurelia, the scaffold region bound to the MTT was reminiscent of the Y-shaped linker described in C. reinhardtii, with a stem that attaches to the neighboring A1/A2 and B10 proto-filaments and three arms that extend from this stem: armA, armB, and armC (Fig. 2A) (11). Because of the compression, the subtomogram averaging of MTTs from N. gruberi and human centrioles could only resolve the stem and armA of the inner scaffold (fig. S6). How-ever, these averages were sufficient to confirm that the stem of the inner scaffold binds the MTTs at the same conserved position in all four species.
Our complete reconstructions from uncompressed centrioles enabled us to resolve how the inner scaffold links MTTs together to maintain centriole cohesion. In P. tetraurelia, armB from one MTT connects to armA from the adjacent MTT, while in C. reinhardtii, the junction is formed through the C-tubule tail, which inserts between armB and armA (Fig. 2). This junction seems to be further strengthened by a connection between the C-tubule tail and the A-tubule stub from the adjacent MTT. Lateral views along the centriole revealed that the two inner scaffolds have different periodicities of ~8.5 nm for P. tetraurelia and 8.2 nm/16.4 nm for C. reinhardtii (Fig. 2, B and D, and fig. S6). These structures suggest that, despite some differences, the inner scaffold has been conserved through evolution, highlighting its potentially crucial role in MTT cohesion and elongation.
To visualize how the complete architecture of the inner scaffold is organized within the centriole, we assembled the entire uncompressed central cores of the P. tetraurelia and C. reinhardtii centrioles (Fig. 3). We found that the inner scaffold forms an extended helix, with a diameter of 155 nm in P. tetraurelia and 165 nm in C. reinhardtii, attached to MTTs along the inner wall of the centriole (Fig. 3, movies S3 and S4, and fig. S7, A to H). Measurement of the helical parameters from both species revealed species-specific variations around a common theme: P. tetraurelia contains a two-start helix with a pitch of 17 nm, whereas C. reinhardtii contains a three-start helix with a pitch of 49.5 nm (Fig. 3, B to D and F to H). Both scaf-folds form a dense lattice along the inner centriole wall, linking the MTTs together all along the centriolar length (Fig. 3, I and J, and movies S5 and S6). This extensive mesh-like structure may explain why centrioles exclude large cytoplasmic macromolecules such as ribosomes and why disruption of centriolar cohesion allows cyto-plasm to infiltrate the centriole lumen (3).
To complement the cryo-ET, we set out to uncover the identities of the proteins that compose the inner scaffold by using an optimized Ultrastructure Expansion Microscopy (U-ExM) protocol to localize proteins with nanoscale precision in human cells (Fig. 4 and fig. S8, A and B; see Material and Methods) (16). We examined POC5, POC1B, Centrin-2, and FAM161A, centriole components that have been im-plicated in retinal degeneration due to loss of photoreceptor cilia integrity (17–20). POC5 is a conserved protein required for centriole assembly and elongation (21); its depletion leads to short centrioles
lacking the entire central-distal region. POC1 ensures proper MTT linkages in Tetrahymena (2) and centriole integrity in humans (22). POC5 and POC1B have been shown to interact with Centrin-2 (21) and FAM161A (18), respectively. We found that, in contrast to the proximal cartwheel protein HsSAS-6, the distal appendage protein Cep164, and the distal cap protein CP110 (Fig. 4, A and C, and fig. S10, A to D), all four proteins localize within the central core of the human centriole close to the MTT wall (Fig. 4, B and D to G, and figs. S8, C to L, S9, and S10). Consistent with cryo-ET of the
Fig. 2. Subtomogram averaging from uncompressed P. tetraurelia and C. reinhardtii centrioles reveals how the inner scaffold links adjacent MTTs. Cryo-ET recon-structions of the inner scaffold and MTT structure from (A and B) P. tetraurelia and (C and D) C. reinhardtii. (A and C) Top views showing the centrioles in cross section. Purple, MTT protofilaments; yellow/orange, inner scaffold including densities that correspond to the C. reinhardtii Y-shaped linker; pink/red, A-microtubule MIPs (microtubule inner proteins); lavender, structures attached to the A-microtubule seam (between A9 and A10); turquoise, B-microtubule MIPs; green, structures attached to the C-microtubule. (B and D) Lateral views from the centriole interior showing adjacent MTTs connected by the inner scaffold; color code described above. Scale bars, 20 nm.
on December 16, 2020
http://advances.sciencemag.org/
S C I E N C E A D V A N C E S
|
R E S E A R C H A R T I C L E
Fig. 3. The inner scaffold forms a dense helical lattice. (A and E) Three-dimensional (3D) views of the ninefold symmetric central regions from (A) P. tetraurelia and (E)
C. reinhardtii centrioles. Purple, MTTs; orange, inner scaffold. (B and F) Unrolled structures of the (B) P. tetraurelia and (F) C. reinhardtii centrioles. Pink, multiple repeats of one helix. In P. tetraurelia, the complete lattice of the inner scaffold is a two-start helix, with a periodicity of 17 nm that allows a second helix (orange) to fit within the scaffold. In C. reinhardtii, the inner scaffold lattice is a three-start helix, with a periodicity of 49.5 nm that allows two other helices (orange) to fit within the scaffold. (C, D, G, and H) Helical parameters of the (C and D) P. tetraurelia and (G and H) C. reinhardtii inner scaffolds shown in (C and G) 3D and (D and H) unrolled schematic views, colored as in (B) and (F). (I and J) Longitudinal sections through 3D models of the full-length (I) P. tetraurelia and (J) C. reinhardtii central regions. Scale bars, 50 nm.
on December 16, 2020
http://advances.sciencemag.org/
human inner scaffold (Fig. 1, B and C), all four proteins span 66 to 79% of the centriolar length, with Centrin-2 displaying an additional distal localization (Fig. 4, G and H, and figs. S8, I and J, and S10D). By simulating a U-ExM signal from the cryo-EM map and comparing the diameter of localization along the centriole cross section, we found that all four proteins had a similar diameter to the inner scaffold, suggest-ing that they might be components of this structure (Fig. 4, I to K, and fig. S9). Furthermore, we demonstrated that FAM161A binds microtubules in vivo (23) and acts as a scaffold that can separately recruit POC1B and the POC5/Centrin-2 complex (Fig. 5, A to I).
We also identified by coimmunoprecipitation that POC5 interacts with both FAM161A and POC1B (Fig. 5J), suggesting that the four proteins form a microtubule-associated complex, a defining feature of the inner scaffold structure (Fig. 5, K and L).
DISCUSSION
In summary, our study reveals the structure of a conserved dense mesh-like inner scaffold within the central barrel of the centriole that resembles a helical lattice. We propose that this lattice results
Fig. 4. Molecular composition of the inner scaffold revealed by U-ExM. (A to C) Representative confocal images of in situ human centrosomes in U-ExM stained for tubulin (magenta) together with (A) HsSAS-6 (green), (B) FAM161A (green), or (C) CP110 (green). Note the mature centrioles (M) with their respective procentrioles (P). Insets show procentrioles from the dashed boxes. Scale bar, 200 nm. (D to G) Representative confocal images of in situ mature centrioles in U-ExM (longitudinal view) stained for tubulin (magenta) together with (D) POC1B (cyan), (E) FAM161A (green), (F) POC5 (yellow), or (G) Centrin-2 (gray). Dt, distal tip; C, central core; P, proximal region. Scale bar, 100 nm. (H) Position of each stained protein along the centriole with their respective percentages of centriole coverage. Error bars denote SD. Averages and SDs are as follows: POC1B, 67 ± 13% (N = 56); FAM161A, 64 ± 11% (N = 58); POC5, 65 ± 1% (N = 57); and Centrin-2, 79 ± 11% (N = 59). (I) Representative top view confocal images of human centrioles in U-ExM stained as described above. Scale bar, 100 nm. (J) Ninefold symmetrized images of the indicated conditions from (I). For comparison, simulated U-ExM signal for the inner scaffold (turquoise) and tubulin (magenta) was generated from the cryo-EM structure. (K) Average positions of fluorescent molecular labels for tubulin (magenta), POC1B (cyan), FAM161A (green), POC5 (yellow), and Centrin-2 (gray) superimposed on the centriole structure, seen in top view. The position of the inner scaffold is depicted in dashed black lines, and the width of its simulated U-ExM signal is in gray (related to fig. S10, D and E). Gray box, zoom in of (K). Scale bar, 20 nm.
on December 16, 2020
http://advances.sciencemag.org/
S C I E N C E A D V A N C E S
|
R E S E A R C H A R T I C L E
Fig. 5. FAM161A, POC5, POC1B, and Centrin form a complex that binds microtubules. U2OS cells transfected with (A) mCherry-FAM161A, (B) GFP-POC5, (C) mCherry-FAM161A and GFP-POC5, (D) GFP-POC1B, (E) mCherry-FAM161A and GFP-POC1B, (F) GFP–Centrin-2, (G) mCherry-FAM161A and GFP–Centrin-2, (H) mCherry-POC5 and GFP–Centrin-2, and (I) mCherry-FAM161A and both GFP–Centrin-2 and mCherry-POC5. Note that POC1B and POC5, but not Centrin-2, are relocalized to microtubules when cotransfected with FAM161A. GFP–Centrin-2 is relocalized to FAM161A-decorated microtubules only in the presence of POC5, indicating that the three proteins form a complex, with POC5 mediating the interaction between Centrin-2 and FAM161A. Scale bar, 10 m. Percentage of GFP/mCherry-positive cells with proteins localized to cytosol (Cyt.) or microtubules (MT) for each condition. Averages and SDs are as follows: (A) Cyt.: 11 ± 1.2; MT: 89 ± 1.2, (B) Cyt.: 100; MT: 0, (C) Cyt.: 7 ± 1.0; MT: 93 ± 1.0, (D) Cyt.: 100; MT: 0, (E) Cyt.: 7 ± 1.6; MT: 93 ± 1.6, (F) Cyt.: 100; MT: 0, (G) Cyt.: 100; MT: 0, (H) Cyt.: 100; MT: 0, and (I) Cyt.: 1 ± 0.7; MT: 99 ± 0.7 (for each protein). N = ~100 cells per condition from three independent experiments. (J) Coimmunoprecipitation assay in human embryonic kidney (HEK) cells cotransfected with GFP-FAM161A and mCherry-POC5 (top), GFP–Centrin-2 and mCherry-FAM161A as a negative control (middle), or GFP-POC5 and mCherry-POC1B (bottom). I, input; U, unbound; GFP-IP, immunoprecipitated material. Samples were run on a 4 to 20% gradient gel and transferred to polyvinylidene difluoride membranes before immuno-blotting against GFP and mCherry. Data are from three independent experiments. (K) Full cryo-EM structural model of the centriole, with the inner scaffold covering 70% of the total length. The U-ExM localization of each inner scaffold protein is superimposed on the model as in Fig. 4K. Scale bar, 20 nm. (L) Schematic of the molecular interactions within the complex formed by FAM161A, POC1B, POC5, and Centrin-2, overlaid on the structural model of the inner scaffold seen in top view. Asterisks indicate coimmunoprecipitation results from this study.
on December 16, 2020
http://advances.sciencemag.org/
from a long-range helical order; however, it should be noted that it could also arise from locally ordered regions. We further propose that we have identified four of the scaffold’s main molecular com-ponents using a combination of U-ExM, microtubule recruitment assays, and coimmunoprecipitation. The depletion phenotypes of POC1B and POC5 suggest that the inner scaffold is crucial for centriole biogenesis and integrity. We propose that the apparent helical nature of the scaffold’s dense lattice can provide the structural flexibility and strength needed to maintain MTT cohesion and geometry. Moreover, each of the proteins that we localized to the position of the inner scaffold has been associated with human retinal disorders, which lead to photoreceptor degeneration and vision loss. This functional connection sheds additional light on the importance of the inner scaffold structure.
MATERIALS AND METHODS
P. tetraurelia cortical unit preparation
Two P. tetraurelia strains were used: the d4-2 wild-type reference strain and -CenBP1. Cells were grown exponentially at 27°C in a wheat grass infusion (BHB medium), bacterized with Klebsiella pneumoniae, and supplemented with -sitosterol (0.4 g/ml). Cells were centrifuged for 2 min at 137g using a Sigma 6-15 centrifuge and washed twice in Dryl buffer to remove most of the bacteria. Trychocysts were removed by tris CaCl2 buffer [10 mM (pH 7.4) and CaCl2 1 mM] supplemented with 0.025% of amino-ethyldextran. Cells were recovered by centrifu-gation, and P. tetraurelia cortex was prepared according to (24) with the following modifications: Cells were resuspended in an equal volume of lysis buffer containing 0.25 M sucrose, 1 mM Hepes (pH 7.2), 5 mM EGTA, and 2× protease inhibitors (Roche cOmplete) and transferred to a Potter-Elvehiem homogenizer and then left for 15 min on ice. About 400 hand strokes were required to break open >95% of cells. After lysis, 1 M K-PIPES (pH 7.2) was added to obtain a final concentration of 10 mM K-PIPES. Cell cortex was washed twice in resuspension buffer containing lysis buffer with 10 mM K-PIPES and recovered by centrifugation at 410g in a refrigerated Eppendorf centrifuge. Cell cortex was resuspended in 500 l of the same buffer. To obtain cortical units, the cortex was sonicated for 5 s on ice with 1-s effective pulse and 1-s pause at 30% of amplitude using a Vibra-Cell Processor. Cortical units were stored in 10 mM K-PIPES 60% sucrose (w/w) at −80°C.
The quality of the cortex and cortical units was verified by immunofluorescence after sedimentation at 10,000g for 15 min in a swinging rotor (Beckman JS-13.1) onto glass coverslips in 15-ml Corex tubes equipped with adaptors as previously described (25). Cortical units were stained using an anti-epiplasmin, and centrioles were stained using ID5 antibody. Since both antibodies were produced in mice and both recognize distinct structures, the antibodies were added sequentially.
P. tetraurelia centriole cryo-ET
P. tetraurelia centrioles were diluted 1:5 in 10 mM K-PIPES supple-mented with 10-nm colloidal gold beads (Aurion). Centrioles were deposited on 300-mesh lacey carbon grids (Electron Microscopy Sciences), blotted from the backside, and vitrified in liquid ethane by manual plunge freezing. Grids were transferred to a 300-kV FEI Titan Krios transmission electron microscope (Center for Cellular Imaging and NanoAnalytics, Biozentrum, University of Basel) equipped with a Gatan K2 Summit direct electron detector. Single-axis tilt
series were acquired using SerialEM (26), with 2° increments from approximately −60° to +60° (bidirectional, separated at 0°). Magnifica-tion was ×29,000 with an object pixel size of 3.45 Å and a cumulative dose of 70 to 120 electrons/Å2.
C. reinhardtii cell culture
In situ cryo-ET of C. reinhardtii centrioles was performed in the mat3-4 strain (CC-3994) (27) acquired from the Chlamydomonas Resource Center, University Minnesota, MN. This strain has smaller cells (~5 m in diameter), which improves vitrification and increases the proba-bility of hitting a centriole by focused ion beam (FIB) milling. Cells were grown in tris-acetate-phosphate medium, bubbled with normal atmo-sphere, and exposed to constant light (~90 mol photons m−2 s−1).
C. reinhardtii cell vitrification and cryo-FIB milling
When cell cultures reached mid-log phase, they were vitrified with a Vitrobot Mark 4 (FEI Thermo Fisher Scientific). The cell culture (4 l of ~1000 cells/l) was blotted from the backside onto 200-mesh copper EM grids coated with holey carbon (R2/1, Quantifoil Micro Tools) and plunge-frozen in a liquid ethane/propane mixture. Cryo-FIB sample preparation was performed as previously described (13) using either a FEI Scios or FEI Quanta dual-beam FIB/scanning EM instrument. EM grids were mounted into AutoGrid support rings (FEI Thermo Fisher Scientific), loaded into the FIB using a cryo-shuttle, and then coated with an organometallic platinum layer using a gas injection system (FEI Thermo Fisher Scientific). Cells were thinned in multiple steps with a gallium ion beam to produce ~100- to 200-nm-thick cellular sections (lamellas).
C. reinhardtii cryo-ET
EM grids were transferred into a 300-kV FEI Titan Krios transmission electron microscope (Department of Molecular Structural Biology, Max Planck Institute of Biochemistry), equipped with a post-column energy filter (Quantum, Gatan) and a direct detector camera (K2 Summit, Gatan). Using SerialEM software (26), tilt series were acquired with 2° steps between −60° and + 60° (bidirectional, separated at −0° or −20°). In addition, a dose-symmetric tilt scheme was implemented for a subset of acquired centrioles (28). Individual tilts were recorded in movie mode at 12 frames/s, at an object pixel size of 3.42 Å and a defocus of −5 to −6 m. The total accumulated dose for each tilt series ranged between 80 and 130 electrons/Å2 depending on sample thickness. Several different cell cultures and imaging sessions were used to produce the dataset. Each in situ tomogram was acquired from a separate C. reinhardtii cell and thus is both a biological and technical replicate.
N. gruberi cell culture and differentiation
N. gruberi cells (NEG strain; provided by C. Fulton, Brandeis University) were differentiated from amoebae into flagellates using a standard protocol (29). Amoebae were grown on solid media with Klebsiella bacteria as a food source overnight at 30°C until plates were ~80% clear of bacteria. Ice-cold differentiation buffer [2 mM tris (pH 7.2) and 10 mM NaCl] was added to the plates, and cells were scraped off with a glass spreader and poured into 50-ml plastic conical tubes. Using an International Equipment Company CLINICAL (IEC model CL) centrifuge modified with a hand brake, amoebae were pelleted for 1 min and then rapidly washed twice with ice-cold differ-entiation buffer (resuspended by vortexing and pelleted for 45 s) to remove the bacteria. The amoebae were then resuspended in 25°C
on December 16, 2020
http://advances.sciencemag.org/
S C I E N C E A D V A N C E S
|
R E S E A R C H A R T I C L E
differentiation buffer, which was placed in a 1-liter Erlenmeyer flask and shaken at 100 Hz in a 25°C water bath. To ensure synchronous differentiation (which was confirmed by phase-contrast microsco-py of cells stained with Lugol’s iodine), the time from scraping the cells to shaking them in the water bath was kept below 10 min.
Isolation and vitrification of N. gruberi centrioles
Centrioles were isolated between 50 and 100 min following the initiation of differentiation to acquire centrioles in different states of assembly (30). Pairs of centrioles assemble in tandem, with the first centriole completing assembly 5 to 10 min before the second centriole (31). Between 60 and 70 min after initiation of differentiation, the centrioles dock at the plasma membrane and initiate ciliogenesis. For this study of MTTs architecture, we only analyzed mature centrioles that had begun to grow the MTDs of the ciliary axoneme.
The centriole isolation protocol was adapted from several previous studies (14, 32, 33). Cells were resuspended in lysis buffer [15 mM tris (pH 7.5), 10 mM KCl, 2 mM MgSO4, 1.5 mM EGTA, 1 mM dithiothreitol, Roche cOmplete EDTA-free protease inhibitor cocktail, and 0.1% Triton X-100] and lysed with 5 to 10 strokes in a Dounce homogenizer (complete cell lysis was confirmed with a phase-contrast microscope before proceeding). Nuclei and large cell debris were removed by spinning the lysate onto a 25% sucrose cushion at 1000g for 15 min. The supernatant and interface were diluted in wash buffer (lysis buffer without detergent) in a round-bottom Oak Ridge tube and pelleted in a Sorvall HB-4 swinging bucket rotor at 10,000g for 30 min. The pellet was resuspended in 10 ml of wash buffer and loaded on top of a discontinuous 40%/50% sucrose gradient in an Oak Ridge tube, which was centrifuged in the HB-4 rotor at 16,000g for 90 min (no brake). Using illumination from the bottom of the tube and a syringe with a long needle, ~5 ml was extracted from the 40%/50% interface and resuspended in wash buffer and then pelleted again in an Oak Ridge tube spun at 10,000g for 30 min. The pellet was resuspended in a small volume (~30 l) of wash buffer supple-mented with 10-nm colloidal gold [bovine serum albumin (BSA) suspension, Aurion]. Using a Vitrobot Mark 4 (FEI Thermo Fisher Scientific), 5 l of this sample was blotted onto 200-mesh copper EM grids coated with holey carbon (R3.5/1, Quantifoil Micro Tools) and plunge-frozen in a liquid ethane/propane mixture.
N. gruberi cryo-ET
EM grids were transferred as described in the C. reinhardtii cryo-ET section. Tilt series were acquired similarly. Individual tilts were recorded in movie mode at 10 frames/s, with an object pixel size of 4.21 Å and a defocus of −5 to −8 m. The cumulative dose for each tilt series was ~80 to 120 electrons/Å2. Several different cell cultures and imaging sessions were used to produce the dataset. Each pair of centrioles came from a separate cell and thus can be considered a biological replicate.
Human centriole isolation
Human centrioles were isolated from the lymphoblastic KE-37 cell line as previously described (25) but modified as follows. After centriole sedimentation on a 60% sucrose cushion by centrifugation, the top third of the volume of the centrifugation bottle was removed by aspiration, leaving 20 to 25% sucrose in a volume of approximately 25 ml. The 60% sucrose cushion containing isolated centrioles was then resuspended until the sucrose was no longer visible by gentle pipetting. The final sucrose concentration was 30%. Aliquots (500 μl)
were flash-frozen in liquid nitrogen and stored at −80°C. The centriole isolation efficiency was verified by immunofluorescence.
Human centriole cryo-ET
As previously described (14), a 500 l aliquot fraction was first resuspended in 1 ml of 10 mM K-PIPES (4°C, pH 7.2) and sub-sequently centrifuged at 10,400g for 10 min at 4°C. The pellet contain-ing the centrioles was resuspended in 20 l of 10 mM K-PIPES and further diluted with 10 l of 10-nm colloidal gold beads (Aurion). Five microliters of the sample was then deposited on 300-mesh lacey carbon grids (Electron Microscopy Sciences), blotted from the backside, and vitrified in liquid ethane by manual plunge freezing. Grids were transferred as described above. Single-axis tilt series were acquired using SerialEM at 2° increments with a bidirectional scheme from approximately −60° to +60° separated into halves at −20°. Individual tilts were recorded in movie mode at 10 frames/s. Magnification was ×42,000 with an object pixel size of 3.42 Å and cumulative dose of ~120 electrons/Å2.
Subtomogram averaging
All tilt-series frames were aligned using MotionCor2 (34) using either 3 × 3 patches or whole-frame alignment. Subsequently, all tomograms from all species were reconstructed using etomo, part of the IMOD package (35). The contrast transfer function (CTF) of tomograms was corrected using CTFplotter and CTFphaseflip tools from IMOD. To generate subtomograms of MTTs, A- and C-microtubules were picked along each MTT, generating nine sets of A-C paired coordinates along the centriole’s central region, always from proximal side to distal side. On the basis of the periodicity observed in the Trichonympha proximal MTTs and on our analysis of central region periodicities (fig. S1), we decided to extract subtomograms every 17 nm to restrict structural redundancy while maintaining the complete periodic unit. Using a homemade Python script, the positions of the B-microtubules were interpolated following user- defined MTT periodicities and orientations. The positional information was required to know the coordinates for subtomogram extraction (as the B-microtubule roughly corresponds to the center of the MTTs), and the rotations were required to prealign all subtomograms in the same orientation (starting Euler angles for alignment). These rotations values are referred later as “pre-alignment parameters.” Subtomograms were organized in a .tbl format and then extracted, aligned, and averaged using Dynamo (36). The number of subtomograms, dimensions, and initial reference were specific to each species.
For the P. tetraurelia MTTs, 1693 subtomograms of 288 × 288 × 288 voxels were extracted from 14 uncompressed centrioles. For the C. reinhardtii MTTs, 1546 subtomograms of 296 × 296 × 296 voxels were extracted from 11 centrioles. For the N. gruberi MTTs, 1168 sub-tomograms of 260 × 260 × 260 voxels were extracted from seven centrioles. These three datasets were initially aligned using the ex vivo C. reinhardtii central core MTTs as a starting reference (emd-5252, 18). After a few iterations, they were aligned to their respective average maps that were generated in each round. The iterations were per-formed on binned two data, and the final shifts and rotations values obtained were applied on unbinned subtomograms.
To ensure the correctness of the structure, a de novo reconstruction was performed on P. tetraurelia and C. reinhadtii MTTs. As shown in fig. S7 (I to R), both approaches (using a reference or de novo averaging) resulted in the same three-dimensional (3D) reconstruction. For the de novo averaging, a random translation (up to 6 nm) was
on December 16, 2020
http://advances.sciencemag.org/
added to the z position of each particle from the initial alignment to ensure that the final average was not biased by the initial picking. Using these translated particles, a first average volume was generated without any periodicity. Then, the dataset was split in two indepen-dent half-sets. For the next steps, the alignment parameters were the same for both halves. Particles were aligned on the first average until their top views were well aligned (three iterations required). As the side view was poorly resolved, a mask was applied on the inner structure, and particles were aligned for another round. After checking that the periodicity was better reconstructed, an iteration was performed with a mask covering the entire triplet. Note that for the de novo approach, particles were aligned using bin2 dimensions for P. tetraurelia and bin4 dimensions for C. reinhardtii. According to the Fourier shell correlation (FSC) = 0.143 criterion, the resolu-tion of the P. tetraurelia de novo reconstrucresolu-tion is 33 Å, and the resolution of the C. reinhardtii de novo reconstruction is 47 Å. Note that our focus is on the inner scaffold and that other features such as the microtubule inner protein (MIP) periodicities could have been imposed by the inner scaffold periodicity. Therefore, we do not conclude anything about these other structural features.
For the human MTTs, 398 subtomograms of 296 × 296 × 296 voxels were extracted from 12 centrioles and aligned using the ex vivo Cricetulus griseus MTTs structure as a starting reference (emd-7777, 15). The small number of subtomograms was due to the high compres-sion of the dataset, which resulted in fewer intact microtubules. Note that this dataset was composed of a mix of microtubule doublets and triplets. We chose to also use subtomograms containing MTDs knowing that the inner structure in human is still attached to them (fig. S2A). This heterogeneity of the dataset explains the poor C-microtubule reconstruction (fig. S6, I and J).
For the junctions between the MTTs in uncompressed P. tetraurelia and C. reinhardtii centrioles, the subtomograms were generated as before, but the order of point picking was first C-microtubules then A-microtubules. This was done to interpolate the points located between two MTTs instead of the points positioned in the middle of the MTT as done previously. For P. tetraurelia, 2413 subtomograms were extracted every 8.5 nm from the nine centrioles considered least compressed (roundest circumference). To check whether there was a 17-nm periodicity at the junction, half of the dataset was used, simulating one particle every 17 nm. A preliminary average was generated from the pre-alignment parameters and used as the initial reference. After five iterations, the average generated did not present any 17-nm periodical structures, so we decided to use the complete dataset with 8.5-nm periodicity. For C. reinhardtii, 682 subtomograms were extracted every 17 nm from five centrioles. In this case, pre-liminary observations already revealed a periodicity around 16.2 nm (fig. S1T). Following the same procedure as for P. tetraurelia, the initial reference was generated by averaging subtomograms with their pre-alignment parameters.
Combination of maps
To generate a map showing two neighboring MTTs linked together, we used two MTT maps and one junction map generated by sub-tomogram averaging as described above. The pixel intensities of all three maps were first normalized to the same range of values. The three maps were roughly reoriented in volumes big enough to fit two MTTs [fig. S4M, a]. Then, the junction volume was aligned on the first MTT [fig. S4M, b] using SPIDER (37). Similarly, the second MTT was aligned to the new junction volume [fig. S4M, c]. From
each volume, a region of interest was selected in ImageJ, and either the MTT or the junction was segmented out [fig. S4M, d]. Last, the three segmented volumes were joined together using the “Image Calculator -> Add” tool in ImageJ [fig. S4M, e]. Data files S1 and S2 are the final .tiff files of the merged volumes for P. tetraurelia (data file S1) and C. reinhardtii (data file S2).
Distribution analysis of structural features
To understand how the inner scaffold and the A-C linker were distributed along the centriole length, we used ImageJ to manual-ly pick the positions where the following structures start to be visible and where they disappear: inner scaffold, A-C linker, MTTs, and MTDs.
Geometrical analysis
From P. tetraurelia, we selected 10 centrioles that were as intact (round) as possible. To avoid the issue of centriole length variability, centrioles were subdivided into 10 parts. To do so, the “group Z Projection” tool from ImageJ was used to generate 10 slices along the centriole. At each slice, A-, B-, and C-microtubule coordinates were picked. Along the centriolar length, we defined the center of the centrioles (O) as the barycenter of all A-microtubule coordinates. Then, for each MTT, the twist angle was calculated as the angle between the vector O-A and the vector A-B (A and B are the centers of the A- and B-microtubules, respectively). In addition, the radius of the centriole was measured as the distance O-A. From 10 centrioles, 9 MTTs, and 10 subsections, we had two missing values, resulting in 898 mea-surements for each parameter.
From C. reinhardtii, the same information was extracted from six centrioles. As these centrioles were incomplete due to the FIB milling, it was not possible to calculate the barycenter of the A-microtubules for each subsection. Therefore, we also picked the hypothetical position of the centriole center. A total number of 377 measurements were obtained.
Rotational and translational analysis
In a raw tomogram, a cross section with a thickness of 100 nm was extracted from a centriole of P. tetraurelia. To increase its contrast, the volume was binned by a factor of 2. Next, the noise was removed by nonlinear anisotropic diffusion using bsoft and by applying a 3D Gaussian filter with Fiji. Using SPIDER, the volume was shifted along the z axis every pixel from −58 to +58 (respectively, −41 to 41 nm). Simultaneously, the volume was rotated around the z axis by 5° from 0 to 360. Each translated volume (with coupled shifts and rotations) was compared to the initial volume. Note that the cross correlation was calculated on the inner core structure only. The same operations were performed using a cross section of the final reconstructed P. tetraurelia inner scaffold.
In a similar manner, a cross section of C. reinhardtii centriole was extracted and prepared. As centrioles obtained in FIB milling are not complete, the rotational analysis could not be performed reliably. However, we could perform a translational analysis as explained above for the raw tomogram and the final reconstructed C. reinhardtii inner scaffold.
Mammalian cell culture
Cells were grown either in RPMI-1640 and GlutaMAX (Life Technol-ogies) (KE-37) or Dulbecco’s modified Eagle’s medium and GlutaMAX [U2OS and HEK293 (human embryonic kidney–293)], supplemented
on December 16, 2020
http://advances.sciencemag.org/
S C I E N C E A D V A N C E S
|
R E S E A R C H A R T I C L E
with 10% fetal calf serum (Life Technologies) and penicillin and streptomycin (100 g/ml).
Cloning
The pEGFP-C1–Centrin-2 construct expressing human Centrin-2 (NM_004344.1) has been described elsewhere (38). For the pEGFP-C2-POC5 construct, the full-length coding sequence of hPOC5 obtained by reverse transcription polymerase chain reaction (RT-PCR) as described in (21) was cloned into pEGFP-C2 (Clontech Laboratories). The pmCherry-hPOC5 construct was obtained by replacing the green fluorescent protein (GFP) coding sequence in the previous con-struct with mCherry. To generate the GFP-FAM161A concon-struct, human FAM161A (NM_001201543.2) was PCR-amplified from the DKFZp686O21143Q complementary DNA (cDNA) clone and cloned into pEGFP-C2. The pEGFP-POC1B construct was generated by transferring the coding sequence of human POC1B (NM_172240) from a Gateway donor vector (ORFeome Collaboration Clones, available from Dharmacon, ID: 100070629) into pEGFPC-attR, a modified pEGFP-C2 vector containing a Gateway cloning cassette. The pmCherry-POC1B was obtained in the same manner using pmCherryC- attR, a vector derived from pEGPC-attR by replacing the GFP coding sequence with mCherry.
Coimmunoprecipitation experiments
The following constructs were cotransfected in a 10-cm dish con-taining 30 to 40% confluent HEK293 cells using either Lipofectamine (Life Technologies) or jetPRIME reagent (Polyplus-transfection) following the manufacturer’s instructions: GFP-FAM161A with mCherry-POC5, mCherry-POC5 alone, GFP–Centrin-2 with mCherry- FAM161A, and GFP-POC5 with mcherry-POC1B. After 24 hours of expression, cells were processed according to the GFP-Trap Kit (Chromotek) instructions using radioimmunoprecipitation assay (RIPA) buffer for the lysis and incubating the lysate with GFP-Trap magnetic beads for 2 hours at 4°C on a rotating wheel. Samples were run on a 4 to 20% gradient gel (Bio-Rad) before transfer on polyvinylidene difluoride (PVDF) membrane using the iBlot system (Invitrogen/ Thermo Fisher Scientific). Membranes were either incubated with primary antibodies against mouse GFP (1:700; Abcam, ab1218) or rabbit mCherry (1:500; Abcam, ab167453), followed by goat anti- mouse horseradish peroxidase (HRP) (1:1000 from a 50% glycerol stock; Thermo Fisher Scientific, 31431) or goat anti-rabbit HRP (1:1000 from a 50% glycerol stock; Thermo Fisher Scientific, 31468) secondary antibodies. Blots were developed using Amersham films (GE Healthcare, 28906836).
FAM161A antibody production and purification
To generate the anti-FAM161A antibody, a fragment encoding amino acids 1 to 160 (based on sequence NP_001188472) was inserted into pGST-Parallel1 and expressed in Escherichia coli. The GST- FAM161A fusion protein was purified under native conditions using Glutathione Sepharose 4 Fast Flow (GE Healthcare), collected from the beads by TEV (Tobacco Etch Virus) protease cleavage and used for rabbit immunization (Agro-Bio). Antibodies were then affinity purified over a column of GST- FAM161A immobilized on Affi-Gel 10 (Bio-Rad Laboratories).
U-ExM reagents and protocol
U-ExM reagents are described in (16) except for poly-d-lysine, which
was purchased from Thermo Fisher Fisher (A3890401). U-ExM
monomer solutions (U-ExM–MS) were prepared as follows: For one gel, 25 l of sodium acrylate (SA) from a 38% (w/w, diluted with nuclease-free water) stock solution, 12.5 l of acrylamide (AA) from a 40% stock solution, 2.5 l of bis-acrylamide (BIS) from a 2% stock solution, and 5 l of 10× phosphate- buffered saline (PBS) were premixed and kept at −20°C. Free-radical initiator ammonium per sulfate (APS) and polymerization catalyst tetramethylethylenediamine (TEMED) were prepared as 10% stock solutions in nuclease-free water and kept as aliquots at −20°C for 1 month.
The following primary antibodies were used in this study: rabbit anti-tubulin (1:500, Abcam, ab18251), rabbit polyclonal anti- polyglutamate chain (PolyE, IN105) (1:500; AG-25B-0030-C050, AdipoGen), tubulin antibodies AA344 (1:250: scFv-S11B, -tubulin) and AA345 (1:250; scFv-F2C, -tubulin), rabbit polyclonal anti- POC1B (1:250; PA5-24495, Thermo Fisher Scientific), rabbit poly-clonal anti-POC5 (1:250; A303-341A, Bethyl Laboratories), rabbit polyclonal anti-FAM161A (1:250; homemade antibody, this study), and mouse monoclonal anti–Centrin-2 (1:250; clone 20H5, 04-1624, Merck Millipore). We used the following secondary antibodies: goat anti-rabbit Alexa Fluor 488 immunoglobulin G (IgG) heavy + light (H + L) (1:400; A11008), goat anti-mouse Alexa Fluor 488 IgG H + L (1:400; A11029), goat anti-mouse Alexa Fluor 568 IgG H + L (1:400; A11004) (1:400; Invitrogen, Thermo Fisher Scientific), and goat anti-rabbit Alexa Fluor 568 (1:400; Thermo Fisher Scientific).
The U-ExM protocol was performed as described (16). Briefly, 12-mm coverslips with unfixed U2OS cells were incubated in a solution of formaldehyde (FA) and AA (see Materials and Methods for concen-tration) in PBS for 5 hours at 37°C. TEMED (2.5 l) and APS (2.5 l) (from 10% stock solutions) were added to the U-ExM–MS and quickly mixed before addition to the coverslips. Gelation was allowed to proceed for 5 min on ice and then moved to 37°C in the dark for 1 hour. Cover-slips with gels were next incubated in denaturation buffer (200 mM SDS, 200 mM NaCl, and 50 mM tris in ddH2O bi-distilled water) for 15 min at room temperature (RT) with gentle agitation. Succes-sively, gels were removed from the coverslips and further incubated with fresh denaturation buffer at 95°C for 90 min (unless specified, see fig. S8). After denaturation, gels were immersed in ddH2O at RT. Next, gels were incubated in ddH2O overnight for complete expansion. The following day, gels were washed in PBS twice for 15 min to remove excess water before incubation with primary antibody solution. Incuba-tion with primary antibody diluted in 2% PBS/BSA was performed at 37°C for ~3 hours, with gentle shaking. Gels were then washed in PBS and 0.1% Tween 20 (PBST), three times for 10 min with shaking, and incubated with secondary antibody solution diluted in 2% PBS/BSA for ~3 hours at 37°C, with gentle shaking. Gels were then washed in PBST, three times for 10 min with shaking, and lastly placed in beakers filled with ddH2O for the final expansion first for 30 min and then overnight for complete expansion. Expected expansion varied from 4 to 4.2×. Mounting were performed as described (16).
U-ExM protocol optimization and image acquisition
We optimized our previously described U-ExM protocol (16) to obtain better expansion of centrioles within human cells. Two steps were modified as follows: the solution of FA/AA [FA 0.7 and 1% AA = 1X (16); FA 1.4 and 2% AA = 2X; and FA 2.1 and 3% AA = 3X) and the denaturation time (30, 60, and 90 min). The results of the optimization are presented in fig. S8 (A and B). The 2X protocol combined with 90-min denaturation at 95°C yielded the best ex-pansion and was used for further analysis.
on December 16, 2020
http://advances.sciencemag.org/
Confocal microscopy was performed on a Leica TCS SP8 using a 63× 1.4 numerical aperture (NA) oil objective, with the lightning mode at max resolution to generate deconvolved images, with the following parameters: Lightning at max resolution, adaptive as “Strategy” and water as “Mounting Medium.” 3D z stacks were acquired with 0.12-m z intervals and an x,y pixel size of 35 nm. For fig. S8 (A and B), centrioles were imaged with a 100× 1.25 NA N PLAN oil objective on a Leica DM6B wide-field microscope, equipped with a scientific complementary metal-oxide semiconductor (sCMOS) mono-chrome Leica DFC9000 camera. Deconvolved images were generated with the Thunder “Small volume computational clearing” mode.
Measurements of centriole diameter and length
The diameter and length of tubulin and inner scaffold proteins were always measured from dual staining experiments to obtain relative values. Centrioles with their distal and proximal ends aligned vertically along the z axis were selected for diameter analysis. The diameters of tubulin and the different inner scaffold proteins were measured at the middle z plane by using the Fiji line scan and plot profile tools (39) to measure the distance between the two peaks of intensity. For each centriole, diameters of protein localization were obtained from the average of two perpendicular measurements. For length analysis, only centrioles laying nearly parallel to the x,y plane were chosen to measure the length of tubulin and the different inner core proteins. For each centriole, a line scan covering the whole width of the centriole was drawn along a maximum projection image generated from a few middle planes of the centriole. The Fiji plot profile tool was then used to obtain the fluorescence intensity profile of both tubulin and the inner core protein from the same line scan, and length was measured as the distance between 50% intensity of the most proximal peak and the 50% intensity of the most distal peak.
To generate the graphs in fig. S8 (C, E, G, and I), both the x and y axes were rescaled to relative units. For each tubulin fluorescence intensity profile, the highest maximum fluorescence value (x axis) was rescaled to 1, and all the other values were normalized to it. More-over, the lengths of each fluorescence intensity profile (y axis) were rescaled between 0 and 1 by assigning 0 to 5% of the fluorescence in-tensity of the most proximal peak and 1 to 5% of the fluorescence intensity of the most distal peak. Next, rescaled tubulin fluorescence intensity profiles from ~60 centrioles from three independent gels were aligned and averaged together to generate an average curve. The fluorescence intensity profile of each inner scaffold protein was similarly normalized and rescaled by its own maximum intensity on the x axis and by the length of the corresponding tubulin profile from the same centriole on the y axis. Subsequently, the aligned in-tensity profiles of the inner scaffold proteins were averaged together to generate average curves. Fluorescence intensity profiles were rescaled by using the language R and plotted in GraphPad Prism7.
To obtain Fig. 4 (K and L), diameters of inner scaffold proteins and tubulin from each individual centriole were normalized to the average tubulin measurements obtained from all the centrioles. In-dividual values were plotted as circle of the corresponding diameter and center aligned.
Symmetrization
Symmetrized images (Fig. 4J) were obtained from the deconvolved confocal merge images shown in Fig. 4I (raw images). Each image was duplicated nine times and sequentially rotated with a 40° angle
in Fiji (39). Using the Fiji plugin StackReg, the rotated images were realigned by translations only to the original image. An average in-tensity projection of the nine images was then generated.
Inner scaffold at U-ExM resolution
As described in fig. S9 (F to K), 2D projection (average) (fig. S9F) from the reconstructed 3D cryo-EM map was generated using Fiji (39). Then, the image was rescaled four times larger to reach the size of a centriole in U-ExM (about 800 nm in diameter from the middle of the MTTs). Subsequently, two images were generated by deleting either the inner scaffold density (fig. S9G) or the MTTs (fig. S9H). Each image was then processed with a bandpass in the Fourier space by filtering the small structures up to 140 nm, which corresponds to the confocal resolution after deconvolution (fig. S9, I and J). The final image was created by merging the two filtered images (fig. S9K).
Microtubule recruitment assay
Sixty to 80% confluent U2OS cells were transfected in a six-well plate using jetPRIME reagent (Polyplus-transfection) following the manufacturer’s instructions, with 2.5 g of total DNA of the following combinations: mCherry-FAM161A alone, GFP-POC5 alone, GFP- POC1B alone, GFP–Centrin-2 alone, mCherry-FAM161A with GFP- POC5, mCherry-FAM161A with GFP-POC1B, mCherry-FAM161A with GFP–Centrin-2, mcherry-POC5 with GFP–Centrin-2, or mCherry- FAM161A with both mCherry-POC5 and GFP–Centrin-2. The medium was changed 4 to 6 hours after transfection to avoid cell death, and expression of the fluorescent fusion proteins was allowed for 24 hours. Cells grown on coverslips were then fixed for 3 min in −20°C cold MeOH and washed once in PBS before staining for - and -tubulins (see “U-ExM reagents” section in the Supplementary Materials) in PBS/BSA 2% followed by anti-mouse STAR RED sec-ondary antibody (1:400; Abberior), washed three times in PBS Tween 0.1%. Coverslips were then mounted using glycerol-mounting medium with 4′,6-diamidino-2-phenylindole and DABCO 1, 4-diazabicyclo (2.2.2) octane (Abcam, ab188804).
SUPPLEMENTARY MATERIALS
Supplementary material for this article is available at http://advances.sciencemag.org/cgi/ content/full/6/7/eaaz4137/DC1
Fig. S1. Visualization of the connections between MTTs in cryo-tomograms. Fig. S2. MTT to MTD transitions.
Fig. S3. The inner scaffold maintains centriole cohesion under compressive forces. Fig. S4. Reconstruction resolutions and computational pipeline for reconstructing the complete central region.
Fig. S5. Assessing the correctness of the structure: Raw images versus averages. Fig. S6. Periodicity of the inner scaffold stem in P. tetraurelia, C. reinhardtii, N. gruberi, and humans.
Fig. S7. Periodicity, helicity, and de novo subtomogram averaging.
Fig. S8. Optimized U-ExM protocol in human cells reveals components of the inner scaffold. Fig. S9. POC1B, FAM161A, POC5, and Centrin-2 colocalize with the inner scaffold structure as simulated U-ExM fluorescence.
Fig. S10. 3D localization of the inner core proteins and extended localization of GFP-POC1B at the proximal region of the centriole upon overexpression.
Movie S1. Cryo-tomogram of a P. tetraurelia centriole ex vivo. Movie S2. Cryo-tomogram of a C. reinhardtii centriole in situ.
Movie S3. 3D representation of the P. tetraurelia central core highlighting the helical pattern of the inner scaffold.
Movie S4. 3D representation of the C. reinhardtii central core highlighting the helical pattern of the inner scaffold.
Movie S5. 3D rendering of the full central core architecture from P. tetraurelia. Movie S6. 3D rendering of the full central core architecture from C. reinhardtii. Data file S1. The complete central core reconstruction from P. tetraurelia. Data file S2. The complete central core reconstruction from C. reinhardtii. Reference (40)
on December 16, 2020
http://advances.sciencemag.org/
S C I E N C E A D V A N C E S
|
R E S E A R C H A R T I C L E
REFERENCES AND NOTES
1. D. K. Breslow, A. J. Holland, Mechanism and regulation of centriole and cilium biogenesis.
Annu. Rev. Biochem. 88, 691–724 (2019).
2. J. B. Meehl, B. A. Bayless, T. H. Giddings Jr., C. G. Pearson, M. Winey, Tetrahymena Poc1 ensures proper intertriplet microtubule linkages to maintain basal body integrity.
Mol. Biol. Cell 27, 2394–2403 (2016).
3. C. G. Pearson, D. P. S. Osborn, T. H. Giddings Jr., P. L. Beales, M. Winey, Basal body stability and ciliogenesis requires the conserved component Poc1. J. Cell Biol. 187, 905–920 (2009). 4. B. A. Bayless, T. H. Giddings, M. Winey, C. G. Pearson, Bld10/Cep135 stabilizes basal
bodies to resist cilia-generated forces. Mol. Biol. Cell 23, 4820–4832 (2012). 5. M. Abal, G. Keryer, M. Bornens, Centrioles resist forces applied on centrosomes during
G2/M transition. Biol. Cell 97, 425–434 (2005).
6. P. Guichard, V. Hachet, N. Majubu, A. Neves, D. Demurtas, N. Olieric, I. Fluckigger, A. Yamada, K. Kihara, Y. Nishida, S. Moriya, M. O. Steinmetz, Y. Hongoh, P. Gönczy, Native architecture of the centriole proximal region reveals features underlying its 9-fold radial symmetry. Curr. Biol. 23, 1620–1628 (2013).
7. S. Li, J.-J. Fernandez, W. F. Marshall, D. A. Agard, Electron cryo-tomography provides insight into procentriole architecture and assembly mechanism. eLife 8, e43434 (2019). 8. R. V. Dippell, The development of basal bodies in paramecium. Proc. Natl. Acad. Sci. U.S.A.
61, 461–468 (1968).
9. F. O. Perkins, Formation of centriole and centriole-like structures during meiosis and mitosis in LABYRINTHULA sp. (Rhizopodea, Labyrinthulida). An electron-microscope study. J. Cell Sci. 6, 629–653 (1970).
10. I. A. Vorobjev, Y. S. Chentsov, The ultrastructure of centriole in mammalian tissue culture cells. Cell Biol. Int. Rep. 4, 1037–1044 (1980).
11. S. Li, J.-J. Fernandez, W. F. Marshall, D. A. Agard, Three-dimensional structure of basal body triplet revealed by electron cryo-tomography. EMBO J. 31, 552–562 (2012). 12. G. A. Greenan, B. Keszthelyi, R. D. Vale, D. A. Agard, Insights into centriole geometry
revealed by cryotomography of doublet and triplet centrioles. eLife 7, e36851 (2018). 13. M. Schaffer, J. Mahamid, B. D. Engel, T. Laugks, W. Baumeister, J. M. Plitzko, Optimized
cryo-focused ion beam sample preparation aimed at in situ structural studies of membrane proteins. J. Struct. Biol. 197, 73–82 (2017).
14. P. Guichard, D. Chrétien, S. Marco, A.-M. Tassin, Procentriole assembly revealed by cryo-electron tomography. EMBO J. 29, 1565–1572 (2010).
15. M. Paintrand, M. Moudjou, H. Delacroix, M. Bornens, Centrosome organization and centriole architecture: Their sensitivity to divalent cations. J. Struct. Biol. 108, 107–128 (1992). 16. D. Gambarotto, F. U. Zwettler, M. Le Guennec, M. Schmidt-cernohorska, D. Fortun,
S. Borgers, J. Heine, J.-G. Schloetel, M. Reuss, M. Unser, E. S. Boyden, M. Sauer, V. Hamel, P. Guichard, Imaging cellular ultrastructures using expansion microscopy (U-ExM).
Nat. Methods 16, (2019).
17. M. W. Hubshman, S. Broekman, E. van Wijk, F. Cremers, A. Abu-Diab, S. Khateb, S. Tzur, I. Lagovsky, P. Smirin-Yosef, D. Sharon, L. Haer-Wigman, E. Banin, L. Basel-Vanagaite, E. de Vrieze, Whole-exome sequencing reveals POC5 as a novel gene associated with autosomal recessive retinitis pigmentosa. Hum. Mol. Genet. 27, 614–624 (2018). 18. S. Roosing, I. J. C. Lamers, E. de Vrieze, L. I. van den Born, S. Lambertus, H. H. Arts; POC1B
Study Group, T. A. Peters, C. B. Hoyng, H. Kremer, L. Hetterschijt, S. J. F. Letteboer, E. van Wijk, R. Roepman, A. I. den Hollander, F. P. M. Cremers, Disruption of the basal body protein POC1B results in autosomal-recessive cone-rod dystrophy. Am. J. Hum. Genet. 95, 131–142 (2014).
19. G. Ying, J. M. Frederick, W. Baehr, Deletion of both centrin 2 (CETN2) and CETN3 destabilizes the distal connecting cilium of mouse photoreceptors. J. Biol. Chem. 294, 3957–3973 (2019).
20. M. Karlstetter, N. Sorusch, A. Caramoy, K. Dannhausen, A. Aslanidis, S. Fauser, M. R. Boesl, K. Nagel-Wolfrum, E. R. Tamm, H. Jägle, H. Stoehr, U. Wolfrum, T. Langmann, Disruption of the retinitis pigmentosa 28 gene Fam161a in mice affects photoreceptor ciliary structure and leads to progressive retinal degeneration. Hum. Mol. Genet. 23, 5197–5210 (2014). 21. J. Azimzadeh, P. Hergert, A. Delouvée, U. Euteneuer, E. Formstecher, A. Khodjakov,
M. Bornens, hPOC5 is a centrin-binding protein required for assembly of full-length centrioles. J. Cell Biol. 185, 101–114 (2009).
22. M. Venoux, X. Tait, R. S. Hames, K. R. Straatman, H. R. Woodland, A. M. Fry, Poc1A and Poc1B act together in human cells to ensure centriole integrity. J. Cell Sci. 126, 163–175 (2013). 23. F. Zach, F. Grassmann, T. Langmann, N. Sorusch, U. Wolfrum, H. Stöhr, The retinitis
pigmentosa 28 protein FAM161A is a novel ciliary protein involved in intermolecular protein interaction and microtubule association. Hum. Mol. Genet. 21, 4573–4586 (2012). 24. G. Keryer, A. Adoutte, S. F. Ng, J. Cohen, N. Garreau de Loubresse, M. Rossignol, N. Stelly,
J. Beisson, Purification of the surface membrane-cytoskeleton complex (Cortex) of Paramecium and identification of several of its protein constituents. Eur. J. Protistol. 25, 209–225 (1990). 25. D. Gogendeau, P. Guichard, A.-M. Tassin, Purification of centrosomes from mammalian
cell lines. Methods Cell Biol. 129, 171–189 (2015).
26. D. N. Mastronarde, Automated electron microscope tomography using robust prediction of specimen movements. J. Struct. Biol. 152, 36–51 (2005).
27. J. G. Umen, U. W. Goodenough, Control of cell division by a retinoblastoma protein homolog in Chlamydomonas. Genes Dev. 15, 1652–1661 (2001).
28. W. J. H. Hagen, W. Wan, J. A. G. Briggs, Implementation of a cryo-electron tomography tilt-scheme optimized for high resolution subtomogram averaging. J. Struct. Biol. 197, 191–198 (2017).
29. C. Fulton, Cell differentiation in Naegleria gruberi. Annu. Rev. Microbiol. 31, 597–627 (1977). 30. L. K. Fritz-Laylin, Z. J. Assaf, S. Chen, W. Z. Cande, Naegleria gruberi de novo basal body
assembly occurs via stepwise incorporation of conserved proteins. Eukaryot. Cell 9, 860–865 (2010).
31. L. K. Fritz-Laylin, Y. Y. Levy, E. Levitan, S. Chen, W. Z. Cande, E. Y. Lai, C. Fulton, Rapid centriole assembly in Naegleria reveals conserved roles for both de novo and mentored assembly. Cytoskeleton 73, 109–116 (2016).
32. M. Bornens, M. Paintrand, J. Berges, M.-C. Marty, E. Karsenti, Structural and chemical characterization of isolated centrosomes. Cell Motil. Cytoskeleton 8, 238–249 (1987). 33. L. C. Keller, E. P. Romijn, I. Zamora, J. R. Yates, W. F. Marshall, Proteomic analysis of isolated
chlamydomonas centrioles reveals orthologs of ciliary-disease genes. Curr. Biol. 15, 1090–1098 (2005).
34. S. Q. Zheng, E. Palovcak, J.-P. Armache, K. A. Verba, Y. Cheng, D. A. Agard, MotionCor2: Anisotropic correction of beam-induced motion for improved cryo-electron microscopy.
Nat. Methods 14, 331–332 (2017).
35. J. R. Kremer, D. N. Mastronarde, J. R. McIntosh, Computer visualization of three-dimensional image data using IMOD. J. Struct. Biol. 116, 71–76 (1996).
36. D. Castaño-Díez, M. Kudryashev, M. Arheit, H. Stahlberg, Dynamo: A flexible, user-friendly development tool for subtomogram averaging of cryo-EM data in high-performance computing environments. J. Struct. Biol. 178, 139–151 (2012).
37. J. Frank, M. Radermacher, P. Penczek, J. Zhu, Y. Li, M. Ladjadj, A. Leith, SPIDER and WEB: Processing and visualization of images in 3D electron microscopy and related fields.
J. Struct. Biol. 116, 190–199 (1996).
38. O. Gavet, C. Alvarez, P. Gaspar, M. Bornens, Centrin4p, a novel mammalian centrin specifically expressed in ciliated cells. Mol. Biol. Cell 14, 1818–1834 (2003).
39. J. Schindelin, I. Arganda-Carreras, E. Frise, V. Kaynig, M. Longair, T. Pietzsch, S. Preibisch, C. Rueden, S. Saalfeld, B. Schmid, J. Y. Tinevez, D. J. White, V. Hartenstein, K. Eliceiri, P. Tomancak, A. Cardona, Fiji: An open-source platform for biological-image analysis.
Nat. Methods 9, 676–682 (2012).
40. L. C. Keller, S. Geimer, E. Romijn, J. Yates, I. Zamora, W. F. Marshall, Molecular architecture of the centriole proteome: The conserved WD40 domain protein POC1 is required for centriole duplication and length control. Mol. Biol. Cell 20, 1150–1166 (2009). Acknowledgments: We thank W. Baumeister and J. Plitzko for enabling the in situ cryo-ET by providing support and instrumentation. We thank E. Bertiaux for critical reading of the manuscript. We thank the imaging facility of Plant Biology Department and the Bioimaging Center of UNIGE. Funding: This work was supported by the Swiss National Science Foundation (SNSF) PP00P3_157517 and the European Research Council ERC ACCENT StG 715289 attributed to P.G., by the French National Research Agency ANR-15-CE11-0002-01 attributed to A.-M.T., and by the Max Planck Society. Author contributions: B.D.E., V.H., and P.G. conceived, supervised, and designed the project. M.L.G. performed all image processing with the help of N.K. A.-M.T. established the purification procedure for P. tetraurelia basal bodies and performed the isolation. N.K. isolated the human centrioles and acquired tomograms of these two species with the help of L.K., K.N.G., H.S., H.v.d.H., and B.D.E. All U-ExM experiments and analysis were performed by D.G. and M.H.L. Sample preparation and tomography of in situ Chlamydomonas centrioles as well as isolated Naegleria centrioles was performed by P.S.E., M.S., H.v.d.H., and B.D.E. S.B. performed the coimmunoprecipitation experiments (Fig. 5J) and helped with Fig. 4. J.A. cloned all GFP and mCherry fusion constructs and made the FAM161A antibody used in this study in the laboratory of M.B. M.B. and J.A. shared initial results on FAM161A-POC5 interactions. All authors wrote and revised the final manuscript. Competing interests: The authors declare that they have no competing interests. Data and materials availability: Subtomogram averages have been deposited at the Electron Microscopy Data Bank (EMD-4926, EMD-4927, EMD-4929, and EMD-4930). All data needed to evaluate the conclusions in the paper are present in the paper and/or the Supplementary Materials. Additional data related to this paper may be requested from the authors. Correspondence and requests for materials should be addressed to P.G.
Submitted 6 September 2019 Accepted 3 December 2019 Published 14 February 2020 10.1126/sciadv.aaz4137
Citation: M. Le Guennec, N. Klena, D. Gambarotto, M. H. Laporte, A.-M. Tassin, H. van den Hoek, P. S. Erdmann, M. Schaffer, L. Kovacik, S. Borgers, K. N. Goldie, H. Stahlberg, M. Bornens, J. Azimzadeh, B. D. Engel, V. Hamel, P. Guichard, A helical inner scaffold provides a structural basis for centriole cohesion. Sci. Adv. 6, eaaz4137 (2020).
on December 16, 2020
http://advances.sciencemag.org/
Juliette Azimzadeh, Benjamin D. Engel, Virginie Hamel and Paul Guichard
DOI: 10.1126/sciadv.aaz4137 (7), eaaz4137. 6
Sci Adv
ARTICLE TOOLS http://advances.sciencemag.org/content/6/7/eaaz4137
MATERIALS
SUPPLEMENTARY http://advances.sciencemag.org/content/suppl/2020/02/10/6.7.eaaz4137.DC1
REFERENCES
http://advances.sciencemag.org/content/6/7/eaaz4137#BIBL This article cites 39 articles, 14 of which you can access for free
PERMISSIONS http://www.sciencemag.org/help/reprints-and-permissions
Terms of Service Use of this article is subject to the
is a registered trademark of AAAS.
Science Advances
York Avenue NW, Washington, DC 20005. The title
(ISSN 2375-2548) is published by the American Association for the Advancement of Science, 1200 New
Science Advances
License 4.0 (CC BY-NC).
Science. No claim to original U.S. Government Works. Distributed under a Creative Commons Attribution NonCommercial Copyright © 2020 The Authors, some rights reserved; exclusive licensee American Association for the Advancement of
on December 16, 2020
http://advances.sciencemag.org/