HAL Id: halshs-00609798
https://halshs.archives-ouvertes.fr/halshs-00609798
Submitted on 20 Jul 2011
HAL is a multi-disciplinary open access archive for the deposit and dissemination of sci-entific research documents, whether they are pub-lished or not. The documents may come from teaching and research institutions in France or abroad, or from public or private research centers.
L’archive ouverte pluridisciplinaire HAL, est destinée au dépôt et à la diffusion de documents scientifiques de niveau recherche, publiés ou non, émanant des établissements d’enseignement et de recherche français ou étrangers, des laboratoires publics ou privés.
Accounting for the effects of AIDS on growth in
Sub-Saharan Africa
Paul Cahu, Falilou Fall
To cite this version:
Paul Cahu, Falilou Fall. Accounting for the effects of AIDS on growth in Sub-Saharan Africa. 2011. �halshs-00609798�
Documents de Travail du
Centre d’Economie de la Sorbonne
Accounting for the Effects of AIDS on Growth in Sub-Saharan Africa
Paul CAHU, Falilou FALL
Accounting for the E¤ects of AIDS on Growth in
Sub-Saharan Africa
Paul CAHU
The World Bank
yFalilou FALL
zCenter of Economics of Sorbonne
University Pantheon-Sorbonne
21st December 2010
Abstract
In this paper, we, …rst, perform a quantitative assessment of the impact of the HIV/AIDS epidemic on growth. Second, we precisely account for the e¤ects of the epidemic on income per capita through human and physical capital accumulations, population and labor force. That is, we disentangle the e¤ect on the di¤erent sources of short and long run growth. Using a dynamic panel of 46 Sub-Saharan African countries over the period 1981-2007, we show that HIV/AIDS has negative, signi…cant and long-lasting e¤ects on demography and growth. According to the estimates presented, GDP per working age population will be 12% lower in the long-run for the average African country than it should be if the epidemic had not spread out. However, the impact is huge for the countries experiencing a high prevalence rate. To tackle the endogeneity issue of HIV/AIDS, we provide a new series of HIV prevalence rate build from the estimation of the propagation dynamic of the epidemic.
Key words: Health, AIDS epidemic, Human Capital, Growth, Sub-Saharan Africa
JEL Classi…cation: I10, J11, O15, O40, O55
The World Bank, pcahu@worldbank.org
yThe work presented in this paper re‡ects only the views of the author and not those of the World
Bank.
zCenter of Economics of Sorbonne, University Paris 1 Pantheon-Sorbonne, 113 boulevard de l’Hopital,
1
Introduction
The UNAIDS 2008 “Report on the global AIDS epidemic” states that there were an estimated 33 million people living with AIDS in 2007 in the World. Sub-Saharan Africa remains the most heavily a¤ected by HIV, accounting for 67% of all people living with HIV and for 72% of AIDS related deaths in 2007. In some countries, as Botswana, Lesotho and South Africa, HIV prevalence rate among pregnant women attending clinics is more than 30%. In Sub-Saharan Africa alone, the epidemic has orphaned nearly 12 million children under 18.
The dramatic humanitarian impact of the epidemic is largely recognized and has drawn most of the attention. This has helpfully mobilized the international community to set up powerful instruments and large …nancial funds to slow down the propagation of the epidemic and treat infected people. Thanks to these e¤orts, promising results have been reached, but enduring challenges remain.
Indeed the epidemic is likely to have very long lasting e¤ects. The UNAIDS report declares that “the natural age distribution in many national populations in Sub-Saharan Africa has been dramatically skewed by HIV with potentially perilous consequences for the transfer of knowledge and values from one generation to the next”. This declaration underlines some of the di¤erent channels through which the epidemic can a¤ect growth: short run and long run impact, e¤ects on population dynamics and on education.
In this paper, we, …rst, perform a quantitative assessment of the impact of the HIV/AIDS epidemic on growth. Second, we precisely account for the e¤ects of the epi-demic on income per capita through education, physical capital, population and labor force. That is, we disentangle the e¤ect on the di¤erent sources of short and long run growth. Such an exercise may shed some light on the need to tackle the multidimensional impact of the epidemic.
The social and economic consequences of such epidemic are huge. Families are broken, sometimes with an important number of orphans. The burden, in families providing health care for infected people is heavy, and has consequences on savings and investment. It also have large e¤ects on public policies as it diverts resources to health care from others under satis…ed needs.
However, the assessments of the economic impact of the epidemic are very contradict-ory. In one hand, Bonnel (2000), Bell, Devarajan, and Gerbach (2003), McDonald and Roberts (2006), and Papageorgiou and Stoytcheva (2005) …nd some evidence of a negative e¤ect of the epidemic. In the other hand, …rst estimation by Bloom and Mahal (1997) in a cross-country perspective found no evidence that AIDS impedes growth. Werker, Ahuja, and Wendell (2006) have also found a statistically insigni…cant e¤ect of the HIV epidemic on growth.
Assessing the macroeconomic impacts of the HIV/AIDS epidemics is a very challen-ging exercise. There have been many reservations made on macroeconomic cross-country regressions. Durlauf, Jonhson and Temple (2005) provide an extensive review of the lim-itations and progress on the econometrics of growth. Most of the reservations comes from the lack of appropriate data and model uncertainty used to analyze growth. Therefore, they underline the necessity to draw lessons from these analysis with cautious. They also point out the di¢ culty to …nd out valid instruments in panel growth regressions. How-ever, they …nd promising the strategy followed by Tavares and Wacziarg (2001), which consisted on estimating the e¤ects of democracy on the long run determinants of growth (human capital accumulation, physical capital accumulation or government expenditures)
in order to net out its e¤ect on growth.
Recently, Weil (2007) used microeconomics estimates of the e¤ect of health on indi-vidual outcomes to construct macroeconomic estimates of the proximate e¤ect of health on GDP per capita. This approach allows to circumvent the endogeneity bias encountered in structural estimates of growth determinant.
Our strategy is inspired by Weil (2007) accounting strategy1. We use instrumental
variables, including circumcision rate as Werker, Ahuja, and Wendell (2006) to estimate the independent propagation dynamic of the epidemic, and then we construct a HIV prevalence series. These two complementary steps normally allow us to eliminate or reduce the endogenous bias problem.
Conceptually our approach is similar to the one done by Ashraf, Lester and Weil (2008). The reasoning is to estimate the impact of a variable of interest and to substract its impact in reference to the potential output the economy would reach without the shock due to the variable of interest. Moreover, their simulations of the impact of eradicating malaria or tuberculosis depict a very instructive functioning of the dynamic e¤ects of epidemic disease directly and indirectly through education, life expectancy and productivity. As HIV/AIDS combines the distinctive patterns of these two diseases, that is hitting either the working adult age population and the young, their exercise help to explain its potential cumulative huge e¤ects.
Our estimates show that for the average Sub-Saharan African countries, at the peak, the total e¤ect of HIV/AIDS on growth is a reduction by 6% of income per capita; the e¤ect through education account for 2.4%, the e¤ect through physical capital account for 2%, the residual e¤ect which account for the reduction of labour participation and technological progress account 1.5%, and the counterbalancing positive e¤ect through capital intensity accounts for less than 0.1%. As the e¤ects pile up, in the long run the cumulative permanent e¤ect is a 12% loss in the level of GDP per capita.
Our results emphasize the necessity to tackle the impact of the epidemic not only through its prevention and the treatment of infected people, but also on human capital and physical capital accumulation.
The paper is organized as follows. Section 2 discusses the controversial literature and presents our conceptual framework. Section 3 presents the data sources and the construction of the independent HIV prevalence series. Section 4 is the econometric assessment of the impact of HIV/AIDS on per capita income and on the determinants of growth. Section 5 presents the accounting exercise we perform and the results. Section 6 discusses our results by comparing them to the literature and concludes.
2
The conceptual framework and controversial issues
This section presents the theoretical framework and the controversial issues in the disen-tanglement of the e¤ects of HIV/AIDS on growth. Although there is no doubt that AIDS is a plague for Sub-Saharan African countries, the patterns of the economic outcomes is very controversial.
2.1
A non consensual literature
An evidence di¢ cult to show Several studies have tried to estimate the total e¤ect
of AIDS on growth. Early estimates by Over (1992) and Cuddington and Hancock (1994) …nd evidence of a negative e¤ect of AIDS on growth. But these estimates su¤er from a lack of appropriate data. Bloom and Mahal (1997) run cross-country regressions of GDP per capita growth on HIV/AIDS prevalence and found no e¤ect. However, their studies have been criticized because they used limited data2. More recently, McDonald and Roberts
(2006) provide new estimates of the e¤ect of AIDS on growth through its impact on health capital. Their study, based on data from 1984 to 1999, relies on the estimation of a Solow-augmented model. Using a panel estimation method applied to cross-country economic growth, they found a strong and signi…cant negative e¤ect of AIDS on growth. While, Werker, Ahuja, and Wendell (2006) show that there is no e¤ect of the epidemics on growth of African countries. Corrigan, Glomm, and Mendez (2005) show calibration results that imply large negative e¤ects of the epidemic on growth.
A room for a positive or negative impact There are several channels through which the AIDS epidemic can potentially harm economic growth3. First, as AIDS decreases life
expectancy, it reduces the incentives to invest or accumulate physical or human capital. Moreover, as noted by Corrigan and al. (2005), to the extent that AIDS is more pre-valent among highly skilled workers and that highly skilled labor is complementary to capital, the AIDS epidemic can lower the returns on investment and, in turn, savings and capital accumulation. In the same line, potentially large medical costs to treat HIV can divert private or public resources from education investment or capital accumulation. In addition to that, a decrease in life expectancy will reduce individuals or …rms investment in education or training, reducing therefore workers productivity. Second, the disease may eventually hamper schools enrollment and the quality of education4. The presence
of a large generation of orphans, specially in the context of African economies where the government can not compensate for missing parents, may induce a decrease in human capital investment. Finally, the disease can hamper the productivity of infected people, thus lowering average productivity. The disease could reduce the productivity of healthy people as well, as they may devote some of their time taking care of their sick relatives. All these e¤ects, lower investment in physical and human capital, and productivity slowdown, may contribute cumulatively to a negative impact of HIV/AIDS on income.
However, there is still a room for a positive impact of AIDS/HIV epidemic on growth. The positive e¤ect of AIDS on growth may occur through two closed mechanisms. The …rst one is the capital deepening e¤ect occurring with the loss of working age population caused by epidemics as emphasized by Young (2007). Indeed, the short-run e¤ect of the epidemic with the huge number of death of adult persons is, in a context or scarcity of capital, to increase the capital to worker ratio, and therefore induces an increase of productivity and growth. The second one is a long run e¤ect depending on the impact of AIDS/HIV on fertility rate and ultimately on population growth. As emphasized by Young (2005), the AIDS/HIV epidemic with the adult mortality, the HIV infant mortality and the endogenous decreasing e¤ect on fertility will lead to a lower population growth rate. Young (2005) argues that the positive e¤ects of lower population growth are strong
2Indeed, the time period of their estimates (1980-1992) is characterized by a growing, but still limited,
AIDS epidemic.
3See Boucekkine, Diene and Azomahou (2006) for a survey.
4Indeed orphans due to AIDS are less likely to attend school. Moreover, the epidemic has not spared
oppor-enough to o¤set the most pessimistic forecast of human capital losses, and therefore will bring about extra resources that will raise the per capita welfare of future generations.
A disputed issue : the impact on population growth through fertility A long run positive e¤ect of AIDS/HIV on growth depends ultimately on its impact on fertility. Theoretically, the impact can be either positive or negative. The …rst round e¤ect of AIDS/HIV on fertility is negative coming from the direct biological impact of the disease, which lowers the fecundity of infected women. fecundity is reduced by HIV infection due to higher rate of miscarriage and stillbirth. There is an important and convergent literature con…rming this negative direct e¤ect5. For instance, Juhn, Kalemli-Ozcan and Turan (2008) …nd that being infected with HIV reduces births last year by approximately 21 percent.
The second round e¤ect depends on behavioral response of individuals either infected and non infected. Thus, this behavioral response can o¤set or increase the negative …rst round e¤ect, since it aggregates sexual behavior changes of all the women’s population. As indicated by Young (2005), the rationals for a decrease of the fertility due to behavioral changes come directly from a reduction of the willingness to engage in unprotected sex, and indirectly, from the increase of wages due to scarcity of labor, which increase the opportunity cost of having a baby for women. However, the behavioral response of non-infected women may be to increase fertility, mitigating then the diseases’negative impacts on population. It follows from the link between mortality and fertility as exhibited by the historical pattern of demographic transition. There is no consensus on the impact of AIDS/HIV on fertility and individual behavioral response to the epidemic6. Young
(2005) …nd that the HIV epidemic is lowering fertility in Sub-Saharan Africa. Kalemli-Ozcan (2009) using a restricted period of data (1990-1998) …nd that the e¤ect of HIV prevalence on fertility is positive for South Africa. Ultimately, Forston (2009) and Fink and Linnemayr (2008) suggest that the AIDS/HIV epidemic had very little impact on fertility and is unlikely to have a signi…cant e¤ect on population size.
2.2
The theoretical model
We will denote N the working age population, L the equivalent number of full-time workers in the economy, K the aggregate stock of physical capital, S the average number of years of schooling among the workers, h the HIV prevalence rate and Y the total GDP. We consider an extended Solow-type growth model with both human and physical capital. The aggregate output is:
Yt= F (At; Kt; Lt; St) = AtKtL 1
t e (1 )St (1)
where 0 < < 1. Total factor productivity At varies with time and can be a¤ected by
exogenous shocks such as civil con‡icts for instance.
This framework allows to take into account the e¤ects of the epidemic on the di¤erent sources of growth mentioned above. McDonald and Roberts (2006) consider a Solow augmented model that integrates directly health as a variable of the production function. In our speci…cation, health is rather embedded in labor force participation and a¤ects capital accumulation as well7.
5See Lewis and al. (2004) for a review.
6See Oster (2009a) and (2009b) for estimates of behavioral changes due to HIV prevalence. 7Indeed health is likely to have important e¤ect on growth, see Bhargava and al. (2003).
In the long-run, fertility and thus the gross growth rate of population n may be endogenous as well. However, the changes in fertility is unlikely to have large e¤ects on per adult income in the long-run. Indeed, although the change in fertility could a¤ect the magnitude of the e¤ects of HIV/AIDS on growth it is unlikely to modify their directions. As infected adults have a shorter life expectancy, we model the net increase of the adult population as:
Nt= Nt 1 1 + n vht 1 (2)
Labour participation is supposed to be reduced by the epidemic. We assume therefore: Lt = Nt(1 uht) (3)
We assume that physical capital depreciates at a constant rate and we introduce Inv the investment rate:
Kt= (1 )Kt 1+ Inv(h)Yt (4)
Therefore the evolution of per adult income y = ln YN , the variable we are interested in, only depends of the dynamics of the working age population nt = ln(Nt), the labour force
participation rate lt= ln(Lt) ln(Nt), the lagged physical stock of capital kt 1= ln(Kt 1),
the investment rate invt = ln(Invt) and the average years of schooling St:
y(h) = ln(At) + lt(h) + kt(kt 1; invt; yt; nt) lt nt + St (5)
To investigate how the epidemic a¤ects the per capita income through the di¤erent chan-nels, let us note ~xtthe value the variable xtwould have taken if there had been no epidemic.
The various e¤ects of the epidemic on per capita income can be derived from the changes in the di¤erent factors x induced by the epidemic, xt = xt x~t. The derivative of the
production function gives:
yt= (1 ) lt+ ( kt nt) + (1 ) St (6)
As the accumulation equation of physical capital is linear, we have to use a log-linear approximation at the …rst order to replace kt. Introducing g the long-run growth rate
of the economy8: kt Kt Kt 1 1 + g kt 1+ 1 1 1 + g ( invt+ yt+ nt) (7) Denoting K = 11+g, we could rearrange the equation (6) into four components:
yt= K 1 (1 K)( kt 1 nt) + (1 K) 1 (1 K) invt+ 0 S t+ 1 1 (1 K) lt (8) The …rst term measures the positive impact of the diminution of the labour force on per capita capital. The second and the third account for the e¤ects of the disease on investment in both physical capital and human capital. The last one expresses the negative e¤ect of HIV/AIDS on labour market participation. As the above system is linear, we know that there is a set of column matrix fAigti=1 such that:
yt= ~yt+ t X i=1 Ai 0 B B @ invi Si ni li 1 C C A (9)
2.3
The accounting strategy
One may think to estimate the e¤ects of HIV/AIDS on growth by looking separately at the e¤ects on each components of the equation (9), that are investment, schooling, working age population and labour participation. The total e¤ect of the epidemic on the per capita income would be:
yt = t X i=1 Ainvi invi h + A S i Si h + A n i ni h + A l i li h hi (10) However, only the …rst three multipliers, if signi…cant, are likely to be measured directly using regressions. The last term however cannot be measured directly, as there is no available data on participation or on worked hours in most Sub-Saharan African countries. A second strategy could be to estimate directly for the set of countries fig the following equation, where hi
t is the epidemic’s prevalence rate:
yti = ~yti+ hit+ "it (11) This strategy is relevant only if the e¤ects of the epidemic on capital accumulation have already materialized. If this is not yet the case, such an estimation is likely to underes-timate the total e¤ects of the epidemic, by capturing only the short-term e¤ects, that are linked to labor participation.
To assert the relevance of this method, we have to calculate a posteriori the e¤ects of the epidemic on both human and physical capital in order to assess whether or not the impact have already been substantial.
To measure all the e¤ects of HIV/AIDS on growth both in the short and long-term, we propose in this paper the following strategy:
(i) In a …rst step, we estimate directly the e¤ect of the epidemic on productivity.
(ii) In a second step, we estimate separately the e¤ects of the disease on investment, education and the working age population by running the following regressions, where x is one of these variables:
xit= ~xit+ xhit+ "it (12) To do so, we use control variables to instrument the unknown series ~xi
t.
(iii) Using the equation (10) and the previously estimated multipliers xi
h, we will
calcu-late the evolution of the output per adult one should have observed if the epidemic has only in‡uenced education, investment or the total adult population. If the sum of these three components represents a substantial part of the total e¤ect estimated in the …rst step, then the regression (11) is unlikely to underestimate the total e¤ect of the epidemic.
(iv) If the method appears to be valid, we …nally estimate the remaining e¤ect of HIV/AIDS, which is the impact on labour participation, by substracting the e¤ects on education, investment and demography obtained from the direct estimation.
2.4
Common empirical framework
To run the previous regressions, one has to …nd satisfactory determinants of the variables ~
zt being fxt; yt; ytg. Let us assume that:
~ zti = zz~it 1+ K X k=1 z kControlikt 1+ uzi + zt + "zit (13)
where zit is the dependent variable z at time t in the country i, ui is the …xed e¤ect of the
country i, t is the year …xed e¤ect and "CONTROLk" represents the control variables.
To assess the e¤ects of AIDS on demographic, education and macroeconomic variables, we therefore run the following panel within regressions with country and yearly …xed e¤ects: zti = zzt 1i + zhit 1+ K X k=1 z kControlt 1ik + uzi + zt + "zit (14)
The …xed e¤ects take into account the heterogeneity between countries in terms of infrastructure, wealth or religion as well as the impact of global shocks such as crop or oil prices. To take into account autocorrelation problems we run GLS regressions with country …xed e¤ects and with clustered errors within countries. To limit the issue of potential endogeneity of the HIV and other control variables, we only introduce lagged variables at the right hand side of equation (14). This estimation strategy is consistent with the one followed by McDonald and Roberts (2006) and Kalemli-Ozcan (2006).
2.5
Dealing with endogeneity
There are several good reasons to suspect that HIV prevalence could be a¤ected by eco-nomic activity. If this variable were partially endogenous, simple estimations would be biased. Indeed higher growth could attract migrants or fasten urbanization and facilitate the di¤usion of the disease, making then HIV increase with growth. Urbanization could also a¤ect social control over sexual behaviors and contribute to the spread of the epi-demic. It has also been claimed that industrialization, especially mining activities, could favor prostitution and in turn the spread of HIV. Otherwise, countries growing faster may also allocate more resources to health and treatments, reducing the mortality of HIV infected people. However, longer life expectancy of sick people induces higher prevalence rate among the population. To deal with endogeneity, we may think to instrument the series of HIV prevalence rate by external series.
However the epidemic feature of HIV/AIDS induces that prevalence rates are highly autocorrelated. They di¤er across time and from a country to another less because of initial conditions but rather because of particularities a¤ecting the speed of di¤usion of the disease. Therefore …nding an exogenous series directly explaining the level of the epidemic within a country is di¢ cult. It is more relevant to seek rather instruments explaining the speed of di¤usion of the epidemic within a country.
Our strategy to tackle potential endogeneity issues is therefore to build a series of HIV prevalence rate from a theoretical dynamic equation where the speed of propagation of the disease is instrumented. The dynamic of the epidemic is derived from a theoretical model of propagation of HIV presented in the next section.
3
The data: sources, building and robustness
The data are from several international institutions and cover 46 countries of Sub-Saharan Africa on a yearly basis from 1970 to 2007. Data on HIV/AIDS epidemic are brought from three di¤erent sources:
The UNAIDS (2003) epidemiological fact sheets provide raw data on HIV prevalence among pregnant women in rural or urban areas for most countries between 1987 and 2003. The methodology used is consistent over time and countries. However, it is likely to overestimate the extent of the epidemic among the labor force, as young adults are more likely to be infected by HIV. Moreover, as data were collected only on speci…c surveillance site, which could vary across time, these data are volatile and were not collected each year.
The fact sheets[?] report also AIDS cases during the 80s and the early 90s. Collected data are less volatile but may underestimate the extent of the epidemic, as AIDS was not clearly identi…ed as a speci…c disease in the 80s.
Eventually the UNAIDS has recently released estimates of HIV prevalence among the adult population from 1990 to 2007. The UNAIDS used available data9 to
cal-ibrate model-based simulations of the spread of the epidemic. This source provides therefore smoother series.
Unfortunately, using only one of these sources to run empirical estimate is not su¢ -cient to identify the e¤ects of HIV/AIDS on growth. First, because treatments and even diagnosis were poor before the 90s, then the disease, although less frequent, were likely to a¤ect more productivity and fertility at that time. Second, the volatility of growth is sub-stantial in African countries, because of con‡icts, commodity prices volatility and weather hazard. Thus, long series are necessary to identify a convincing e¤ect of HIV/AIDS on growth. Furthermore as the epidemic a¤ected a limited share of the population in most African countries, the thought e¤ect of HIV/AIDS on growth is likely to remain small in the short-run. To obtain robust results, we build three di¤erent estimates of HIV pre-valence rate. The …rst two series are based on UNAIDS data, the last one is our own construction.
3.1
HIV prevalence estimates using prevalence among pregnant
women
The data on HIV prevalence among pregnant women (hpw) have not been collected on a yearly basis. To build a comprehensive dataset, one can …rst use the correlation between urban and rural prevalence (hpwr) within a country to "predict" the national data. To build comparative data mostly between 1982 and 1990, one can use the correlation between AIDS case (Case) and HIV prevalence among women in urban areas (hpwu). AIDS cases were probably less underreported in urban areas, where health facilities are larger and better endowed.
The following equation, where ui is a country …x e¤ect, is estimated, using GLS
regressions, to predict the missing data for HIV prevalence rate among pregnant women in rural area.
9Raw data from the epidemiological UNAIDS fact sheets (2003) and also direct estimates of HIV
hpwrti = rhpwrt 1i + rhpwrt+1i + rhpwu i t+ u
i+ "i
t (15)
Table A1 in appendix gives the correlations between HIV prevalence rate among preg-nant women in rural areas and urban areas. It gives the coe¢ cient used to predict HIV prevalence rate among pregnant women in rural areas. AIDS cases do not appear to be a good predictor of HIV prevalence rate in rural areas. The number of observations predicted using each regression is indicated in the last row “# predict”. Predictions are calculated using the equation (15) and assuming that "i
t = 0. The di¤erent estimations
of the table A1 are used to project HIV prevalence according to available data.
The following equation is used to estimate HIV prevalence rate among pregnant women in urban areas, using the same method. Results are reported in the table A2 in appendix.
hpwuit = uhpwuit 1+ uhpwuit+1+ uhpwr i
t+ uCaseit 1+ u i+ "i
t (16)
HIV prevalence rate among pregnant women in total population is …nally calculated as a weighting average of HIV prevalence rate among pregnant women in rural and urban population. However, pregnant women prevalence rates are available between 1987 and 2002 only. To complete the data set between 198210 and 1987, one can use reported AIDS cases and prevalence rate among the whole population (see table A3 in appendix).
ln(hpwti) = a ln(Caseit) + ui+ "it (17) This is the …rst series of prevalence rate.
3.2
Extension of UNAIDS estimates
UNAIDS estimates are not available for several countries in the early 90s. We use the lower and upper bound estimates to rebuild a main projection (see in appendix table A3, columns 4, 5 and 6).
ln(hivt) = alln(hivtl) + a
uln(hivu
t) + ln(h0) (18)
As linear HIV estimates are likely to be negative for numerous countries before 1990, we run an exponential regression model (see table A3).
ln(hivt) = ln(hivt+1) + a0 ln(Caset) ln(Caset+1) + ln(h0) (19)
HIV prevalence data are projected backward using equation (19). But such a projection is not possible for countries that do not have estimates of HIV prevalence around 1990. Prevalence was indeed not su¢ ciently high to require the collection of data on AIDS in those countries. We use directly AIDS cases as a proxy of prevalence and run the regression (20) on countries with low prevalence rate, (see last column of table A3).
ht = c1Caset+ c2Case2t + c0 for ht< 0:02 (20)
This gives the UNAIDS series reconstructed for the early 80’s.
3.3
Building a new series of HIV prevalence rate based on
propagation dynamics
As HIV prevalence series are evolving substantially across time, it is unlikely to …nd exogenous series allowing to instrument directly the pro…les of the epidemic in several countries. Indeed Werker and al. (2006) managed to instrument HIV prevalence only in a cross-section of countries, but did not provide instrumented time series.
Our approach is to estimate the propagation dynamic of the epidemics from exogenous variables and variables very poorly correlated to growth11. We consider that the spread of
propagation of HIV in a given country and the initial conditions are endogenous. We use therefore several variables arguably independent from growth as instruments. We proceed in three steps. First, we instrument the initial extent of the epidemic (initial conditions) using mostly geographical variables such as the distance to Congo Dem. Rep. (as Oster 2009). Second, we instrument (using a panel-data regression) the spread of propagation of the epidemic using mostly circumcisions rates, religion and road network. Although those variables are quite stable in time they do vary a little (except for circumcision rates because we only have one data for each country). Third, we simulate ”instrumented”HIV prevalence pro…le for each country, starting from the ”instrumented”initial infection, and using the estimated coe¢ cient for our instruments. It is a projection of the speed of propagation of the epidemics.
As the values of the instruments varies from one country to another, the speed of propagation di¤ers and as a consequence, the pro…les are di¤erent. It is worth noting that as the propagation equation is quadratic, the long-term value of the prevalence (as well as the peak value) also depend on each country conditions. For instance, countries with more Muslims will experience lower HIV prevalence rate in the long-run according to our model.
3.3.1 Estimation of the propagation dynamics of AIDS
We build a simple dynamic model of epidemic propagation (see appendix for a full present-ation). The model rests on the marital status of people (single or married), their health status (infected and non infected) and their location (which city). It allows mobility of people from one city to another. Combining these elements, we can deduce the following dynamic of HIV prevalence among the total population. A linear trend is allowed to take into account the global evolution of the HIV/AIDS epidemic.
ht+1 ht= 1( ; ; ;
a ; ; m)h
t 2( ; ; ;
a ; ; m)h2
t + 3t + 4 (21)
To identify this equation, we introduce the following instrumental variables :
The share of unprotected intercourse can depend on time as people become more aware of the disease as HIV spreads across the continent. It may also decrease with the heterogeneity of the population as people might be more cautious with someone they do not know; it is measured by fractionalization indicators12.
11See in apendix a full description of the dynamic model of propagation of the epidemics and the
fondations of the links between the instrumental variables and AIDS dynamics.
12Pongou and al. (2009) show in a network model the link between ethnic composition of the population
The probability of being contaminated by an unprotected intercourse has been proved to be lower for circumcised men13. We therefore introduce the share of
circumcised men in the population as an instrument of the speed of propagation. Geographic mobility can be instrumented using the extent and the quality of the road network. We use the current number of kilometers of roads divided by the number of inhabitants in the country in 198014 and the share of paved roads for
continental countries15. Mobility indicators are expected to increase prevalence. The di¤erential of mortality between healthy and sick people may be impacted by civil con‡icts and wars.
We use the proportion of Muslims as an instrument of the share of faithful people. The rate of mixed unions, m could be also in‡uenced by population fractionalization. These instruments are poorly correlated with growth, which allows to treat them as good candidates as exogenous variables (see table 1).
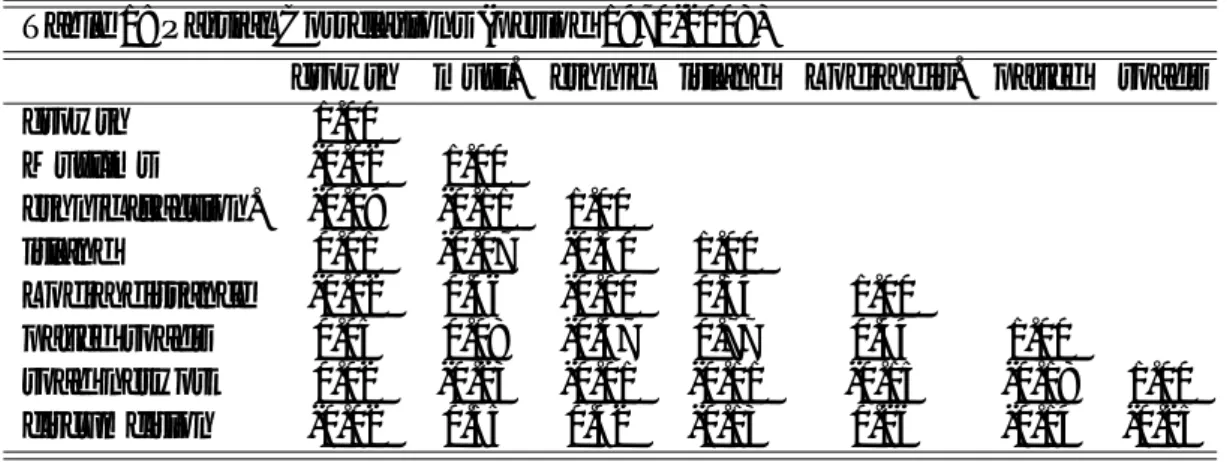
Table 1: Partial Correlations (period 1970-2008)
growth musl. ethnic island Lodja dis. paved roads growth 1.00 Muslims -0.02 1.00 ethnic fraction. -0.09 -0.11 1.00 island 0.01 -0.07 -0.40 1.00 Lodja distance -0.02 0.46 -0.00 0.34 1.00 paved roads 0.05 0.08 -0.47 0.77 0.44 1.00 road network 0.02 -0.23 -0.01 -0.11 -0.15 -0.18 1.00 circumcision -0.02 0.55 0.42 -0.13 0.26 -0.14 -0.25
Rewriting equation 21 with the vector of instruments Zi
t = (1; ethnicit; t; networkti;
pavedit; muslmit; civconfti; civwarit; circumit) and 1 and 2 two vectors of parameters,
the estimated propagation dynamic is:
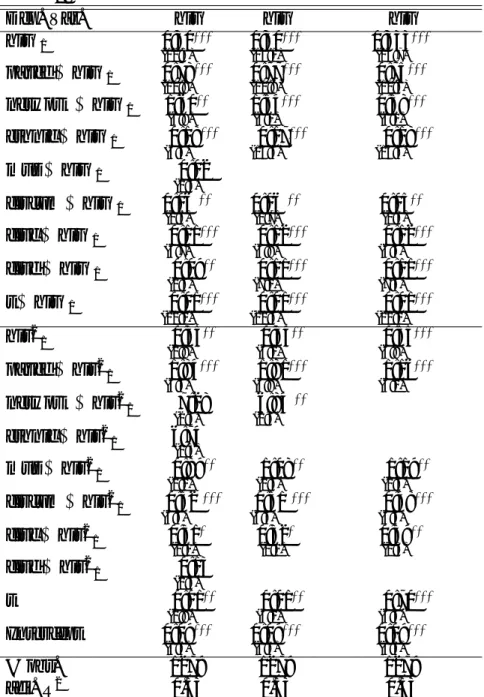
hit = hit 1+ 01Zt 1i hit 1+ 20Zt 1i (hit 1)2+ Tt + 0 + it (22) The results are reported in table 2 below.
13See Weiss and all (2000) or Halperin and Bailey (1999) for a survey or Gray and alli (2007), for a
recent randomized experience in Uganda.
14To avoid capturing demographic growth.
Table 2: Estimation of the dynamic of HIV prevalence Dep. Var. hiv hiv hiv hiv 1 0:30 (12:3) (13:1)0:30 0:333(16:7) paved hiv 1 0:78 (10:8) (10:8)0:77 (10:6)0:75 network hiv 1 1:60 (3:9) 1:54(4:1) 0:58(6:1) ethnic hiv 1 0:18 (5:3) 0:17 (13:5) 0:18 (14:3) mus hiv 1 0:02 (0:3) circum hiv 1 0:06 (2:6) 0:06(2:7) 0:05(2:3) civc hiv 1 0:11 (5:7) 0:12 (5:9) 0:12 (6:4) civd hiv 1 0:09 (2:5) 0:11 (7:1) 0:11 (7:3) t hiv 1 0:01 (21:1) 0:01 (21:3) 0:01 (21:1) hiv2 1 0:35 (2:9) 0:34 (3:0) 0:55 (6:8) paved hiv21 1:84 (4:6) 1:81 (4:8) 1:16 (4:2) network hiv2 1 7:28 (2:5) 6:84 (2:6) ethnic hiv21 6:74 (0:3) mus hiv2 1 0:89 (1:2) 1:08 (2:4) 1:19 (2:6) circum hiv2 1 0:52 (3:4) 0:51 (3:6) 0:48 (3:4) civc hiv2 1 0:31 (2:0) 0:32(2:1) 0:39(2:5) civd hiv2 1 0:13 (0:3) t 0:01 (2:8) 0:01 (3:2) 0:70 (3:4) Intercept 0:09 (4:3) 0:09(4:3) 0:09(4:3) # obs. 1279 1279 1279 adj. R2 0.53 0.53 0.53
; ; indicate respectively signi…cance at the 5%, 1% and 0.1% level.
3.3.2 Simulation of the new series of HIV prevalence rate using the estima-tion of the propagaestima-tion mechanism
We proceed in two steps to build a new series. First, the HIV prevalence rate is estimated for every country in 1990, which is the …rst date for which UNAIDS data is available. As prevalence rate are very small in most countries at this date, we use an exponential regres-sion16. We take as instruments the share of the population being Muslims (muslims), the
share of the population being catholic (catho), the distance D from the main city of the country to Lodja, the city located at the center of the Democratic Republic of Congo17,
16Indeed, linear estimates of HIV prevalence rate would be negative for a large number of countries.
We impute the minimal value of 0.001 for the prevalence rate when actual UNAIDS estimates are below 0.01.
the rate of circumcised male (circum) and (isl) for islands. The results of this estimation are given in equation (23) below.
ln hi1990 = 1:3 (3:2) ln Di 2:2 (3:9)musl i (1 Isli) 14:2 (4:6)Isl i 1:2 (2:3)circ i 2:5 (3:4)catho i+11:9 (3:8)+ i (23) To obtain an unbiased estimation of the prevalence rate in 1990, one should take into account the variance of the error term . Denoting Zi
0 the vectors of instruments used in
equation 23 and 0 the vector of estimated parameters, we have: ^
hi1990 = E[hi1990] = E[e 00Z0i+ i] = e 00Z0iE[e i] = exp V ar[
i]
2 e
0
0Z0i (24)
which gives the estimation of HIV prevalence rate in 1990 for each country.
Second, the estimation of the propagation dynamic of HIV prevalence, given by table 2, is used to build the series forward, starting from the 1990 estimates and assuming null residuals. Therefore, this series does not contain any value of the actual series hi
t.
It is strictly constructed from the values of the instruments. The forward-looking series departing from 1990 is given by:
^
hit= ^hit 1+ 01Zt 1i ^hit 1+ 02Zt 1i (^ht 1i )2+ Tt + 0 if t > 1990 (25) This process is reproduced backward using the reverse of the equation 22 to project the prevalence before 1990: ^ hit 1 = ^ hi t 0 Tt 1 + 0 1Zt 1i + 02Zt 1i hit if t < 1991 (26)
The following graph plots the average of HIV prevalence across Sub-Saharan Africa for each year and for the three di¤erent series, as well as the Oster’s (2009) estimates. It appears that those series di¤er both by their level and dynamic. Our instrumented-simulated series becomes higher than expected since the early 2000 and stabilizes at a higher level. This gap could be explained by a change in behavior, that has not be taken into account by our instruments18. See …gure 6 in appendix for the comparison between our instrumented series and the UNAIDS one for a set of countries.
It is worth noting that our instrumented-simulated series, thought that it is not based on observed AIDS cases, it compares fairly to UNAIDS and Oster series. It expands these series either in terms of the number of countries covered and of time-span. It allows us to perform our accounting exercise going back from early stage of the epidemics.
3.4
Sources of other data
Infant mortality data are available on a …ve-year average basis in the United Nations World Urbanization Prospects. We compute annual data from this source using lin-ear projections. Fertility, life expectancy and demographic data, such as working age population19 or urbanization are published on a yearly basis in the World Development
18Although strong evidence supports such a change in behaviors since 2000, there is unfortunality no
relevant data to measure it, which would be available and comparable for all coutries.
Figure 1: HIV prevalence series by year, average of all Sub-Saharan African countries.
Indicators of the World Bank. Estimates of GDP and net formation of …xed capital (in constant US$), data on roads, development aid and assistance, openness to trade, foreign direct investments and education data including primary and secondary enrolment rate are pulled from the WDI as well. Data on con‡icts are extracted from the third version of the Armed Con‡ict Dataset of the Uppsala Con‡ict Data Program, (UCDP/PRIO, 2007). This dataset contains annual observations of con‡icts about all members of the international system, as de…ned by Gleditsch & Ward (1999), between 1946 and 2006. Data on Muslims and catholic are compiled using several sources such as census data from the UN, household surveys data from the Demographic and health surveys and the CIA fact book. Fractionalization data are from Alesina and al. (2003). Circumcision rates are provided by Williams and al. (2006). All measures of HIV/AIDS used in the following are prevalence rates.
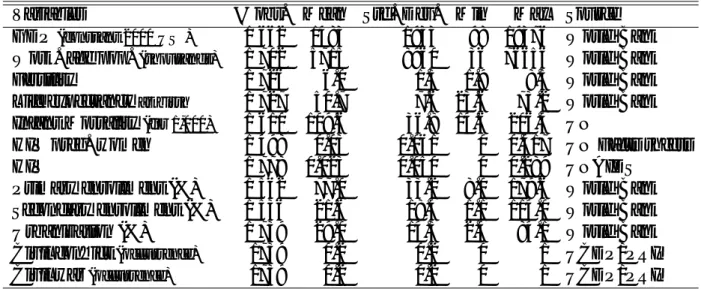
Table 3 : Descriptive statistics
Variables # obs. Mean Std. Dev. Min Max Source GDP (constant 2000 US$) 1 662 1483 1933 98 19376 World Bank Work. age pop. (thousands) 1 702 5715 8960 36 76656 World Bank Fertility 1 726 6.0 1.3 1.9 8.5 World Bank Life expectancy at birth 1 727 50.7 7.6 23.6 73.2 World Bank Infant Mortality (for 1,000) 1 610 109.6 36.8 14.6 206.4 UN
HIV preg. women 1 498 0.03 0.061 0 0.417 UN Facts sheets HIV 1 778 0.023 0.050 0 0.289 UNAIDS
Primary enrollment (%) 1 562 77.0 33.2 8.0 179.6 World Bank Secondary enrollment (%) 1 536 21.6 18.4 1.1 114.0 World Bank Urbanization (%) 1 739 29.0 14.3 2.4 84.1 World Bank Civil con‡ict (occurrence) 1739 0.2 0.2 0 1 UCDP/PRIO Civil war (occurrence) 1739 0.2 0.2 0 1 UCDP/PRIO
Notes: Variables are averaged over 1970-2006. Fertility is the total number of children per woman. HIV prevalence is the previously built variable. Enrollment in primary
and secondary schools are gross. Urbanization is the share of population in urban areas. See Table A5 in appendix for partial correlations between variables.
4
The e¤ects of HIV/AIDS on growth
4.1
Estimation of the direct e¤ect of HIV/AIDS on productivity
growth
A direct way to grasp the e¤ect of HIV/AIDS on growth is to include the epidemic prevalence rate among the regressors. Following equation (14) which gives the common empirical framework for the di¤erent estimations, we run the following regression, where Y stands for the GDP, L for the working age population, HIV for the HIV prevalence rate and cc and cw respectively indicate the occurrence of a civil con‡ict or a civil war20:
ln Y i t Li t = ln Y i t 1 Li t 1 + HIVt 1i + cCvit+ wcwti+ ui+ t+ " i t (27)
By de…nition the ratio of GDP to working age population is a measure of the pro-ductivity per worker, therefore we will use indi¤erently growth or propro-ductivity growth. Table 4 below reports the di¤erent results. Recall that HIV denote the HIV prevalence rate from UNAIDS completed following the methodology described in section 3.2. HWP is the HIV prevalence rate among pregnant women constructed as described in section 3.1 with UNAIDS estimates of prevalence rate in rural and urban zone. And, HIVinst is the series we constructed completely following the model described in section 3.3 using instrumental variables.
20By de…nition, a country experienced a con‡ict when at least 25 and at most 999 battle-related deaths
Table 4 : The e¤ects of AIDS on productivity growth
Dep. var. ln(Y =L) ln(Y =L) ln(Y =L) ln(Y =L) ln(Y =L) ln(Y =L) ln(Y =L) Method Withiny Withiny Within Within Within Withiny Within ln(Y 1=L 1) 0:97 (66:9) 0:96 (34:9) 0:95 (68:1) 0:96 (34:0) 0:96 (24:7) 0:96 (35:1) 0:96 (34:0) HIV 1 0:14 (2:9) 0:11 (2:4) 0:12 (2:1) 0:15 (2:2) HW P 1 0:10 (2:1) HIV inst 1 0:13 (2:2) 0:13 (2:0)
Controls: Civil con‡icts & wars, intercept, year and country …xed e¤ects Add. controls: - - - Reg YFE - - Reg YFE # obs. 1509 1174 1196 1174 1292 1179 1179 # countries 45 45 45 45 45 45 45 Period 70-07 81-07 70-00 81-07 81-04 70-07 81-07 adj. R2 0.95 0.94 0.92 0.94 0.94 0.94 0.94
Notes: ; ; indicate respectively signi…cance at the 5%, 1% and 0.1% level. T-values reported between brackets are calculated by clustering errors by country. Civil wars and civil con‡icts are always negative and signi…cant at least at the 1% level. Additional controls are regional (Northern, Western and Eastern Africa) year …xed e¤ects. Breush and Pagan test rejects homoscedasticity in all con…gurations.
y indicates that the Hausman test con…rms the relevance of country …xed e¤ects.
Table 4 indicates that the lagged growth is the most important determinant and civil con‡icts and wars have the expected negative and signi…cant impact. It is worth noting that the e¤ect of HIV prevalence on growth is neither identi…ed nor signi…cant when both civil disorders variables and yearly …xed e¤ects are not added. This result underlines the necessity to control for the sources of volatility of growth in the short-run.
These estimates are robust to the introduction of regional year …xed e¤ect and the use of any measure of HIV prevalence. We did not use Oster’s prevalence series in our estimates due to its restriction to a fewer number of countries and time-span.
The epidemic prevalence rate has a negative and signi…cant impact on growth. The results are not sensitive to the series used. The magnitude of the coe¢ cient remains similar when using the series built directly from the UNAIDS estimates or the one constructed from the raw data on prevalence among pregnant women.
Moreover, the impact is similar when using the simulated series. As by construction this series is supposed to be more exogenous, the endogeneity bias appears to be limited. Finally, the results is not sensitive to the period (see line Period) of estimation.
Recalling equation (27), we can calculate yet, that is the dynamic of the logarithm of
GDP per working age adult if HIV prevalence had remained null till the early 1980s. e yi t= gyit 1+ cCvi t+ wcwi t+ ui+ t+ " i t (28)
By substracting eq. (28) from equation (27), we can obtain the dynamic of the “AIDS gap”, yt, which is the di¤erence between the actual level of GDP per adult and the
would be GDP per adult if they were no HIV/AIDS. yit= yit yei
t = yti+ HIV i
t (29)
In the short-run, the e¤ect of HIV/AIDS on productivity is limited. A 1 point increase in prevalence rate induces a 0.13 point reduction of GDP per working age adult. But this
negative e¤ect cumulates over time and the “AIDS gap” becomes much larger. In the long-run, the e¤ect of a permanent increase of HIV prevalence h on GDP per working age adult is:
lim
t!1 yt= 1 t!1lim HIVt (30)
Using the second regression (column 2, Period 81-07), a 1 point increase in prevalence induces indeed a 2.75 reduction in productivity in the long-run. Although likely to be negative, the magnitude of the e¤ect remains nevertheless uncertain. Assuming that the distribution of the parameters and is normal, there is no easy analytical expression of the distribution of the ratio 1 . Therefore, we use Monte-Carlo simulations to compute its distribution21. Figure 2 shows the distribution of the long-run e¤ect of a 1 point HIV
prevalence increase on productivity. A 1 point increase in HIV prevalence induces in average a 2.75 point decrease in GDP per working age adult.
Figure 2: Distribution of the e¤ects of a 1 point increase of the prevalence rate
In the long-run, this means that the e¤ect of HIV/AIDS on growth goes far beyond the diminution of the labour force22. This estimate is approximately half of what Bon-nel (2000) obtained. And, it appears to be large compared to McDonald and Roberts’s (2003)23. However, their method is likely to underestimate the e¤ects of HIV/AIDS 21We use a random sample of 10,000 observarions, assuming no correlation between and to plot
this distribution. The distributions of and are assumed to be normal and are calibrated using the estimated expectancy and standard deviation of the regression 2 of table 4.
22If the epidemic just prevented the infected people to work, one should expect the multiplier to be
around 1 in the long-run.
on growth for two reasons. First, they do not take into account the e¤ects of health on both physical and human capital accumulation24. Second, they measured the
ef-fects of HIV/AIDS on growth indirectly using infant mortality as a proxy of workers’s health capital. But contrary to other endemic diseases such as malaria, HIV is well known to hit disproportionately adults, as the main source of infection is unprotected sexual intercourse. Our estimate is also approximately twice lower than Papageorgiou and Stoytcheva’s (2005)25.
To gauge the e¤ect of the epidemics on the di¤erent channels considered in section 1, we investigate its direct e¤ect on the di¤erent variables that determine short and long run growth.
4.2
Estimation of the e¤ects of HIV/AIDS on the sources of
growth
4.2.1 E¤ects of HIV/AIDS on working age population
The direct e¤ect of the epidemic is to reduce life expectancy and demographic growth. Estimation of those straightforward e¤ects of the epidemic reported in the table 5 con…rm that all the presented measures of HIV prevalence are in the relevant interval. The e¤ects appear to be negative and signi…cant either on life expectancy or on working age population.
Table 5 : HIV prevalence rate e¤ects on demographic variables
Dep. Var. LifeEx LifeEx LifeEx ln(L) ln(L) ln(L) Method Withiny Within Within Withiny Withiny Withiny LifeEx 1 0:94 (60:90) 0:98(49:2) (91:3)0:99 ln(L 1) 0:96 (57:3) 0:94(46:7) (108:7)0:96 HIV 1 10:57 (6:6) 0:08 (3:7) HP W 1 6:46 (5:6) 0:04 (2:4) HIV inst 1 3:93 (2:9) 0:07 (3:7)
Controls: Intercept, year and country …xed e¤ects
Controls: ln(GDP=L) Civil con‡icts and wars # obs. 1145 930 1145 1175 957 1180 # countries 45 43 45 45 45 45 Period 81-07 81-04 81-07 81-07 81-04 81-07 adj. R2 0.98 0.98 0.98 0.99 0.99 0.99
Notes: ; ; indicate respectively signi…cance at the 5%, 1% and 0.1% level. T-values reported between brackets are calculated by clustering errors by country. Breush and Pagan test rejects homoscedasticity in all con…gurations
y indicates that the Hausman test con…rms the relevance of country …xed e¤ects.
24Bonnel’s and our own estimates (see section 4.2) indeed indicate that HIV/AIDS a¤ect signi…cantly
both investment rate and school enrollment.
25They reported that each AIDS case (over 100,000 people) induced a 0.3-0.4 points decrease of GDP
per worker. With an average of 22 cases between 1979 and 2000, the epidemic would have costed during this period between 6.5 and 9.0 points of GDP per worker in Africa versus 4.0 pts according to our estimates.
4.2.2 E¤ects of HIV/AIDS on human capital
To assess the e¤ects of the epidemic on human capital, we, …rst, estimate the e¤ect on primary and secondary school enrollment rate, and second we compute the total e¤ect on the stock of human capital.
Determining the e¤ects of HIV/AIDS on enrollment rates requires also some work on the data. Indeed enrollment rates are reported by the World Bank on a …ve-year basis before the late 1990s for most of the African Sub-Saharan countries. Moreover, even on a …ve-year basis, data are not available for the same years across countries. To solve that problem, we propose two methods.
First, we run yearly regressions on existing data xi
t using …ve-year lagged variables.
When the …ve-year lagged …gure xi
t 5 is not available, we use instead dxit 5 the closest
lagged available data within the …ve-year span. This projected lagged value is de…ned as:
d xi t 5= 8 < : xit 5 if xit 5 is de…ned xi t s if s2 [1; 4] and xit s is de…ned (31)
Second, we use linear projection to complete the series. Let us consider the variable xit which values are known only for t 2 K = ftkg. The projected series exit is therefore
de…ne as: e xi t= 8 < : xi t if t2 K tk+1 t tk+1 tkx i tk + t tk tk+1 tkx i tk+1 if t 2]tk; tk+1[ (32)
E¤ects of AIDS on primary school enrollment We use our empirical framework (see equation 14) to identify the e¤ects of HIV/AIDS on school enrollment rates. We introduce also, F oreign Aid, the share of total aid and assistance into GDP as a control variable. The …rst regression run is, denoting P GE the total26 primary gross rate of enrollment as: P GEti = pP GE\i t 5+ pHIVi t 1+ ccci t+ wcwi t+ aAidi t 1+ ui+ t+ " i t (33)
Because of the lack of yearly data before 1990, the number of observations is limited. Regression results are reported in table 6. The equation estimated using projected data is the following. ^ P GEi t = pP GE^t 1i + pHIVt 1i + c ccit+ wcwit+ aAidit 1+ ui+ t+ "it (34)
The epidemic seems to have a negative impact on gross primary enrollment. Although multipliers and standards errors vary widely with the speci…cation, the correlation is signi-…cantly negative using both raw (P GE) and projected ( ]P GE)data. Moreover, estimates obtained using either the UNAIDS or our constructed series are similar.
Table 6 : The impact of HIV/AIDS on primary school enrollment rate
Dep. Var. P GE P GE P GE P GE P GE P GE] P GE] Method Within Withiny Withiny Within Withiny Within Within
\ P GE 5 0:42 (7:2) 0:39(7:6) 0:36(6:8) 0:44(7:2) 0:40(7:5) ^ P GE 1 0:97 (97:8) (80:0)0:97 HIV 1 0:67 (3:1) 0:70 (2:7) 0:84 (2:4) 0:18 (4:2) HIV inst 1 0:68 (2:6) 0:56 (1:8) ? 0:22 (3:1)
Controls: Foreign aid 1, Civil con‡icts and wars, intercept, country …xed e¤ects.
Add controls: YFE Trend R trend YFE Trend YFEz YFEz # obs. 565 565 565 560 560 1432 1123 # countries 46 46 46 45 45 47 46 Period 70-07 70-07 70-07 70-07 70-07 81-07 81-07 adj. R2 0.51 0.42 0.45 0.50 0.41 0.96 0.95
Notes: ?; ; ; indicate respectively signi…cance at the 10%, 5%, 1% and 0.1% level.
T-values reported between brackets are calculated by clustering errors by country. Breush and Pagan test rejects homoscedasticity in all con…gurations
y indicates that the Hausman test con…rms the relevance of country …xed e¤ects.
Additional controls are year …xed e¤ects (YFE), linear yearly trend and regional yearly trend. z Estimates remain similar and signi…cant when using rather a yearly trend.
Deriving from equations 33 and 34, we can compute the long run e¤ect of a permanent rise of HIV prevalence on primary school as:
lim t!1 P GEt HIV = p 1 p (35)
Computing this …gure with the coe¢ cients of the …rst and …fth regressions (columns 1 and 5 in table 6) yields that a 1 point permanent increase of HIV prevalence induces a fall of respectively 1 and 6 points of the primary school enrollment rate in the long-run. The impact of the epidemic on schooling, although uncertain, appears to be very large. Given the uncertainty on the model, we will assume in the following that:
lim
t!1
P GEt
HIV 3 (36)
E¤ects of AIDS on secondary school enrollment rate We follow the same meth-odology to estimate the e¤ects of HIV/AIDS on the secondary school enrollment rate, except that we control for the evolution of the primary school enrollment rate. The es-timated equation of the impact of HIV prevalence rate on secondary school enrollment rate is :
SN Eti = sSN Et 1i + P N Et 1i + sHIVt 1i + cccit+ wcwti+ ui+ t+ " i
t (37)
Regression results are reported in table 7 below. The negative e¤ect of HIV on secondary school enrollment is less pronounced than for primary education. There is no signi…cant
e¤ect of HIV prevalence when using the raw data. However when using projected data, HIV seems to have a negative e¤ect on secondary school. But the uncertainty of such e¤ect remains large. There is no signi…cant e¤ect using our instrumented measure. As the instrumented measure di¤ers from the UNAIDS one mostly for the recent years, this may suggest that it is still too early to assert the consequences of HIV on secondary education.
Table 7 : The impact of HIV prevalence rate on secondary school enrollment rate Dep. Var. SGE SGE SGE] SGE] SGE] SGE] SGE] Method Withiny Withiny Withiny Withiny Withiny Withiny Withiny
\ SGE 5 0:40 (2:8) 0:40(3:0) \ P GE 5 0:08 (2:3) 0:08(2:3) ^ SGE 1 0:96 (60:2) 0:96(61:8) 0:95(63:3) 0:95(60:4) 0:96(60:0) ^ P GE 1 0:02 (3:1) 0:02(3:6) 0:02(3:6) 0:02(3:6) 0:03(4:1) HIV 1 0:02 (0:0) (2:2)0:07 0:07 (2:2) 0:10 (2:2) HIV inst 1 0:05 (0:2) (1:9)0:07 ? 0:06 (1:8) ?
Controls: Foreign aid 1, Civil con‡icts and wars, intercept, country …xed e¤ects.
Add controls: YFEz YFEz YFE Trend RYFE YFE Trend # obs. 504 500 1090 1090 1090 1089 1089 # countries 46 46 46 45 45 47 46 Period 70-07 70-07 81-07 81-07 81-07 81-07 81-07 adj. R2 0.66 0.66 0.97 0.97 0.97 0.97 0.97
Notes: ?; ; ; indicate respectively signi…cance at the 10%, 5%, 1% and 0.1% level.
T-values reported between brackets are calculated by clustering errors by country. Breush and Pagan test rejects homoscedasticity in all con…gurations
y indicates that the Hausman test con…rms the relevance of country …xed e¤ects. Additional controls are year …xed e¤ects, linear yearly trend and regional yearly trend. z Estimates remain similar and no signi…cant when using other time speci…cations.
To assess the impact of the epidemic on secondary enrollment, one has to take into account the direct e¤ect, and the indirect one, through the diminution of primary school enrollment rate. The derivative of from our linear speci…cation in equation 37, the total e¤ect of HIV on secondary education is given by
SGEt HIV = s SGEt 1 HIV + P GEt 1 HIV s (38)
Therefore, in the long-run, the total e¤ect of HIV/AIDS on secondary enrollment rates becomes: lim t!1 SGEt HIV = s 1 s 1 s p 1 p (39)
As before, the evaluation of the multiplier depends of the model. Given the uncertainty, we choose:
s
Taking the coe¢ cients of the third regression (column 3, table 9) gives that, a 1 point increase of the HIV prevalence induces a permanent fall of 2.4 point of the secondary school enrollment rate. However, taking the maximal estimates of both p and s would
lead to a far larger multiplier, about 4.8. The impact of HIV/AIDS on the investment in human capital may therefore be really high in the long-run.
Assessing the long-run e¤ect of AIDS on human capital We consider the average schooling years as the proxy of human capital. To assess the e¤ects of HIV/AIDS on human capital, one has to transform the variations in enrollment rates into variations in the average schooling years. Theoretically, one can link enrollment rate and schooling years, if the average number of completed grades (Dj) by level j = fp; sg is known, as follows:
S = Dp P N E + Ds SN E (41) However, the Dj …gures are not precisely known and could also vary across time, as
educational system betters. A crude approximation could be to assume that Dj = Dj
2
where Dj is the o¢ cial duration of the level j. To test the sensitivity of such an hypothesis, we use the available (although scarce) data on the years of schooling. Barro and Lee (2002) report such …gures for 30 countries between 1985 and 2000. To this dataset, we add recent estimates for 42 countries, using household survey data27. Three speci…cations are used to regress years of schooling on gross enrollment rate. A more convincing regression would have to introduce lagged value of the years of schooling. However, there is not enough data to obtain signi…cant estimates of the e¤ects of enrollment on schooling using this speci…cation. Because there is only a few years for each country, we do not introduce either country or years …xed e¤ects. The regression is therefore:
Sti = bpP GE^i
t 5+ bsSGE^ti+ S0 + "it (42)
This equation is estimated using a within regression:
Sti = 1:55 (3:6) ^ P GEi t 5+ 5:84 (8:0) ^ SGEi t+ +0:51 (1:6) + " i t , adj:R 2 = 0:32 , # obs. = 149 (43)
According to those results, a 1 point increase of HIV prevalence would induce a reduction of average human capital by 0.18 years of schooling.
Thus, considering that an additional year of schooling increases productivity by about 7% as ln(Y =L)S 0:07 , a 1 point increase of HIV prevalence would diminish productivity through human capital by approximately 1.3 point. Therefore approximately 45% of the long-run e¤ect of HIV/AIDS on growth could be due to a permanent reduction of human capital.
4.2.3 E¤ects of HIV/AIDS on physical capital
As there is no data on physical capital stocks at the national level, we consider rather the e¤ects of the epidemic on investment. The e¤ects of HIV/AIDS on physical capital can indeed be approximated knowing the marginal e¤ects of the epidemic on the investment rate.
Impact of AIDS on investment Investment rates can be computed using GDP and gross capital formation both in current or constant US$. We use the same framework (the theoretical background model and equation 14) to assess the e¤ects of HIV/AIDS on investment. We denote inv the investment rate computed as the ratio of the annual gross capital formation to GDP. In the following regressions, civil con‡icts appears to be never signi…cant. Therefore, we only present the regressions without this variable. However, we introduce the openness to trade ratio, open28, and the share of foreign direct investment in the GDP, f di. Using both current and lagged values of those indicators allows to capture both short and medium run e¤ects of openness to trade. Indeed investment is likely to be pro-cyclical and to overreact in the short-run to foreign activity.
ln(invti) = kln(invt 1i ) + kHIVt 1i + oopenit+ o1openit 1+ ff diit+ f1f diit 1(44) + wcwit+ ui+ t+ "it
Regressions results are reported in table 8. Regressions indicate that HIV prevalence has also a negative impact on investment. As physical investment reacts more quickly than education investment, the negative e¤ects of HIV/AIDS on physical capital a¤ect the economy more rapidly. This e¤ect although large varies however with the speci…cation. Estimates depend of the measures and are only signi…cant at the 10% level when using the pregnant women prevalence rate and the instrumented measure of HIV prevalence. This seems to indicate that if HIV is likely to dampen investment, its e¤ect may depend on country speci…c conditions. One may think consequently that the adverse e¤ect of the epidemic on physical capital accumulation might be mitigated, at least to some extent.
Impact of AIDS on physical capital To calibrate precisely the e¤ect of the epidemic on productivity, one should estimate a Solow-type growth model. However, the lack of long-series for both human and physical capital has prevented such an exercise29. To
assess the long-run e¤ect of HIV/AIDS, let us recall the capital accumulation equation 4, from which we can deduce:
Kt Yt = 1 1 + g Kt 1 Yt 1 + Invt) lim t!1 Kt Yt = limt!1Invt 1 11+g (45) As a consequence, we have in the long-run:
Kt/ Yt Invt ) @ ln(K) @HIV = d ln(Y ) dHIV + @ ln(Inv) @HIV (46) This allows to deduce the e¤ect of HIV/AIDS on GDP through physical capital accumu-lation @ ln(Y )@HIV
K: @ ln(Y ) @HIV K = @ ln(Y =N ) @ ln(K) @ ln(K) @h = k 1 k 1 (47)
As argued above, the parameter has not been estimated. We use here the historical average of the investment rate as a proxy of , that is @ ln(K)@ ln(Y ) = 0:2 . With such a
28Openness is computed as the sum of the share of imports and exports into GDP.
29From the investment series, we have produced series for physical capital stock assuming constant
value for , the long-run e¤ect of a permanent 1 point rise of HIV prevalence on pro-ductivity through capital accumulation is about -0.9 when using the estimates of the …rst regression (column 1 table 8). Choosing a of 0.3 would increase this estimation up to -1.3. Therefore, physical capital accumulation explains approximately one third of the total e¤ect of HIV/AIDS on productivity.
Table 8: The impact of HIV prevalence rate on investment
Dep. Var. ln(inv) ln(inv) ln(inv) ln(inv)x inv ln(inv) ln(inv)
Method Withiny Withiny Within Within Withiny Withiny Withiny ln(inv 1) 0:63 (16:4) (13:0)0:63 0:54(8:0) (72:0)0:91 0:59(7:9) 0:64(13:0) inv 1 0:54 (4:5) HIV 1 0:58 (3:0) 0:60 (3:2) 1:01 (2:4) 0:19 (1:8) ? 0:17 (2:2) HP W 1 0:23 (1:8) ? HIV inst 1 0:46 (1:8) ?
Controls: Civil wars, open, open 1, f di and f di 1, intercept, year …xed e¤ects
Add. Controls: Country …xed e¤ects Country …xed e¤ects # obs. 1042 1225 737 794 1046 847 1047 # countries 45 45 45 36 45 45 45 Period 81-07 70-07 90-07 81-07 81-07 81-07 81-07 adj. R2 0.59 0.62 0.49 0.73 0.51 0.56 0.58
Notes: ?; ; ; indicate respectively signi…cance at the 10%, 5%, 1% and 0.1% level.
T-values reported between brackets are calculated by clustering errors by country.
y indicates that the Breush and Pagan test rejects homoscedasticity and that Hausman test con…rms the relevance of country …xed e¤ects.
x indicates that the regression has been run using the investment rate in constant (2000) US$ rather than current US$. Because of BP test rejection, no country …xed e¤ects were added.
5
Computing the long run dynamic e¤ects of the
epi-demic on growth
The epidemic a¤ects productivity through four di¤erent channels: the demography, phys-ical and human capital and labor participation/technphys-ical change30, as pointed out by the following equation: d ln(Y =N ) dHIV = @ ln(Y =N ) @ ln(N ) @ ln(N ) @HIV + @ ln(Y =N ) @ ln(K) @ ln(K) @HIV + @ ln(Y =N ) @S @S @HIV (48) +@ ln(Y =N ) @ ln(L) @ ln(L) @HIV
To calculate the e¤ects of HIV/AIDS on the di¤erent components, we derive from equation (14) the cumulated e¤ects of the epidemic on the variables zti as zti:
zti = zit zei t=
z
zt 1i + zHIVt ; z = fk; S; l; ng (49) 30There is no data allowing to disentangle the e¤ects of the epidemic on labor participation (hours
We have estimated so far the three …rst components and the total e¤ect. As it is not possible to estimate the impact of HIV/AIDS on labor participation/technological change because of the lack of data, we will calculate this latter e¤ect by substracting the three …rst one to the total e¤ect. Recalling equation 7, the e¤ect of HIV on productivity through labor participation/technological change is indeed:
@ ln(Y =N )
@HIV L= lt = yt ( kt nt) (1 ) St (50) The evolution of the working age population a¤ects the GDP per adult through two opposite channels. On one hand, the diminution of the population, all other things re-maining equal, increases physical capital per worker. On the other hand, the reduction of the size of the economy gradually reduces the level of investment and the stock of capital. In a Solow-type model, output per adult does not depend on the size of the population in the long-run. Therefore, the net e¤ect of demography is null in the long-run. To dis-entangle the e¤ects of demography and capital, let us de…ne Kt the level the stock of capital would reach if it were not a¤ected by the evolution of the adult population. From equation 8, we can obtain the dynamic of Kt:
kt = Kt
Kt = K kt 1+ (1 K)( invt+ yt) (51) The net e¤ect of the demography on productivity is:
@ ln(Y =N )
@HIV N = ( kt kt nt) (52) Consequently, the e¤ect of HIV on productivity through physical capital becomes:
@ ln(Y =N )
@HIV K = kt (53)
5.1
Illustration with an average country of the composition of
the HIV/AIDS e¤ects
We then can compute the dynamic e¤ects of HIV/AIDS on the logarithm of per adult income through the four di¤erent channels. To illustrate the results we consider the average country which endures the average HIV prevalence of the all 46 African Sub-Saharan countries for which data are available. Between 1980 and 2010, AIDS would have already reduce GDP per worker by about 8.0 points. By comparison, the cumulated e¤ects of civil con‡icts and wars in Sub-Saharan Africa between 1980 and 2010 would have been a reduction in per worker GDP about 17 points in average31.
For the same average country, the decomposition of HIV/AIDS e¤ects on the GDP per capita growth rate is illustrated by the …gure 4 below. It appears that the HIV/AIDS e¤ect has already reached its peak around the year 2000. The long-term e¤ects of HIV on growth, although huge, may be compensated by increased e¤orts in education and capital markets.
Figure 3: E¤ects of HIV/AIDS on the level of GDP per adult in the average Sub-Saharan African country (Simulation using the estimated parameters).
Figure 4: E¤ects of HIV/AIDS on GDP per adult annual growth rate in the average Sub-Saharan African country