HAL Id: hal-01187445
https://hal.archives-ouvertes.fr/hal-01187445
Submitted on 13 Jul 2016
HAL is a multi-disciplinary open access
archive for the deposit and dissemination of
sci-entific research documents, whether they are
pub-lished or not. The documents may come from
teaching and research institutions in France or
abroad, or from public or private research centers.
L’archive ouverte pluridisciplinaire HAL, est
destinée au dépôt et à la diffusion de documents
scientifiques de niveau recherche, publiés ou non,
émanant des établissements d’enseignement et de
recherche français ou étrangers, des laboratoires
publics ou privés.
Detecting topics and overlapping communities in
Question and Answer sites
Zide Meng, Fabien Gandon, Catherine Faron Zucker, Ge Song
To cite this version:
Zide Meng, Fabien Gandon, Catherine Faron Zucker, Ge Song. Detecting topics and overlapping
communities in Question and Answer sites. Social Network Analysis and Mining, Springer, 2015, 5
(1), pp.27:1-27:17. �10.1007/s13278-015-0268-y�. �hal-01187445�
(will be inserted by the editor)
Detecting topics and overlapping communities in Question
and Answer sites
Zide Meng · Fabien Gandon · Catherine Faron-Zucker · Ge Song
Received: date / Accepted: date
Abstract In many social networks, people interact based on their interests. Commu-nity detection algorithms are then useful to reveal the sub-structures of a network and in particular interest groups. Identifying these users’ communities and the interests that bind them can help us assist their life-cycle. Certain kinds of online commu-nities such as question-and-answer (Q&A) sites or forums, have no explicit social network structure. Therefore, many traditional community detection techniques do not apply directly. In this paper, we propose an efficient approach for extracting data from Q&A sites in order to detect communities of interest. Then we compare three community detection methods we applied on a dataset extracted from the popular Q&A site StackOverflow. Our method is based on topic modeling and user member-ship assignment and is shown to be much simpler and faster than the state of the art methods while preserving the quality of the detection.
Keywords Overlapping Community Detection · Question Answer sites · Topic Modeling
Zide Meng
INRIA Sophia Antipolis M´editerran´ee, 06900 Sophia Antipolis, France E-mail: [email protected]
Fabien Gandon
INRIA Sophia Antipolis M´editerran´ee, 06900 Sophia Antipolis, France E-mail: [email protected]
Catherine Faron-Zucker
Univ. Nice Sophia Antipolis, CNRS, I3S, UMR 7271, 06900 Sophia Antipolis, France E-mail: [email protected]
Ge Song
INRIA Sophia Antipolis M´editerran´ee, 06900 Sophia Antipolis, France E-mail: [email protected]
1 Introduction
Question-and-answer sites (Q&A sites) initially aimed at enabling users to ask ques-tions to a community of experts. Since these user-generated contents can be viewed and searched again, people with the same or similar questions can find answers by browsing or searching the questions that were already answered. On one hand, Q&A sites have become huge repositories of question-answer content which support highly valuable and highly reusable knowledge [3]. On the other hand, Q&A sites also con-tain a large number of users who keep contributing questions and answers. And most of them are more likely to ask questions on topics they are interested in and answer questions in topics they are experts of.
Therefore, we believe that there are two main resources in Q&A sites: the users’ network and the Q&A content. From a user’s perspective, detecting communities of interests is useful to reveal the sub-structures of the user network and identify rele-vant peers. From the perspective of content, extracting topics is required to uncover the key subjects from massive content. So we are interested in the following research questions: Can we detect communities of interests in Q&A sites? Can we identify the common topics that bind them? Detecting communities of interests can contribute to the question routing problem [16][29], which is very important in Q&A sites opti-mization problems. It can also contribute to the community management, for instance by allowing to track the interest evolution or community evolution in Q&A sites.
Many community detection algorithms have been developed to discover sub-structures in social networks. Q&A sites support social networking, however, unlike networks such as Facebook, there are no explicit relationship-based links between their users. In fact, Q&A sites capture the users connected by question-answer links or co-answer links. The users are not mainly concerned with no aware of the links ex-isting between them. The social network is said to be implicit. As a result, compared with other classical social networks, Q&A networks contain more star-shape (many people link to a user) structures than triangle-shape (people link to each other) struc-tures. According to [22], the number of triangle-shape structures per user in twitter dataset is 821, while in our experiment dataset, the number of triangle-shape struc-ture per user is 30 which is far less.Moreover, people have multiple interests i.e. they belong to several communities of interests. It is therefore important to be able to detect their overlapping communities of interests.
Adapting the document clustering algorithm to the user clustering problem, sim-ilarly to [17], we first applied a classic document clustering algorithm, LDA [4], to assign each user into several topic clusters by replacing the documents by the users, and the document words by the tags acquired by users. The results were encouraging, however, the complexity of the probabilistic model was prohibitive. Analyzing the LDA model, we found that it largely exploits tags’ co-occurrence. This inspired us to design a much simpler and faster algorithm to detect topics. Then based on the detected topics, we were able to identify the users’ interests.
So the main contributions of this paper are,
– To propose a topic detection method to extract topics based on question tags. – To propose a user interest detection method to discover the overlapping
The rest of the paper is organized as follows. Firstly, we survey the state of the art of community detection approaches, and point out the differences among these works. Secondly, we introduce an empirical method to detect topics. Then we assign each user to these detected topics based on their interaction behaviors. Thirdly, we conduct several experiments. It shows that our approach is much faster and simpler compared with other classic approaches, e.g. LDA [4], SLPA [24], and a Hierarchical clustering algorithm, while preserving the quality of the detection. Finally, we discuss about those methods and conclude on our contribution.
2 Related Work
We distinguish between three kinds of approaches for community detection depend-ing on their characteristics: Graph-based methods are based on network structure; Clustering methods are based on the similarity of user profiles; LDA-based methods use probabilistic graphical model.
2.1 Graph-based methods
A first and direct solution is to extract an implicit network structure (such as question-answer network, co-question-answer network, etc.) from interaction traces to come down to a traditional community detection problem on social networks. Since intuitively, users are grouped by interests, and most of their interactions are based on shared inter-ests, it is reasonable to induce a network structure from these interactions and then run community detection algorithms on the network. Many classical algorithms have been developed such as [24][2]. There are many constraints when adopting these methods. First, they do not take into account node attributes nor link attributes. Take co-answer network as an example, where nodes represent users and links represent users answering the same questions. In case two users are connected, these methods can only indicate that they have answered the same questions many times. They can-not provide the information whether they have answered questions on the same topic or on different topics. Second, some of the work [6], adopting this approach cannot detect overlapping communities, while some work such as [24][11][10][12] detect overlapping communities.
2.2 Clustering methods
Community detection can also be envisioned as a clustering problem. By computing similarities between user profiles, one can detect groups according to clustering re-sults. The choice of the similarity metrics is quite important and largely influences clustering results. To find similar interests, we first have to define the distance be-tween user’s interests and the definition of this distance has a strong influence on the clustering results. For instance, we can consider a bag of tags with their weights to represent an interest, then compute the weighted tag distance to define the interest
distance between two users. Clustering methods, such as [25][8], group users ac-cording to their features. They do not take the network structure into consideration. Moreover, some clustering algorithms normally output hard-partition communities, one user can only be assigned to one interest group. However, in the scenario we are interested in, a user often has more than one interest and should be assigned to more than one group simultaneously. This is a constrain for those hard-partition algo-rithms. [5] use spectral clustering to detect topic from tag co-occurrence graph. The difference is we only run spectral clustering on selected tags (taken only 10% of all tags) co-occurrence graph which is more efficient, besides, [5] does not give details on how to compute the topic tag distribution and user topic distribution while we do.
2.3 LDA-based models
A third approach consists in using a probabilistic graphical model for both the user profiles and the network structure to solve community detection problem. For ex-ample, [28] transfer links to binary node attributes, then use a LDA-based model to detect communities. [21] use a LDA-based method on social tagging systems where users label resources with tags, but they do not consider the problem of overlapping community detection. [23] use an extended LDA-based model to analyze academic social networks in order to find expert authors, papers and conferences. A problem of these LDA-based models is that they normally assume soft-membership [26] which means that a user cannot have high probabilities to belong to several communities simultaneously. That is to say that the more communities a user belongs to, the less it belongs to each community (simply because probabilities have to sum to one). Moreover, [18] and [14] also use statistic model to detect overlapping communities. The difference is that LDA-based models normally integrate topic detection which can be used to interpret detected communities while the two above cited methods only detect overlapping communities without any topic information on each detected communities.
2.4 Short Summary
Table 1 summarizes the main features of the three approaches. Graph-based ap-proaches normally use link information while ignoring node attributes. Some of them cannot detect overlapping communities or provide membership ratios which are weights denoting to what extent a user belongs to a community. Most of these methods can not identify the topic in each detected community. Clustering approaches use node attributes to group similar users. Some of their results are hard-partition com-munities, with no overlapping and no membership information. LDA-based models overcome the shortcomings of graph-based and clustering approaches, using both node attributes and link information. Besides, LDA-based models normally combine community detection with topic detection, which could be used to interpret detected communities. Our proposed method is similar to LDA-based methods. Both can de-tect overlapping communities and identify the topics at the same time. However, our
method is different with LDA-based models in the sense that these methods normally assume soft-membership [26] which means that a user can not have high probabilities to belong to several communities simultaneously. Our method does not have this lim-itation. In addition, our proposed method is much simpler and faster than LDA-based methods while preserving the quality of the detection.
Table 1: Comparison of the main approaches and our method
uses nodes uses links overlap membership topic Graph-based no yes few few no Clustering methods yes no few few no LDA-based yes yes yes yes yes Our-method yes yes yes yes yes
3 Models and Solutions 3.1 Problem Definition
In StackOverflow1, a user submits a question, then assigns 1∼5 tags to indicate the key topics of this question. Other users who are interested in the question may provide answers to the question or comments to other answers. As tags attached to a question can reflect its domain, users answering the question can be considered as interested by this domain. Let U = {u1, u2...un} be the set of users, Q = {q1, q2...qm} the
set of questions and T = {t1, t2...tv} the set of tags. We aim at (1) extracting
top-ics T opic = {topic1, topic2...topick} from T , and for each topick ∈ T , defining
topick = {pki, pkl...pkj} where pkidenotes the probability of tag ti to be related
to topick; and then (2) detecting users’ topic based interests. For a user ui ∈ U ,
we define Ii = {Ii1, Ii2...Iik} where Iikdenotes the probability of ui to be related
to topick. (3) detecting users’ topic based expertises. For a user ui ∈ U , we
de-fine Ei = {Ei1, Ei2...Eik} where Eikdenotes the probability of uihas expertise on
topick.
3.2 Question Tag Enrichment
We have empirically found that the first tag of a question normally indicates the domain of the question if sorting question’s tag according to its global frequency. For example, a question tagged with {c++ iostream fstream} is related to c++; A question tagged with {html css height} is related to html. However, there are also some questions that only have less and low popular tags, like a question tagged with {ant} or a question tagged with {qt boost}. For these questions, the domain is not obvious. The enrichment process is described in Algorithm 1. In pre-process (line 1-15), for each tag in a question, we compute the frequency of its first tag and record it
in a hashmap. For example, we have three questions tag list, {html css height}, {html css layout}, and {c# gui layout} then, tag html’s first tag frequency map is {html:2}, tag css’s map is {html:2}, and tag layout’s map is {html:1,c#:1}. After processing with all question tags, we normalize the frequencies (line 16-21). For instance tag css’s first tag map becomes {html:1.0} and layout’s map becomes {html:0.5,c#:0.5}. In order to lower the probability of low frequency tag as first tag, we use the Equation 1:
normalize(tag) = record f req
sum(record f req)∗ sigmoid(f requency) (1)
where, record f req denotes the co-occurrence of first-tag and tag, sum(record f req) denotes the sum of these recorded frequencies, f req denotes the global occurrence of the first-tag, σ(x) is sigmoid function, which is used as a squashing function for numerical stability. The value of sigmoid function is between 0 and 1. However, the shape of this function is largely determined by parameter k. Considering the maxi-mum value of tag frequency (tag c#:31801) in our dataset. we chose k as 0.001 (dotted line), which will lower the probabilities of low frequency tags as first-tag while main-taining the probabilities of high frequency tags as first-tag. Figure 1 recalls shape of the sigmoid function for different value of k.
Fig. 1: Shape of function(1+e−k∗z1 )for different value of k
For example, if the first-tag frequency map for css is {html:10, jquery:2}, then, when normalizing first-tag html, record freq is 10, sum(record freq) is 12, frequency is 5552 that is the occurrence of tag html in all the questions. As a result, normalize (html) is equal to 0.8301. which means the probability of html as css´s first-tag is 0.8301. For each tag, we therefore provide a list of enriching first-tags with estimated probabilities.
We also observed that the relations between tags mainly have two possibilities. One is vertical relation, for instance, java is more general than ant. Another one is
horizontal relation, for instance, java is more general than debugging, and debugging could also be considered as more general than java since debugging can be applied to any programming language. So, only by one tag, such as debugging, we can not de-termine the enriched tag. Therefore, In enrich-processing (line 22-40), given a ques-tion’s tag list, we fetch the top 5 first-tags (with the highest probabilities). Then we accumulate the corresponding probabilities with a discount taking into account the position of the tag in the tag list associated to the question, as shown in equation 2.
pj= p1,j + p2,j∗ dis + ... + pk,j∗ disk−1f orj ∈ [1, V ], k ∈ [1, K] (2)
Where pjdenotes the probability of the jthtag being a first-tag for a given question,
pk,j denotes the probability for the kth tag to have the jth tag as its first-tag, V
denotes the number of all the first-tags, K denotes the number of tags in the given question and dis denotes the discount due to the position, we tune the parameter dis between 0 to 1 and empirically set it as 0.5.
Then we consider the tag with the highest probability as the enriching first-tag. If this first-tag already exists in the original tag list, we simply skip the insertion, or else we insert it at the first position of the question’s tag list. We processed 242552 tag lists from the StackOverFlow Q&A site, and our method enriched 33622 of them (13.5%). Table 2 presents the results of the enrichment of 8 tag lists (enriched tags are in bold).
3.3 Topic Extraction
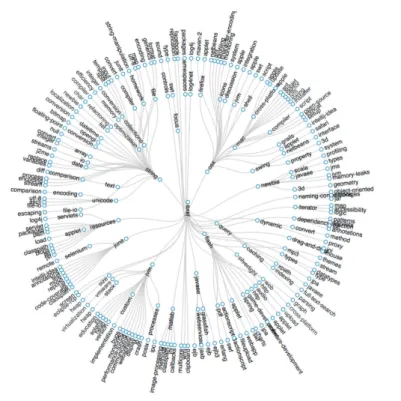
From the observation of our dataset, we confirmed the natural intuition that high fre-quency tags are more generic and low frefre-quency tags are more specific, and most of the low frequency tags are related to a more generic tag. Similar observation was also found in [19]. Besides, [27] shows that tag frequency in Q&A sites also satisfy power law distribution [1]. For example, for a question tagged with {c++, iostream, fstream} (with tags sorted according to their frequencies), we could find that it was related to c++ and to the iostream topic of c++, and more specifically, that it fo-cused on fstream. This inspired us to build a tag tree to extract that and compute the probability for a tag to be related to a topic. We describe the process in Algorithm 2. In the build trees process (line 1-14), we build a tag tree according to the position of tags in a question, and record the occurrence of each node. For example, let us consider three question tag lists: {html, css, height}, {html, css, layout}, and {c#, gui, layout}. We build two trees. The root of the first tree is html, the occurrence of this node is 2, it has only one child css, which occurrence is 2, and this node has itself two children, layout and height, the occurrence of each of them is 1. The root of the second tree is c# with 1 occurrence. Figure 2 and 3 show examples of html and java’s prefix tag tree.
By processing all question tag lists, many trees are generated with different sizes. We construct an affinity matrix only for those root nodes (line 15-23). The similarity
input : tag list of questions output: enriched tag list of questions
1 /*pre-process*/ 2 tag firsttags map={} 3 foreach taglist of question do
4 first tag=taglist[0]
5 foreach tag in taglist do
6 if not tag firsttags map.contain(tag) then 7 tag firsttags map[tag]={}
8 end
9 if tag firsttags map[tag].contain(first tag) then
10 tag firsttags map[tag][first tag]++
11 else
12 tag firsttags map[tag][first tag]=1 13 end
14 end 15 end
16 /*compute probability process*/
17 foreach tag,domaintags in tag firsttags map do 18 foreach first tag,freq in domaintags do
19 normalize=freq/sum(freq) ** tag firsttags map[tag][first tag]=normalize
20 end
21 end
22 /*enrich-process*/
23 foreach question’s taglist: do
24 temp first tag map={} 25 foreach tag in taglist do 26 discount=1
27 get top 5 first tag from tag firsttags map[tag]
28 foreach first tag,value in top 5 do
29 value=value*discount, discount*=0.5 30 if temp first tag map.contain(first tag) then 31 temp first tag map[first tag]+ =value
32 end
33 temp first tag map[first tag]=value
34 end
35 end
36 enrich tag=get top first tag from temp first tag map
37 if enrich tag not in taglist then
38 taglist.insert(enrich tag)
39 end 40 end
41 ** In order to lower the probability of low frequency tag as first tag. we actually use Equation 1
Algorithm 1: tag enrichment
of two nodes is computed according to Equation 3,
Simi(root i, root j) = I(root i, root j)
I(root i) + I(root j) (3)
where I(root i, root j) denotes the co-occurrence of two tags, and I(root i),I(root j) denotes the occurrence of tag I(root i) ,tag I(root j) separately. Then we run spec-tral clustering [20] on the affinity matrix to group these root nodes into topics. As
input : enriched tag list of questions output: topic-tag distribution
1 /*build trees process*/
2 trees=[0,{}] /* tag frequency and subtree */ 3 foreach question’s taglist do
4 cur tree=trees
5 foreach tag in taglist do
6 if cur tree[1].contain(tag) then 7 cur tree[1][tag][0]+=1 8 end
9 else
10 cur tree[1][tag]=[1,{}]
11 end
12 cur tree=cur tree[1][tag] 13 end
14 end
15 /*build affinity matrix for root tags*/
16 root tags=trees[1].keyset()
17 root tags affinities=[#root tags][#root tags] 18 foreach root i in root tags do
19 foreach root j in root tags do
20 value=#(root i,root j)/(#root i+#root i)
21 root tags affinities[root i][root j]=value 22 end
23 end
24 groups=spectralclustering(root tags af f inities) ∗ ∗ 25 /*combine tree process*/
26 newtrees=[0,{}]
27 foreach group root taglist in groups do 28 subtrees=[0,{}]
29 foreach root tag in group root taglist do
30 subtrees[0]+=trees[1][root tag][0]
31 subtrees[1][root tag]=trees[1][root tag] 32 end
33 newtrees[1][groupid]=subtrees
34 end
35 /*compute topic-tag distribution*/
36 all distributions=[]
37 foreach groupid in newtrees[1].keyset() do 38 distribtuion={}
39 total=trees[1][groupid][0]
40 compute(groupid,total,trees[1][tag],distribtuion)
41 all distributions.append(distribtuion)
42 end
43 /*sub function to compute topic-tag distribution*/
44 Function compute(tag,total,tree,distrib) 45 if tree[1]!=null then
46 foreach tag,sub tree in tree[1].items() do 47 compute(tag,total,sub tree,distrib) 48 end 49 end 50 if distrib.contain(tag) then 51 distrib[tag]+=tree[0]/float(total) 52 end 53 distrib[tag]=tree[0]/float(total) 54
Table 2: Original and enriched tag lists original tag list enriched tag list
ant java, ant qt, boost c++, qt, boost django, hosting python, django, hosting xslt, dynamic, xsl xml, xslt, dynamic, xsl sql-server-2005, sorting sql, sql-server-2005, sorting tomcat, grails, connection java, tomcat, grails, connection
cocoa, osx, mac, plugins objective-c, cocoa, osx, mac, plugins spring, j2ee, module, count java, spring, j2ee, module, count
Fig. 2: html’s tag tree, where html is located in the center
it requires the number of topics, we choose the same number 30 as [5], which has proved to be a reasonable setting for the Stackoverflow dataset. We then combine trees if their root nodes belong to the same topic (line 25-34). It leads to a result where each tree represents a topic. Therefore, in the compute topic-tag distribution process (line 35-42), for each topic tree, we recursively compute each tag’s probabil-ity to belong to this topic by Equation 4.
p sub i = I(sub i)
I(p) ∗ p (4)
where p and I(p) denote the probability and the occurrence of a parent tag, p sub i and I(sub i) denote the probability and the occurrence of the i th child tag, then we can compute the probability of p sub i.
Fig. 3: java’s tag tree, where java is located in the center
Table 3 compares some results of this process with the state-of-the-art topic model LDA. We used the same topic number 30 for LDA. We can find that both results are very relevant to topics. However, our model does not require many iterations to converge, which makes it more efficient. We also need to point out that we use the spectral clustering algorithm in a step of our method. We used the implementation of this algorithm from scikit-learn toolkit2. But we only run it on the root node, which have quite a small size (around 1175 nodes with the tag enrichment process), which means we only need to build affinity matrix on these root nodes and the overall cost is acceptable.
3.4 User Interest Detection
In StackOverflow, users answering a question can be considered as interested in the tags of the question. As a result, a starting point for user interest detection is to model the initial situation as follows: a user answering a question acquires the tags attached to this question and gradually, each user acquires a list of tags. So we use a tag list to represent a user: U = {Ui|i = 1, ..., n}, Ui = {tagi|i = m, n, ..., k}. Then our
2 Scikit-learn toolkit:
http://scikit-learn.org/stable/modules/clustering.html# spectral-clustering
Table 3: Top tags and their probabilities for topics iphone, sql and linux computed by our method and LDA method
our method LDA (iphone, 0.300), (objective-c, 0.147), (iphone-sdk, 0.088), (cocoa-touch, 0.087), (cocoa, 0.073), (xcode, 0.029), (uikit, 0.012), (uitableview, 0.011), (osx, 0.010) (cocoa, 0.182), (objective-c, 0.173), (iphone, 0.0795), (cocoa-touch, 0.048), (iphone-sdk, 0.034), (mac, 0.028), (osx, 0.027), (xcode, 0.018), (memory-management, 0.013) (sql, 0.185), (sql-server, 0.157), (mysql, 0.078), (database, 0.069), (sql-server-2005, 0.046), (tsql, 0.032), (oracle, 0.018), (query, 0.017), (stored-procedures, 0.015) (sql-server, 0.216), (sql, 0.198), (sql-server-2005, 0.061), (tsql, 0.055), (database, 0.052), (stored-procedures, 0.024), (database-design, 0.020), (performance, 0.016), (c#, 0.016) (linux, 0.292), (bash, 0.088), (unix, 0.070), (shell, 0.048), (scripting, 0.023), (command-line, 0.019), (ubuntu, 0.016), (belongs-on-serverfault, 0.013), (shell-script, 0.012) (linux, 0.074), (c, 0.058), (bash, 0.049), (unix, 0.042), (perl, 0.032), (shell, 0.030), (vim, 0.027), (regex, 0.024), (c++, 0.016)
goal is, for each Ui, to find Ii = {Ii1, Ii2...Iik} where Iikdenotes the probability of
user Uito be related to topick. As we already have a topic-tag distribution we simply
compute user-topic distribution by the equation 5 where Pt,kdenotes the probability
of tag t to be related to topic k. We then normalize the probabilities between 0 and 1 by dividing the global max value. We use log function for numerical stability. Here we don not like apply normalization at the level of the user, because like [26], we believe that each user could have a high interest in two or more topics simultaneously. But most of the probabilistic graphical model including LDA, PLSA require the sum of all the probabilities is 1, which means that a user cannot have high probabilities to many topics simultaneously. Our method does not have this limitation. Then we identify users’ communities of interests based on the user-topic distribution: Users who have high probabilities for a topic should be a member of the community of the topic. Ii,k= log (v X t=1 Pt,k+ 1 ) (5)
3.5 User Expertise Detection
Users who are interested in the question may provide answers to the question or comments to other answers. And the answer could be chosen as best answer, and each answer may also get votes from other users. As tags attached to a question can reflect its topic, answers which have high votes or is chosen as best answer can be considered as expertise by this topic. So if Uigive answer Amto Qmwhich has tagt,
then AmQmget votes Amv and Qmv. As we already have topic-tag distribution (see
section 3.3), we simply use the vote information to compute user expertise with the Equation 6 where Pt,kdenotes the probability of tag t related to topic k, Qmdenotes
the question m which user i answered. As we described before, the sigmoid function is (1+e1−k∗z), which is used as a squashing function for numerical stability. If a vote
is higher than a threshold, which can be determined by parameter k, the value of the function is approximate to 1. Therefore, the value of the multiply will not be too large for certain answer.
Ei,k= m
X
a=1
Pt,k∗ sigmoid(Q votes) ∗ sigmoid(A votes) (6)
4 Experiments and Evaluation on StackOverflow data
We conducted experiments on a dataset from the popular Q&A site StackOverflow to evaluate the performance of our approach compared to three other community detection algorithms.
4.1 Dataset and Protocol
Some basic statistics of our dataset are given in Table 4. The total number of users is 103K. Among them, 47K users submitted at least one question, and 54K users answered at least one question. The total number of tags attached to questions is 24K, and 20% of them are used more than 10 times. The frequency of tags follows a power law distribution. The total number of posts is 1.1M; among which there are 242K questioners and 870K answers. Traditional community detection algorithms
Table 4: Basic statistics of the stackoverflow dataset item description
total users 103K (47K questioner, 54K answerer) total tags 24K (20% used more than 10 times) total posts 1.1M (question 242K, answer 870K) co answer 10 902 users, 6746 co answer link co answer 15 401 users, 2326 co answer link co answer 20 241 users, 1064 co answer link co answer 25 153 users, 592 co answer link
labeled user 902 users, 1∼3 labels per user
are based on network structure. As there is no explicit network in our dataset and in order to compare our work with other approaches on the same dataset, we have extracted a network of interactions between users: we extracted a co-answer network inspired by the notion of co-view network introduced in [9]. The idea behind it is that if two users answer the same questions they have at least one common interest on this question. Therefore, they share some of their interests. So, this co-answer network, to some extent, can reflect the co-interests of users. Then we filtered the co-answer links with a rule stating that a link is kept if two users answer the same questions more than 10, 15, 20 or 25 times. As a result, we obtained four noise-less datasets.
4.2 Performance of the proposed Topic Extraction Method
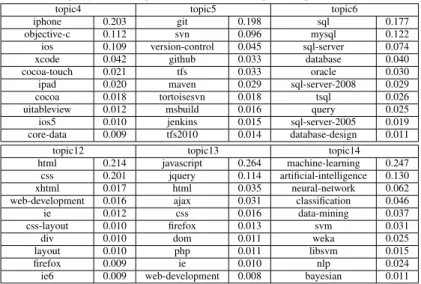
Table 5 shows the top tags and their probabilities detected by out method. We use the Perplexity [4] metric to measure the topic extraction performance. It is a common metric in the topic modeling area, measuring how well the words in test documents are represented by the word distribution of extracted topics. The intuition is that a better model will tend to assign higher probabilities to the test dataset, corresponding to a lower perplexity value. We split the dataset (question tag lists), 80% as training set, 20% as testing set. We run LDA and our method on the training set to get the topic distribution. Then for a test set of M question tag lists, the Perplexity score is computed as shown in equation 7:
P erplexity(Dtest) = exp
( − PM d=1log p(tag) PM d=1Nd ) (7)
In our model, p(tag) is computed by p(topic|question) ∗ p(tag|topic). In order
Fig. 4: Topic extraction performance comparison
to obtain p(topic|question) distribution, we just compute it similarly to user inter-est detection (see Section 3.4), by replacing user tag lists by quinter-estion tag lists. The only difference is that we normalize the question topic distribution to make sure that the sum of a question’s topic distribution is 1. We show and compare the average perplexity score in Figure 4. empirical represents our method, empirical noEnrich represents our method without first-tag enrichment. We find that our method could outperform the state-of-the-art topic model LDA. The reason is, compared with tra-ditional document topic modeling use cases, question tag lists in Q&A sites are very short, therefore, LDA perform poorly in this situation. Besides, our first-tag enrich-ment method can improve the performance when the topic number is not very large.
Another point is that, benefiting from a tree structure for topics, we could easily ex-tract sub-topic from a given topic. Besides, our community detection method is based on a topic model, so extracting these sub-topics can help us find sub-communities within a detected community. Table 6 shows the top tags of java’s sub-topic html and of topic html. We can find that the differences are noticeable for topics: a user who is interested in topic html is not necessarily interested in java’s sub-topic html and vice versa.
Table 5: Top tags and their probabilities for some topics computed by our method
topic4 topic5 topic6
iphone 0.203 git 0.198 sql 0.177 objective-c 0.112 svn 0.096 mysql 0.122 ios 0.109 version-control 0.045 sql-server 0.074 xcode 0.042 github 0.033 database 0.040 cocoa-touch 0.021 tfs 0.033 oracle 0.030 ipad 0.020 maven 0.029 sql-server-2008 0.029 cocoa 0.018 tortoisesvn 0.018 tsql 0.026 uitableview 0.012 msbuild 0.016 query 0.025 ios5 0.010 jenkins 0.015 sql-server-2005 0.019 core-data 0.009 tfs2010 0.014 database-design 0.011
topic12 topic13 topic14 html 0.214 javascript 0.264 machine-learning 0.247
css 0.201 jquery 0.114 artificial-intelligence 0.130 xhtml 0.017 html 0.035 neural-network 0.062 web-development 0.016 ajax 0.031 classification 0.046 ie 0.012 css 0.016 data-mining 0.037 css-layout 0.010 firefox 0.013 svm 0.031 div 0.010 dom 0.011 weka 0.025 layout 0.010 php 0.011 libsvm 0.015 firefox 0.009 ie 0.010 nlp 0.024 ie6 0.009 web-development 0.008 bayesian 0.011
Table 6: top tags for java’s sub-topic html and mysql, denoted by java html, and java mysql respectively, compared with topics html and mysql
java html jsp swing xml parsing jsf jeditorpane pdf applet dom html css xhtml web-development table div ie layout css-layout firefox
java mysql jdbc hibernate database tomcat prepared-statement spring connection-pooling connection security mysql database query mysql-query ruby-on-rails database-design performance stored-procedures innodb
optimization
4.3 Genericity of the proposed Topic Extraction Method
In order to test that whether our proposed topic extraction methods is generic, we collected a dataset from flickr3 which contains 1211499 photos attached with tags.
For instance, a photo tagged with {china pinyao} indicates the location information.
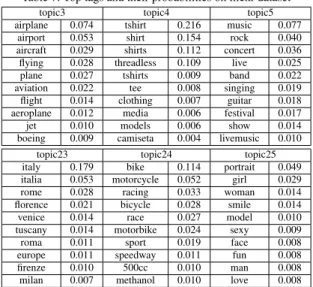
A photo tagged with {night people bar} describes the time and content information. We run our topic extraction method on this dataset, and we list some results in Table 7. We can find that the detected topics are interesting. For example, topic 3 includes photos which contains airplanes, topic 24 includes photos which contains bicycles, and topic 23 includes photos taken in cities of Italy.
Table 7: Top tags and their probabilities on flickr dataset
topic3 topic4 topic5 airplane 0.074 tshirt 0.216 music 0.077
airport 0.053 shirt 0.154 rock 0.040 aircraft 0.029 shirts 0.112 concert 0.036 flying 0.028 threadless 0.109 live 0.025 plane 0.027 tshirts 0.009 band 0.022 aviation 0.022 tee 0.008 singing 0.019 flight 0.014 clothing 0.007 guitar 0.018 aeroplane 0.012 media 0.006 festival 0.017 jet 0.010 models 0.006 show 0.014 boeing 0.009 camiseta 0.004 livemusic 0.010
topic23 topic24 topic25 italy 0.179 bike 0.114 portrait 0.049 italia 0.053 motorcycle 0.052 girl 0.029 rome 0.028 racing 0.033 woman 0.014 florence 0.021 bicycle 0.028 smile 0.014 venice 0.014 race 0.027 model 0.010 tuscany 0.014 motorbike 0.024 sexy 0.009 roma 0.011 sport 0.019 face 0.008 europe 0.011 speedway 0.011 fun 0.008 firenze 0.010 500cc 0.010 man 0.008 milan 0.007 methanol 0.010 love 0.008
4.4 Comparative evaluation of Different Community Detection Approaches 4.4.1 Experimentation of the Graph based Approach
Let G = {N, E}, N = {Ui|i = 1, ..., n}, E = Ai,j ∈ {0, 1}N ×N be a network
where N denotes the set of users, E the set of edges between users answering the same questions. Graph-based community detection algorithms aim to find out overlapping interest groups g = {gi|i = 1, ..., k}, gi = {Ui|i = l, m, ..n}. We implemented
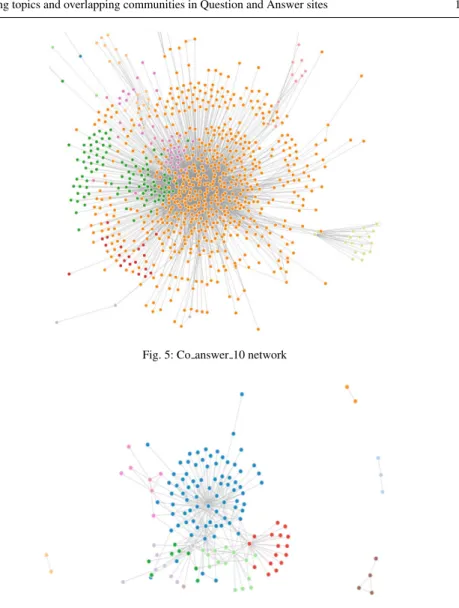
the SLPA algorithm proposed in [24]’s work. Figures 5 and 6 show the results we obtained on co answer 10 and co answer 25 networks, each color representing a de-tected community.
The co answer 10 network is hard-core or octopus shaped. We can see that com-pared with normal social graph, there are few triangle-shape structures, so the graph-based algorithm fails to find a good partitioning over this network. We run the SLPA algorithm many times, most of the time there are only one or two huge partitions detected which group 80% users of the network while the remaining partitions are extremely small (each one containing about 2∼5%users).
The co answer 25 network is more like a flat graph, we can view some triangle-shapestructures in the graph. As Figure 6 shows it, the SLPA algorithm works fine on
Fig. 5: Co answer 10 network
Fig. 6: Co answer 25 network
this network. In order to better understand these communities, we randomly selected four users in each of three detected communities (in blue, red and purple in Figure 6 ) and we present their associated tags in Table 8.
As we introduced it in Section 2, most of the graph-based community detection methods do not take into account user attributes. In this scenario, although the co-answer network, to some extent, can reflect common interests between users, it still does not represent the different interests captured in the same link. In other words, two users are linked because they co-answer the same questions many times (according to a filter threshold, here 25). However, they may co-answer java-related question 5 times and c#-related question 20 times, and this information is not represented by their link. As a result, as it appears in Table 8 some groups do reflect some common
Table 8: Illustration results of graph-based approach
group 1 (blue color)
Id 16883 java(364), subjective(45), best-practices(41), php(36), c#(29) Id 15459 java(118), javascript(70), subjective(59), php(43), regex(41) Id 8155 c#(264), linq(228), sql(148), .net(104), linq-to-sql(91) Id 16076 c#(290), sql-server(200), .net(169), sql(138), sql-server-2005(78)
group 2 (red color)
Id 64960 c++(108), c(18), stl(16), multithreading(14), windows(14) Id 54684 c++(128), vim(48), best-practices(27), java(12), c(10) Id 3146 c++(233), c(76), windows(71), c#(60), .net(37) Id 3153 c++(216), c(76), win32(43), windows(37), subjective(33)
group 3 (purple color)
Id 10661 python(944), django(201), subjective(134), best-practices(106), database(82) Id 57757 python(130), subjective(27), c(21), c#(20), c++(18)
Id 9493 python(194), regex(9), string(8), beginner(8), list(5)
Id 15401 sql-server(108), database(64), sql(63), subjective(45), python(43)
interest while some others do not. For example, users in group 1 do not share the same interests while users in group 2 have more similar interests.
4.4.2 Experimentation of the Clustering Approach
We first formalized the vector representation of each user. Again, we used a tag list to represent each user: N = {Ui|i = 1, ..., n}, Ui = {F reqtagi|i = 1, ..., k}. We
then used an implementation of a hierarchical clustering algorithm from scikit-learn toolkit4, introduced in [7]’s work, to detect groups on co answer 10 dataset. We set group number as 30, which is the same as other compared model. We randomly listed (at most) 5 users from 6 groups out of 30 groups in Table 9, (Group 2 only has 2 users). The first column contains user ids and the five other columns the top five tags in each user tag list. This table shows that users with similar frequent tags are grouped together. The results are very reasonable. However, in group 1, ’user 82187’ is inter-ested in c#-dev and database topics, ’user 38206’ is interinter-ested in c#-dev and java-dev topics, and ’user 234’ is interested in ’c#-dev’ and web-dev tags. Therefore, the in-terest of group 1 is not very focused. Moreover, clustering-based algorithms normally output hard-partitioned communities, one user can only be assigned to one interest group. However, in the scenario we are interested in, a user often has more than one interest and should be assigned to more than one group simultaneously. This is a big constraint for those hard-partition algorithms. In addition, clustering-based algo-rithms need the definition of a distance between instances. To find similar interests, we first have to define the distance between user’s interests and the definition of this distance will directly influence the clustering results. For instance, we can consider a bag of tags with their weights to represent an interest, then compute the weighted tag distance to define the interest distance between two users.
4 Scikit-learn toolkit:
http://scikit-learn.org/stable/modules/clustering.html# hierarchical-clustering
Table 9: Illustration results of clustering approach group 1 Id 48082 c#(145),.net(137),wcf(50),zip(39),asp.net(36), Id 38206 c#(206),.net(146),subjective(56),best-practices(31),java(30), Id 1196 c#(169),.net(142),subjective(42),best-practices(37),wpf(30), Id 234 ruby(102),c#(91),.net(72),ruby-on-rails(69),subjective(61), Id 82187 c#(189),.net(76),sql-server(40),sql(36),windows-forms(33), group 2 Id 16036 sql(288),sql-server(137),tsql(43),sql-server-2005(41),database(30), Id 60308 sql-server(213),sql(84),sql-server-2005(50),tsql(28),database(18), Id 18255 sql(296),sql-server(280),sql-server-2005(74),database(73),tsql(71), Id 740 sql-server(273),sql(184),sql-server-2005(76),tsql(74),database(39), Id 27535 sql-server(430),sql(197),sql-server-2005(158),tsql(90),sql-server-2008(38), group 3 Id 33213 c++(366),c#(88),c(73),subjective(67),.net(40), Id 15416 c++(355),c(70),windows(67),win32(42),c#(34), Id 12711 c++(341),c(146),c#(63),.net(49),windows(44), Id 66692 c++(376),c(141),flex(80),actionscript-3(61),flash(39), Id 14065 c++(459),stl(42),c(40),exception(31),subjective(25), group 4 Id 3474 java(381),security(44),encryption(41),ssl(27),best-practices(25), Id 57695 java(476),multithreading(29),performance(26),c#(17),jvm(14), Id 12960 java(428),xml(42),c#(26),best-practices(18),vim(16), Id 13531 java(394),swing(60),regex(22),generics(22),collections(20), Id 53897 java(366),eclipse(24),tomcat(20),performance(18),subjective(18), group 5 Id 18275 sql(54),sql-server(39),subjective(27),tsql(19),mysql(18), Id 383 c#(50),asp.net(40),sql-server(37),sql(28),language-agnostic(24), Id 3241 sql-server(90),sql(69),sql-server-2005(21),tsql(21),stored-procedures(13), Id 65070 iphone(37),sql(37),c#(36),java(35),php(35), Id 19937 sql(88),database-design(86),database(44),sql-server(23),subjective(16), group 6 Id 76583 jquery(69),javascript(63),php(61),css(29),html(28), Id 18936 javascript(208),html(114),python(102),css(65),php(63), Id 6144 javascript(117),html(64),css(52),web-development(30),internet-explorer(29), Id 61027 javascript(117),subjective(66),iphone(43),jquery(38),best-practices(19), Id 811 javascript(124),jquery(59),c++(40),c#(36),subjective(36),
4.4.3 Experimentation of the LDA-based Model
We run LDA to build a user-topic-tag model on the co answer 10 dataset, each user being represented by her tag list like in the above experiment. We set the parameters α, β, K to, respectively, 50/K, 0.1, and 30 as adopted in many related work. α is the prior distribuion for user-topic distribuion. and β is the prior distribuion for topic-tag distribuion. For the group number K, we chose the same setting as the clustering algorithm. One of the model’s result is the probability for each user to belong to each interest group. This is shown in Table 10.
Table 10 shows six randomly chosen users and their top 10 tags. The first row contains user ids, the second row contains their detected interest groups with their probability. The following ten rows show the top 10 tags for each user. We replaced group ids with names assigned according to tags in each group.
Table 10: Illustration results of LDA-based approach
user 10224 user 103043 user 113570 database(0.764), c-dev(0.039) java-dev(0.603), database(0.157), web-dev(0.395), c#-dev(0.287)
sql-server(21) java(135) c#(107) sql(21) swing(28) jquery(89) tsql(6) oracle(27) javascript(56) performance(4) sql(23) .net(47)
database(4) subjective(15) asp.net(27) stored-procedures(3) windows(13) css(23)
sql-server-2005(3) eclipse(12) regex(20) .net(3) best-practices(12) html(20) mysql(2) regex(10) iphone(12) sql-server-2000(2) plsql(10) string(10)
user 24181 user 34509 user 30461 web-dev(0.863), database(0.035), c-dev(0.767), linux-dev(0.128), ios-dev(0.947), other-topic(0.011)
php(304) c++(703) cocoa(333) javascript(193) c(187) objective-c(184)
mysql(116) templates(62) iphone(47) html(86) stl(53) cocoa-touch(39)
css(57) linux(48) osx(35)
regex(40) subjective(45) mac(34) jquery(37) pointers(44) iphone-sdk(20)
sql(27) java(42) xcode(18)
ajax(26) bash(40) cocoa-bindings(18) apache(23) boost(31) core-graphics(18)
4.4.4 Experimentation of Our Empirical Model
We run our approach on the co answer 10 dataset, For the topic number K, we chose the same setting 30 as the above algorithms. Table 11 shows some users and their top 10 tags. The first row contains user ids, the second row contains their detected communities of interests with their probabilities. The following ten rows show the top 10 tags for each user. We replaced community labels by names assigned according to the tags in each topic interest.
4.4.5 User Study of User Interest Detection
We now want to evaluate whether a user is correctly assigned to the right interest group, and to which extent the user belongs to the interest group. To achieve this, we invited volunteers to manually label 902 users (co answer 10 dataset) as the ground-truth and assigned each user with eight group labels, chosen from c-development group, java-development group, c#-development group, web-development group, ios-developmentgroup, database group, linux-development group and other-topic group. For example, user A sequentially has three group labels, which are java-development, web-development,ios-development. It means that user A has a big interest in the group java-development, a medium interest in the group web-development, a lower interest in the group ios-development. Since each user has an ordered label list, we have to evaluate both the correctness of detected groups and the correctness of the order.
We ask another volunteer (who was not involved in labeling the ground-truth) to label the results of the methods with the same 8 labels. As SLPA algorithm can detect overlapping communities. She was asked to assign an interest group name, from the 8 labels, to each community according to users tag lists in each community, then each
Table 11: Illustration results of our empirical approach
user 10224 user 103043 user 113570 database(0.531) c#-dev(0.095) java-dev(0.699)database(0.232) c#-dev(0.898) web-dev(0.512)
sql-server(21) java(135) c#(107) sql(21) swing(28) jquery(89) tsql(6) oracle(27) javascript(56) performance(4) sql(23) .net(47)
database(4) subjective(15) asp.net(27) stored-procedures(3) windows(13) css(23)
sql-server-2005(3) eclipse(12) regex(20) .net(3) best-practices(12) html(20) mysql(2) plsql(10) iphone(12) sql-server-2000(2) regex(10) string(10)
user 24181 user 34509 user 30461 web-dev(0.631), database(0.616) c-dev(0.773), linux-dev(0.417) ios-dev(0.885), linux-dev(0.218)
php(304) c++(703) cocoa(333) javascript(193) c(187) objective-c(184)
mysql(116) templates(62) iphone(47) html(86) stl(53) cocoa-touch(39)
css(57) linux(48) osx(35)
regex(40) subjective(45) mac(34) jquery(37) pointers(44) iphone-sdk(20)
sql(27) java(42) xcode(18) ajax(26) bash(40) cocoa-bindings(18) apache(23) boost(31) core-graphics(18)
user gets at least one interest group name. Besides, SLPA algorithm can evaluate to which extent a user belongs to a community by the frequency (a ’Post-process’ in SLPA algorithm). Combined with the interest group name we assigned for each community, SLPA algorithm now can output an ordered interest group name list for each user. Clustering algorithm can only generate one cluster id for each user, so she was asked to assign an interest group name, from the 8 labels, for each cluster. LDA method can give the probability membership to each topic. Large probability can indicate that a user is more interested in that group. She only needed to associate the detected 30 topics with 8 group labels. Then we can get a ordered interest group name list for each user after sorted by the probabilities. Same as LDA, our approach can also give the probability membership to each topic, so she only needed to associate the detected 30 topics with 8 group labels. Then we can get a ordered interest group name list for each user after sorting by the probability. Here, we only choose the top 3 group name for each user. Discounted cumulative gain (DCG) is used to measure the quality, or gain of result based on its position in result list. The gain is accumulated from the top of the result list to the bottom with the gain of each result discounted at lower ranked position. The DCG measurement penalizes high score results appearing lower in a ranked list of results. Given scores for each items in a ranked list, reli
representing the score of result at position i, DCG at rank position p(DCG@p) is computed as: DCG@p = rel1+ p X i=2 reli log2(i) (8)
The Normalized DCG (NDCG) is introduced to compare different ranking list. It is done by sorting scores of a ranking list result to get the maximum DCG till position
P, also called Ideal DCG (IDCG). The NDCG at rank position p is computed as:
N DCG@p = DCG@p
IDCG@p (9)
The value of NDCG is between 0.0 and 1.0. In our scenario, a NDCG@p value of 1.0 means detected interests and their order are totally the same as the ground-truth till position p, while a NDCG@p value of 0.0 means that the detected interests are completely different from the ground-truth. For values between 0.0 to 1.0, it means that the detected interests are partially correct or ordered incorrectly.
Here, we evalute NDCG@1, NDCG@2, and NDCG@3. The ideal ranking list of each user is the ground-truth and corresponding score is 10, 8 and 6. Figure 7 show the result of NDCG performance for each method. NDCG@1 reflects the prominent
Fig. 7: NDCG results comparaison
interest detected by each algorithm compared with the ground-truth of user’s promi-nent interest. We noticed that our Empirical method is partially better than LDA, and outperforms SLPA and hierarchical clustering. We also mention that with the dataset becoming less noisy (people have prominent and clear-intention interests), all meth-ods’ performance increase. The same phenomenon is also observed in NDCG@2, 3. As hierarchical clustering algorithms give a hard partition there are no performance comparison for hierarchical clustering algorithm in NDCG@2, 3.
4.4.6 Performance of User Interest Detection
We want to evaluate the similarity between users within a detected community of interest. We compare our method with three other methods chosen from different kinds of community detection methods. In order to evaluate the results of overlapping community detection, for each user, a method should output 1 ∼ 3 community labels with corresponding probabilities to indicate to what extent the user is interest in the community. Then we define three levels of interests: High, Medium, Low according to the probabilities. In addition, we set the community number as 30 for all these methods empirically.
– SLPA [24]: An overlapping community detection method inspired by a classical Label propagation algorithm (LPA). SLPA algorithm can evaluate to which extent a user belongs to a community by the received propagated label (a ’Post-process’ in SLPA algorithm). So, it can output more than one community label according to these frequencies.
– LDA: Similar to [27], we run LDA to build a user-topic-tag model on the given dataset, users are represented by their tag list. As the output contains a user-topic distribution, we just sort the distribution for each user and chose the top 3 topic labels as community label together with their probabilities.
– Clustering: We used the implementation of hierarchical clustering from scikit-learn toolkit5. As clustering algorithm are hard-partition, it can only generate one
group label for each user.
– Empirical: it is our method. We just sort the results of user interest detection (sec-tion 3.4) and chose the top 3 as community label together with their probabilities. Our aim was to evaluate the similarity between users within a detected community of interest. We mainly used the jaccard similarity and cosine similarity of two user’s tag lists to evaluate the similarity of two user’s interests. We used a modified mod-ularity metric to compute the difference between the average similarity between the users within a community (avg inner) and the average similarity between the users in a community and some user randomly chosen from the whole dataset (avg rand). It is described in Equation 10, where N represents the number of users in a com-munity C, and Simi denotes the similarity function. Rand U represents users that are randomly chosen from the whole data set. A higher value of avg inner denotes that users within a community are very similar. A lower value of avg rand denotes that users of a community are not very similar to random users. So A higher value of modularity means a larger difference between avg inner and avg rand, which is considered as a better partition of communities. As the metric has random vari-ables, we run the experiments 10 times and we used different random users at each time. Besides, we created a center user in each community by averaging all users’ tag lists and frequencies, then we computed the average similarity between each user in a community and this center user as avg center. As introduced before, each method gives 1 ∼ 3 community labels for each user to indicate the level of interest. So we
5 http://scikit-learn.org/stable/modules/clustering.html#
evaluated each level of interest respectively. M odularity(C) = Avg( PN i=1 PN j=1Simi(U i, U j)) Avg(PN i=1 P50 j=1Simi(U i, RandU j)) (10)
Experiment results are shown in Table 12. We run each method on the co-answer dataset for 10 times, and listed the average value. We found that our method is better than the three other methods in detecting High level communities of interests with both metrics. The reason why our method is not very good on Low level interest is that it allows users to belong to more than one community with high probabilities. This puts some irrelevant users in Low level communities of interests which decreases the similarity between users.
Table 12: Performance of User Interest Detection
Similarity Jaccard Similarity Cosine Similarity Level High Interest High Interest
Metric avg inner avg rand modularity avg center avg inner avg rand modularity avg center Empirical 0.162 0.033 4.909 0.218 0.736 0.574 1.282 0.857
LDA 0.147 0.035 4.200 0.178 0.836 0.660 1.267 0.917 SLPA 0.131 0.040 3.275 0.166 0.749 0.624 1.200 0.854 Clustering 0.130 0.041 3.171 0.161 0.763 0.622 1.226 0.875
Level Medium Interest Medium Interest
Empirical 0.135 0.039 3.462 0.171 0.573 0.602 0.952 0.761 LDA 0.131 0.039 3.359 0.177 0.900 0.612 1.471 0.948 SLPA 0.129 0.040 3.225 0.159 0.590 0.621 0.950 0.687 Clustering 0.000 0.000 0.000 0.000 0.000 0.000 0.000 0.000
Level Low Interest Low Interest
Empirical 0.107 0.042 2.548 0.131 0.475 0.629 0.755 0.695 LDA 0.144 0.041 3.512 0.193 0.757 0.600 1.262 0.865 SLPA 0.121 0.039 3.103 0.155 0.702 0.625 1.123 0.844 Clustering 0.000 0.000 0.000 0.000 0.000 0.000 0.000 0.000
4.5 Scalability
We also evaluated the scalability of each method. However, as these methods are written in different programming languages, it is not fair to consider this as a precise evaluation, but more as an indication. To increase the stability of the comparison, we run experiments 10 times, and only listed the average values. We used a Java imple-mentation of LDA algorithm. All the other methods were implemented in Python. For our method, the time of topic detection was also counted in. For LDA and SLPA, we set the iteration number at 100. We run the experiments on a computer with 3GHz Intel i7 CPU and 8GB RAM. From the experiment, we could find that LDA, SLPA and our method are linear in terms of the number of users. Although LDA algorithm is theoretically O(nm) in each iteration, with n representing the number of users, and m representing the number of tags for each user, when we test it on large datasets, it clearly appears that only n actually has an impact. m changes very little, so it could be regarded as linear. Besides, [13] proved that LDA model require a few hundreds of iterations to obtain stable topic distribution. Our model does not have this limitation.
Fig. 8: Scalability of the compared user interest detection methods
4.6 Discussion
To sum up, most community detection algorithms work well on real-life social net-works which contain many triangle-shape structures. The interactions between the users in these networks are mainly based on their relationships. It is also noticeable that the relationships which a user in such network can maintain are limited and most likely restricted by the location (co-author networks in academia is also in this situation), so the overall structure of the network is flatter, scattered and with many triangle-shapestructures. Comparatively, in Q&A sites, such as StackOverflow, there are no fixed relationships between users. Users interact with each other based on their own interests. And they are not aware of whom they are interacting with, so they will not maintain explicit relationships. Besides, a user can interact with any other user and mainly interacts with the ”gurus” (most of questions are answered by a small group of people). So the overall structure of the network is octopus-shape [15] with less triangle-shape structures. According to [22], the number of triangle-shape struc-tures per user in twitter dataset is 821, while in our co-answer dataset, the number of triangle-shapestructure per user is 30 which is far less. So, graph-based community detection methods fail in such situation. The result of SLPA algorithm shows that it outputs one or two giant groups, together with many tiny groups that only contain small number of users as depicted in Figure 5, where each color represents a detected community. We can also see that the network contains less triangle-shape structures and a high-density core. It also indicates that the network has huge overlaps. Since clustering methods normally generate hard-partitions algorithm, they cannot detect the overlapping communities which are typical in our case. Concerning the LDA-based methods, on one hand, in our dataset, question tag lists are quite short, and the experiment shows that our topic extraction method gives better results in this situation. On the other hand, the probabilistic graphical model requires hundreds of iterations to get stable results [13] which is more complicated and slower than our
method. Recalling our research questions (Can we detect communities of interests in Q&A sites? Can we also identify the topics that attract them?) we believe we propose a topic detection method which is very suitable for Q&A datasets and an efficient user interest detection method to discover overlapping communities of interests.
5 Conclusion
In this paper, we addressed the problem of detecting overlapping communities of interests in Q&A sites. By studying the Stackoverflow dataset and the LDA algorithm, we proposed a tag tree based topic extraction model. We then exploited the extracted topic information to detect overlapping communities of interests. We conducted a comparative evaluation of different approaches of community detection on a dataset from the popular Q&A site StackOverflow. The results indicate that for this kind of web communities our method can be a good replacement for more complicated methods in detecting overlapping communities of interests. There are also limitations in our work and in particular our model requires each question to have several tags to the question. There are many potential future directions for this work. An interesting one is to track the evolution of communities of interests and the evolution of users’ interests.
Acknowledgment
The authors would like to thank StackOverflow for sharing their data. We also sin-cerely thank volunteers for helping us label the dataset for evaluation. We thank the ANR ocktopus project grant for the support of this research. We also appreciate very helpful advices from anonymous reviewers.
References
1. Adamic, L.A., Huberman, B.A.: Power-law distribution of the world wide web. Science 287(5461), 2115–2115 (2000)
2. Ahn, Y.Y., Bagrow, J.P., Lehmann, S.: Link communities reveal multiscale complexity in networks. Nature 466(7307), 761–764 (2010)
3. Anderson, A., Huttenlocher, D.P., Kleinberg, J.M., Leskovec, J.: Discovering value from community activity on focused question answering sites: a case study of stack overflow. In: KDD, pp. 850–858 (2012)
4. Blei, D.M., Ng, A.Y., Jordan, M.I.: Latent dirichlet allocation. the Journal of machine Learning research 3, 993–1022 (2003)
5. Chang, S., Pal, A.: Routing questions for collaborative answering in community question answering. In: Proceedings of the 2013 IEEE/ACM International Conference on Advances in Social Networks Analysis and Mining, ASONAM ’13, pp. 494–501. ACM, New York, NY, USA (2013)
6. Duan, L., Street, W.N., Liu, Y., Lu, H.: Community detection in graphs through correlation. In: Proceedings of the 20th ACM SIGKDD international conference on Knowledge discovery and data mining, pp. 1376–1385. ACM (2014)
7. Fortunato, S.: Community detection in graphs. CoRR abs/0906.0612 (2009)
8. Gargi, U., Lu, W., Mirrokni, V.S., Yoon, S.: Large-scale community detection on youtube for topic discovery and exploration. In: ICWSM (2011)
9. Gargi, U., Lu, W., Mirrokni, V.S., Yoon, S.: Large-scale community detection on youtube for topic discovery and exploration. (2011)
10. Gopalan, P.K., Blei, D.M.: Efficient discovery of overlapping communities in massive networks. Pro-ceedings of the National Academy of Sciences 110(36), 14,534–14,539 (2013)
11. Gregory, S.: Finding overlapping communities in networks by label propagation. New Journal of Physics 12(10), 103,018 (2010)
12. Gregory, S.: Fuzzy overlapping communities in networks. Journal of Statistical Mechanics: Theory and Experiment 2011(02), P02,017 (2011)
13. Griffiths, T.L., Steyvers, M.: Finding scientific topics. Proceedings of the National academy of Sci-ences of the United States of America 101(Suppl 1), 5228–5235 (2004)
14. Lancichinetti, A., Radicchi, F., Ramasco, J.J., Fortunato, S.: Finding statistically significant commu-nities in networks. PloS one 6(4), e18,961 (2011)
15. Leskovec, J., Lang, K.J., Dasgupta, A., Mahoney, M.W.: Statistical properties of community structure in large social and information networks. In: Proceedings of the 17th international conference on World Wide Web, pp. 695–704. ACM (2008)
16. Li, B., King, I.: Routing questions to appropriate answerers in community question answering ser-vices. In: Proceedings of the 19th ACM international conference on Information and knowledge management, pp. 1585–1588. ACM (2010)
17. Li, D., He, B., Ding, Y., Tang, J., Sugimoto, C., Qin, Z., Yan, E., Li, J., Dong, T.: Community-based topic modeling for social tagging. In: Proc. of the 19th ACM International Conference on Information and Knowledge Management, CIKM ’10, pp. 1565–1568. ACM, New York, NY, USA (2010) 18. McDaid, A., Hurley, N.: Detecting highly overlapping communities with model-based overlapping
seed expansion. In: Advances in Social Networks Analysis and Mining (ASONAM), 2010 Interna-tional Conference on, pp. 112–119. IEEE (2010)
19. Mika, P.: Ontologies are us: A unified model of social networks and semantics. Web Semantics: Science, Services and Agents on the World Wide Web 5(1), 5–15 (2007)
20. Ng, A.Y., Jordan, M.I., Weiss, Y.: On spectral clustering: Analysis and an algorithm. In: ADVANCES IN NEURAL INFORMATION PROCESSING SYSTEMS, pp. 849–856. MIT Press (2001) 21. Sun, X., Lin, H.: Topical community detection from mining user tagging behavior and interest.
JA-SIST 64(2), 321–333 (2013)
22. Suri, S., Vassilvitskii, S.: Counting triangles and the curse of the last reducer. In: Proceedings of the 20th international conference on World wide web, pp. 607–614. ACM (2011)
23. Tang, J., Zhang, J., Yao, L., Li, J., Zhang, L., Su, Z.: Arnetminer: extraction and mining of academic social networks. In: Proceedings of the 14th ACM SIGKDD international conference on Knowledge discovery and data mining, pp. 990–998. ACM (2008)
24. Xie, J., Kelley, S., Szymanski, B.K.: Overlapping community detection in networks: The state-of-the-art and comparative study. ACM Comput. Surv. 45(4), 43 (2013)
25. Xu, Z., Ke, Y., Wang, Y., Cheng, H., Cheng, J.: A model-based approach to attributed graph clustering. In: SIGMOD Conference, pp. 505–516 (2012)
26. Yang, J., McAuley, J., Leskovec, J.: Community detection in networks with node attributes. In: Data Mining (ICDM), 2013 IEEE 13th International Conference on, pp. 1151–1156. IEEE (2013) 27. Yang, L., Qiu, M., Gottipati, S., Zhu, F., Jiang, J., Sun, H., Chen, Z.: Cqarank: jointly model topics
and expertise in community question answering. In: Proceedings of the 22nd ACM international conference on Conference on information & knowledge management, pp. 99–108. ACM (2013) 28. Zhang, H., Qiu, B., Giles, C.L., Foley, H.C., Yen, J.: An lda-based community structure discovery
approach for large-scale social networks. In: ISI, pp. 200–207 (2007)
29. Zhou, T.C., Lyu, M.R., King, I.: A classification-based approach to question routing in community question answering. In: Proceedings of the 21st International Conference Companion on World Wide Web, WWW ’12 Companion, pp. 783–790. ACM, New York, NY, USA (2012)


![Table 5 shows the top tags and their probabilities detected by out method. We use the Perplexity [4] metric to measure the topic extraction performance](https://thumb-eu.123doks.com/thumbv2/123doknet/13372328.403999/15.892.207.502.486.716/table-probabilities-detected-method-perplexity-measure-extraction-performance.webp)