HAL Id: hal-00477440
https://hal.archives-ouvertes.fr/hal-00477440
Submitted on 29 Apr 2010HAL is a multi-disciplinary open access archive for the deposit and dissemination of sci-entific research documents, whether they are pub-lished or not. The documents may come from teaching and research institutions in France or abroad, or from public or private research centers.
L’archive ouverte pluridisciplinaire HAL, est destinée au dépôt et à la diffusion de documents scientifiques de niveau recherche, publiés ou non, émanant des établissements d’enseignement et de recherche français ou étrangers, des laboratoires publics ou privés.
Raman studies of corrosion layers formed on
archaeological irons in various media
Ludovic Bellot-Gurlet, Delphine Neff, Solenn Reguer, Judith Monnier,
Mandana Saheb, Philippe Dillmann
To cite this version:
Ludovic Bellot-Gurlet, Delphine Neff, Solenn Reguer, Judith Monnier, Mandana Saheb, et al.. Ra-man studies of corrosion layers formed on archaeological irons in various media. Journal of Nano Research, Trans Tech Publications, 2009, 8, pp.147-156. �10.4028/www.scientific.net/JNanoR.8.147�. �hal-00477440�
Raman studies of corrosion layers formed
on archaeological irons in various media
Ludovic Bellot-Gurlet
1, a, Delphine Neff
2, b, Solenn Réguer
3, c,
Judith Monnier
4, d, Mandana Saheb
2, eand Philippe Dillmann
4,f1 Laboratoire de Dynamique, Interactions et Réactivité (LADIR) UMR7075 CNRS/Université Pierre et Marie-Curie Paris 6, 2 rue Henry Dunant, 94320 Thiais, France
2 Laboratoire Pierre Süe, UMR 9956 CEA/CNRS, CEA Saclay, 91191 Gif sur Yvette cedex, France
3 Division Expériences - DIFFABS, Synchrotron Soleil, L'Orme des Merisiers, Saint-Aubin - BP 48, 91192 Gif sur Yvette Cedex, France
4 UMR5060 IRAMAT LMC CNRS and Laboratoire Pierre Süe, CEA Saclay, 91191 Gif sur Yvette Cedex, France
a bellot-gurlet@glvt-cnrs.fr, b delphine.neff@cea.fr,
c solenn.reguer@synchrotron-soleil.fr,d judith.monnier@glvt-cnrs.fr, e mandana.saheb@cea.fr, f philippe.dillmann@cea.fr
Keywords: Raman spectroscopy, iron corrosion, ancient artefact, imaging.
Abstract. The description and identification of corrosion products formed on archaeological
iron artefacts need various approaches at different observation scales. Among analytical techniques available to document phase structure at the microscopic range, Raman spectroscopy offers sensitivity and discrimination between iron corrosion products with an easy implementation. Results obtained for iron artefacts corrosion in soils and atmosphere are presented. Corrosion forms observed for anoxic and aerated soils on one hand and indoor atmosphere on the other are documented. Beyond the identification and organisation of corrosion products through hyperspectral imaging, Raman micro-spectroscopy could also provide quantitative phase proportions which will be needed in the proposition of reactivity diagnosis indicators.
Introduction
Iron is widely present in cultural heritage objects and monuments. These artefacts are submitted to corrosion according to their conservation environments which are in most of cases soil or atmosphere. The preservation of these iron heritage artefacts needs the diagnostic of their corrosion state in order to improve restoration treatments and propose new strategies of conservation. For these purposes the knowledge of corrosion mechanisms over long-term is needed to evaluate system chemical/electrochemical stability and to prevent further degradations.
Formulation of hypotheses for long term mechanisms and their validation require the observation and characterisation of the thick corrosion products slowly formed with time on ancient artefacts [1]. Because of the heterogeneity of the corrosion layers with the presence of phases in tiny domains their studies require characterisation at the microscopic scale. Firstly the identification of iron corrosion products calls for their structural fingerprinting and secondly their organisation has to be described until a microscopic range. Among analytical methods able to finely discriminate structures and reach the microanalyses, Raman micro-spectroscopy is a versatile and efficient technique. Moreover its easy implementation, light sample preparation required, conduct to an increase of its use in ancient material science [2]. Journal of Nano Research (2009), Vol. 8, pp 147-156.
This paper sets out the recent Raman studies emanating from our teams on iron artefacts corrosion in soil and atmosphere. For buried artefacts the study of different archaeological sites will document the corrosion forms observed for anoxic and aerated soils. In addition different kinds of chlorinated phases involved in the potential post-excavation active corrosion phenomena were identified. For atmospheric corrosion we focus on indoor environment encountered in ancient buildings. Further than the identification and organisation of corrosion products, Raman micro-spectroscopy is proposed for providing quantitative data on the phase proportions which are needed in the establishment of diagnosis indicators.
Experimental
Raman spectroscopy. Raman spectroscopy measurements were performed at the LADIR
(Laboratoire de Dynamique Interaction et Réactivité) using Notch or Edge filter based micro-spectrometers. These high luminosity devices allow the recording of Raman spectra even with very low Laser excitation power which is needed to avoid material thermal modification which could easily occur with iron oxides or oxi-hydroxides [3-6]. The first spectrometer used is a LabRam Infinity (Horiba Jobin Yvon) based on a Notch filter, a 1800 lines/mm grating, a local length of 300 mm, a Peltier cooled CCD and equipped by a frequency doubled Nd:YAG Laser at 532 nm. The second one is a LabRam HR800 (Horiba Jobin Yvon) characterised by a local length of 800 mm, some Edge filters and a Peltier cooled CCD. For our experiments we use a 600 lines/mm grating (allowing the recording in one acquisition of the whole spectral range of our interest) and the 514 nm emission of an air cooled Ar+ Laser. Spectral resolution of both set-ups is around 2 cm-1 and calibration is checked by the 520.5 cm-1 line of silicon. Microanalysis is achieved through Olympus microscopes and classic or long working distance x50 and x100 Olympus objectives. With a x100 objective the analysed diameter area is about 2 µm. Density filters are used to modulate Laser power at the samples. With our spectrometer configurations we have checked that under a x100 objective a power of about 100 µW allows to avoid the thermal modification of all analysed iron corrosion products. Spectra acquisitions are managed by the LabSpec software (Horiba Jobin Yvon), which also drive the recording of spectral maps by controlling an automated XY microscope stage.
Samples. Corrosion in soils is studied by buried artefacts coming from five French
archaeological sites [7,8]: Avrilly, Cabaret, Glinet, Montbaron and Montreuil en Caux. Especially we analysed near than 30 samples from the Glinet archaeological site (Normandy, France) an iron production centre of the 16th century. This archaeological site is also characterised by a waterlogged soil because of the ancient dam overhanging the place, which maintains an anoxic environment [9]. At the contrary an aerated environment characterises the corrosion conditions for the four other archaeological sites.
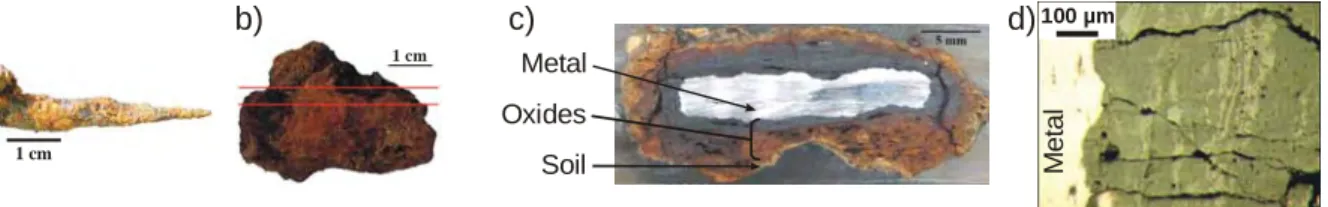
1 cm 1 cm 100 µm Metal Oxides Soil a) b) c) d) Me ta l
Fig. 1. Examples of studied excavated objects. a) nail, b) plate, c) cross-section of the whole corrosion system, d) micrography of the corrosion layers (sample Cab21h, Cabaret site).
From all sites numerous iron artefacts without high historical value (as nails, small plates, rod…) could be sampled for analysis. In order to observe the whole corrosion system,
artefacts were sampled with the adhering soil, embedded in epoxy resin and a cross-section is polished at a metallographic quality under ethanol to proscribe water damaging for the system (Fig. 1). Their observation in cross-sections allows to study the stratigraphy and organisation of corrosion products. From metal to soil, the cross-section is described as follow [10]: the metallic substrate (with some slag inclusions), the dense product layer (corrosion products with markers from the metal, i.e. slag inclusions), the transformed medium (corrosion products with markers from the soil, i.e. quartz grain) and the soil (free of corrosion products).
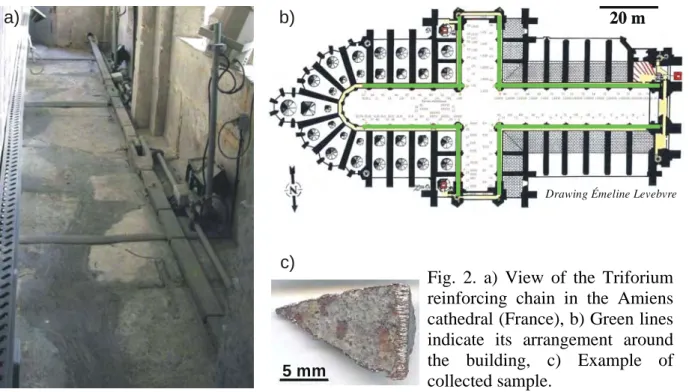
Long term atmospheric indoor corrosion could be studied with iron pieces used as metallic reinforcements in medieval buildings, mainly cathedrals [11]. Above all an extensive sampling was performed on the iron chain of the Amiens cathedral in order to obtain a representative description of its corrosion [12]. This reinforcement chain was settled in 1497 around the Triforium to strengthen the building structure after its construction in the XIIIth century (Fig. 2). Millimetre-length samples were prepared as described above for stratigraphic observation and analysis.
20 m 20 m 20 m
Drawing Émeline Levebvre
a) b)
5 mm 5 mm
c)
Raman identification of iron corrosion products
The effective Raman scattering of iron corrosion products allows their detection even with excitations at low Laser power with reasonable spectra accumulation time, and their respective spectra exhibit characteristics features which clearly fingerprint their structural nature and state. Literature Raman studies of iron oxides or oxyhydroxides are published in works dealing with their structure/mineralogy [13-18,3], corrosion and electrochemistry [19-33,4], pigments [34-37], characterisation of ferrofluids [38,39]... Because Raman spectral shapes could be strongly affected by excitation wavelength (resonance effects) and spectrometers specifications, the scrupulous spectra comparison over different studies (set-up) should be carried out with precautions. Especially spectra obtained with non high luminosity spectrometers (those of high luminosity are only available since the end of the nineties) are distinguished by some poor signal/noise ratio, or could be sometime affected by heating effects [16] induced by Laser power needed for significant scattering detection.
Fig. 2. a) View of the Triforium reinforcing chain in the Amiens cathedral (France), b) Green lines indicate its arrangement around the building, c) Example of collected sample.
Raman spectra recorded using our devices from commercial or synthesised iron oxides or oxyhydroxides usually encountered as corrosion products are presented in Fig. 3. Phases which display the stronger Raman scattering are: Lepidocrocite (γ-FeOOH), Goethite (α-FeOOH) and the chlorinated oxyhydroxide Akaganeite (β-FeOOH). Hematite (α-Fe2O3) only found in case of corrosion at high temperature (or as the result of a Laser heating) also presents an intense spectrum characterised under a green excitation by the weighty resonant 1310 cm-1 band. On the other hand Maghemite (γ-Fe2O3) and Magnetite (Fe3O4) oxides present weaker spectra with also fewer distinct vibrational bands not always specific of these phases, reasons which could make difficult their detection or distinction especially in case of complex phase mixtures [40].
200 400 600 800 1000 1200 1400 1600 Raman shift (cm )-1 200 400 600 800 1000 1200 1400 1600 Raman shift (cm )-1 200 400 600 800 1000 1200 1400 1600 Raman shift (cm )-1 In te n si ty ( A .U .) In te n si ty (A .U .) 200 400 600 800 1000 1200 1400 1600 Raman shift (cm )-1 200 400 600 800 1000 1200 1400 1600 Raman shift (cm )-1 200 400 600 800 1000 1200 1400 1600 Raman shift (cm )-1 250 390 310 720 390 289 223 1310 720 670 670 404 a) Lepidocrocite -FeOOH γ b) Goethiteα-FeOOH c) Akaganeite -FeOOH β d) Hematite -Fe O α 2 3 e) Maghemite -Fe O γ 2 3 f) Magnetite Fe O3 4
Fig. 3. Representative Raman spectra for some corrosion products. λ = 532 nm, Laser power at sample <100 µW, acquisition time from 15 min (a-d) to 60 min (e-f).
Corrosion forms recognised for buried artefacts
According to the conditions of corrosion: anoxic or aerated, two main corrosions forms were observed for studied artefacts. The Fig. 4 shows a representative example of the Glinet samples stratification [7,10]. The main phase is an iron carbonate (siderite) where SEM-EDS analyses have shown the content of some calcium at 1 to 4 %mass. However the short compositional range of this solid solution between calcium and iron carbonate explored did not allows its precise description by its Raman spectra. Thanks to the small analysing spot a fine strip of about 5 to 10 µm thick could be identified as magnetite. The Fig. 4 presents an example of Raman map across this magnetite strip underlined by the imaging of the 670 cm-1 band intensity. In this situation this layer seems to be a marker of the limit of the original surface of the object [41,42]. Other noticeable features are calcite grains and (Fig. 4) a sulphur rich strip (up to 17 %mass measured by SEM-EDS) for which no meaningful Raman spectra could be collected. Precise interpretation of this layer is still under debate, one possibility could be the consequence of a biological activity. The summary of the typical corrosion form of the Glinet site (anoxic environment) is presented in Fig. 5a.
Recent results had shown that for some Glinet sample another carbonated phase could be identified in the dense product layer with its main Raman band at 1073 cm-1 which correspond to an iron hydroxicarbonate (Fe2(OH)2CO3) [9,30,43]. Therefore further investigations are needed to clarify this phase formation and its role in the corrosion mechanisms. Metal 400 600 800 1000 1200 1400 1600 In te n si ty ( U .A .) Magnetite Siderite 400 600 800 1000 1200 1400 1600 Raman shift (cm )-1
Sulphur rich layer
Calcite Siderite Calcite grains Int ens it y ( U .A .) a) b) c) d) e)
Fig. 4. Typical cross-section of corrosion in anoxic environment (Glinet sample GL00-03). a) cross-section and scanned area for Raman mapping, b) Magnetite repartition obtained by imaging of the 670 cm-1 band, c) Example of obtained magnetite spectrum, d) Siderite spectrum, e) zoom of the main Raman band of siderite and calcite underlining their respective spectral shape.
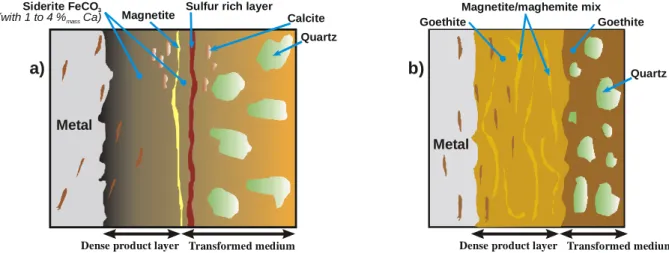
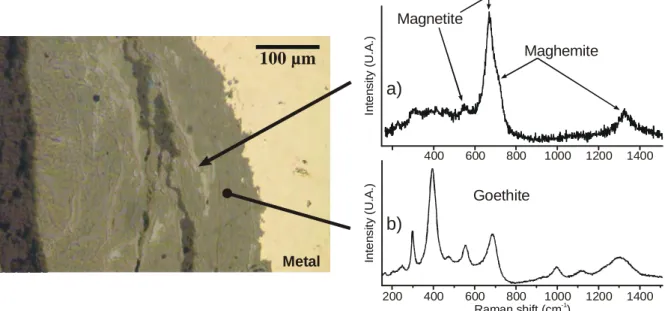
For corrosion in aerated soil, the samples from the four other sites analysed by microRaman characterisation allows the description of another corrosion products organisation summarised in Fig. 5b. The main phase is goethite striated in the dense corrosion products by discontinuous strips composed by magnetite often mixed with maghemite. An example of sample cross-section and its representative Raman spectra is given in Fig. 6.
Transformed medium Dense product layer
Metal
Siderite FeCO3
(with 1 to 4 %mass Ca) Magnetite Calcite
Sulfur rich layer
Quartz
Transformed medium Dense product layer
Magnetite/maghemite mix Goethite Metal Quartz Goethite a) b)
Fig. 5. Schematic corrosion forms for excavated artefacts for environments: a) anoxic b) aerated.
Beyond these general organisations of the corrosion products, other ferrous phases which contain chlorine could be found close to the metal-oxides interface for all studied sites [44]. These chlorinated phases are responsible for the possible rapid and dramatic corrosion phenomena which occur after excavation because of the modification of system equilibrium with by among others the sudden supply of oxygen. In literature the chlorine containing phase
100 µm Metal Goethite 200 400 600 800 1000 1200 1400 400 600 800 1000 1200 1400 In te n s it y (U.A .) In te n s it y ( U .A .) Maghemite Magnetite Raman shift (cm )-1 a) b)
Fig. 6. Characteristic cross-section of corrosion in aerated environment (Cabaret sample Cab16), a) spectra showing by the 670 cm-1 band enlargement for higher wavenumbers the presence of maghemite mixed with magnetite, b) Goethite spectrum.
mentioned is akaganeite (see for example [45]). Studies on our sample corpus have underlined the presence of another chlorinated iron compound: the iron hydroxychloride (β-Fe2(OH)3Cl) [46]. A distribution of these components is presented in Fig. 7 with their respective Raman spectra. Following their recognition and the study of their distributions [44,47] some mechanisms of formation were proposed [8]. The identification of two different phases containing chlorine will need to be fed back to the studies dealing with desalinisation treatments. In te n s it y (U .A.) Raman shift (cm )-1 400 600 800 1000 1200 1400 400 600 800 1000 1200 1400 200 200 In te n s it y (U. A .) 127 160 423 618 318 721 393 311 3515 3560 3550 3200 3000 3400360038004000 3500 3540 3580 3620 Raman shift (cm )-1 Iron hydroxychloride ( -Fe (OH) Cl)β 2 3
Akaganeite ( -FeOOH)β
100 µm Metal
Fig. 7. Localisation (sample Cab5) of the two chlorinated phases identified and their respective Raman spectra, presented also for their high frequencies part (OH region) which especially fingerprint the iron hydroxychloride.
Indoor atmospheric corrosion
Mechanisms of long-term atmospheric corrosion mechanisms are driven by wet-dry cycles [48]. As during the wetting stage the amount of iron oxidised is higher than the corresponding oxygen consumption [49] some constituents of the corrosion layer themselves should be involved in the iron oxidation [50]. Therefore the composition and organisation of the rust layer must be finely documented to precise the corrosion mechanisms and further some indexes to diagnose the corrosion state might be proposed. The specificity of Raman spectroscopy for this purpose is to be able to obtain spectral signatures for all involved oxides or oxyhydroxides even for those poorly crystallised.
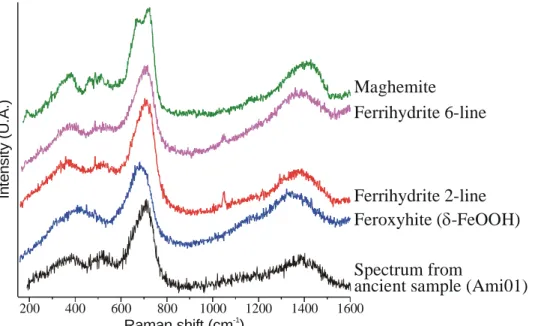
Maghemite 200 400 600 800 1000 1200 1400 1600 Ferrihydrite 2-line Ferrihydrite 6-line Feroxyhite ( -FeOOH)δ Spectrum from
ancient sample (Ami01)
Raman shift (cm )-1 In ten s it y ( U .A .)
Fig. 8. Raman spectra acquired in 300s for poorly crystallised hydrated iron III oxide or oxyhydroxide: maghemite, 2-lines and 6-lines ferrihydrites, feroxyhite and a representative spectrum from light gray marbles of an Amiens sample.
The rust layer is described as a goethite matrix, some localised zones of lepidocrocite and marblings with phases typified by weak Raman spectra dominated by a large band around 700 cm-1 (Fig. 8) [11]. The precise structural attribution of such spectrum is not obvious because several phases could display similar spectra: ferrihydrites (Fe5HO8, 4H2O; with two types called 2-lines and 6-lines [17] depending on their X-ray diffraction pattern), feroxyhite (δ-FeOOH [21,51]) and maghemite in case of deteriorated spectrum by a low counting statistic or a poor crystallisation state (Fig. 8). Rather than a guess for each acquired spectrum, a first general approach is to attribute such spectrum in a generic way to a poorly crystallised hydrated iron III oxide or oxyhydroxide. The last identified phase is akaganeite located in the external part of the rust and around cracks. This general organisation is illustrated on Fig. 9 with qualitative structural imaging extracted from a Raman hyperspectral map following the procedure described in [11] which underline some complex phase mixtures even at the range of the analysed area under a x100 objective.
However beyond this qualitative approach, the search for indexes usable for diagnosis purposes will require the collect of quantitative data about phase proportions, because associated with reactivity characteristics [52,53] of each phases it will help the evaluation of system stability.
The current approach proposes a phase quantification using the Raman spectrum decomposition into a linear combination of pure phase spectra [12,54]. As a result suggestions of phase quantitative distribution could be proposed as shown on Fig. 9. With the qualitative
approach the image contrast is arbitrary chosen to call attention to major phase distribution. The subjectivity of this treatment is overcome by the quantitative maps where colour levels are related to contents range. Furthermore if a significant part of the sample is scanned by Raman maps, the global phase proportions in the rust could be estimated by making the average of all spots measured.
20 µm Goethite 2 4 6 8 10 12 18 16 14 12 10 8 6 4 2 2 4 6 8 10 12 2 4 6 8 10 12 2 4 6 8 10 12 Lepidocrocite Fe III oxyhydr/oxide Akaganetite
83-100 67-83 50-67 33-50 17-33 0-17 Me ta l Qu ali tat iv e Qu an tit a ti ve Content % 18x14 spectra Step: 2.9x3.3 µm
Fig. 9. Raman structural imaging (sample Am IVE110, Amiens, obj. x50) with the comparison of phase mapping between qualitative treatment (from spectrum region of interest) and semi-quantitative results from spectral decomposition.
Conclusions
Ancient iron artefacts considered as analogues of material long term behaviour could bring key information to document corrosion mechanisms. Associated with the possibility to diagnose the object conservation state these lead to the proposition of appropriate conservation or curative treatment for cultural heritage preservation. Both research and analytical expertises involve multi-techniques approaches dealing with nature and reactivity of corrosion products.
As presented in this paper for several iron corrosion environments, Raman micro-spectroscopy has proved its ability to bring structural characterisation at the micro-scale, qualitative phase distribution maps and with in progress developments of spectra treatments the possibility to evaluate phase proportions. Furthermore the user friendly implementation of Raman measurements compatible with classic or minimal sample preparation will ensure the development of its use within the analytical strategies developed for the study of ancient iron corrosion.
References
[1] Dillmann P., Béranger G., Piccardo P. and Matthiesen H., eds. Corrosion of metallic heritage artefacts. Investigation, conservation and prediction for long-term behaviour. European Federation of Corrosion Publications - EFC 48. Woodhead Publishing: Cambridge (2007) 378 pp.
[2] Bellot-Gurlet L., Pagès-Camagna S. and Coupry C.: Journal of Raman Spectroscopy, Vol. 37 (2006), p. 962-965.
[3] de Faria D. L. A., Venâncio S. and de Oliveira M. T.: Journal of Raman Spectroscopy, Vol. 28 (1997), p. 873-878.
[4] Bersani D., Lottici P. P. and Montenero A.: Journal of Raman Spectroscopy, Vol. 30 (1999), p. 355-360.
[5] Okudera H., Kihara K. and Matsumoto T.: Acta Crystallographica B, Vol. 52 (1996), p. 450-457.
[6] Shebanova O. N. and Lazor P.: Journal of Raman Spectroscopy, Vol. 34 (2003), p. 845-852.
[7] Neff D., Dillmann P., Bellot-Gurlet L. and Beranger G.: Corrosion Science, Vol. 47 (2005), p. 515-535.
[8] Réguer S., Dillmann P. and Mirambet F.: Corrosion Science, Vol. 49 (2007), p. 2726-2744.
[9] Saheb M., Neff D., Dillmann P., Matthiesen H., Foy D. and Bellot-Gurlet L.: Materials and Corrosion, Vol. 60 (2009), p. 99-105.
[10] Neff D., Apport des analogues archéologiques à l’estimation des vitesses moyennes et à l’étude des mécanismes de corrosion à très long terme des aciers non alliés dans les sols, 2003, PhD Thesis, Université de Technologie de Compiègne, 167 pp., available on line at http://tel.archives-ouvertes.fr/tel-00008604/fr/
[11] Neff D., Bellot-Gurlet L., Dillmann Ph., Reguer S. and Legrand L.: Journal of Raman Spectroscopy, Vol. 37 (2006), p. 1228-1237.
[12] Monnier J., Legrand L., Bellot-Gurlet L., Foy E., Reguer S., Rocca E., Dillmann P., Neff D., Mirambet F., Perrin S. and Guillot I.: Journal of Nuclear Materials, Vol. 379 (2008), p. 105-111.
[13] Beattie I. R. and Gilson T. R.: Journal of the Chemical Society (A), Vol. (1970), p. 980-986.
[14] Verble J.: Physical Review B, Vol. 9 (1974), p. 4236-5248.
[15] Hart T. R., Temkin H. and Adams S. B.: Proceedings of the 3rd International Conference on Light Scattering in Solids, Eds. M. Balanski, R. Leite and S. Porto, Flammarion, Paris, Vol. (1976), p. 254-258.
[16] Shebanova O. N. and Lazor P.: Journal of Solid State Chemistry, Vol. 174 (2003), p. 424-430.
[17] Mazzetti L. and Thistlethwaite P. J.: Journal of Raman Spectroscopy, Vol. 33 (2002), p. 104-111.
[18] Chamritski I. and Burns G.: Journal of Physical Chemistry B, Vol. 109 (2005), p. 4965-4968.
[19] Thibeau R. J., Brown C. W. and Heidersbach R. H.: Applied Spectroscopy, Vol. 32 (1978), p. 532-535.
[20] Farrow R. L., Benner R. E., Nagelberg A. S. and Mattern P. L.: Thin Solid Films, Vol. 73 (1980), p. 353-358.
[21] Nauer G., Strecha P., Brinda-Konopik N. and Liptay G.: Journal of Thermal Analysis, Vol. 30 (1985), p. 813-830.
[22] Ohtsuka T., Kubo K. and Sato N.: Corrosion-NACE, Vol. 42 (1986), p. 476-481. [23] Dünnwald J. and Otto A.: Corrosion Science, Vol. 29 (1989), p. 1167-1176. [24] Johnston C.: Vibrational Spectroscopy, Vol. 1 (1990), p. 87-96.
[25] Boucherit N., Hugot-Le Goff A. and Joiret S.: Corrosion Science, Vol. 32 (1991), p. 497-507.
[26] Thierry D., Persson D., Leygraf C., Boucherit N. and Hugot-Le Goff A.: Corrosion Science, Vol. 32 (1991), p. 273-284.
[27] Odziemkowski M. S., Schuhmacher T. T., Gillham R. W. and Reardon E. J.: Corrosion Science, Vol. 40 (1998), p. 371-389.
[28] Oh S. J., Cook D. C. and Townsend H. E.: Hyperfine Interactions, Vol. 112 (1998), p. 59-65.
[29] Oh S. J., Cook D. C. and Townsend H. E.: Corrosion Science, Vol. 41 (1999), p. 1687-1702.
[30] Savoye S., Legrand L., Sagon S., Lecomte S., Chausse A., Messina R. and Toulhoat P.: Corrosion Science, Vol. 43 (2001), p. 2049-2064.
[31] Legrand L., Maksoub R., Sagon G., Lecomte S., Dallas J. P. and Chaussé A.: Journal of the Electrochemical Society, Vol. 150 (2003), p. B45-B51.
[32] Pons E., Joiret S., Hugot-Le Goff A., David D. and Lemaitre C.: Techné, Vol. 18 (2003), p. 95-100.
[33] Townsend H. E., Simpson T. C. and Johnson G.: Corrosion-NACE, Vol. 50 (1994), p. 546-554.
[34] Clark R. J. H. and Curri M. L.: Journal of Molecular Structure, Vol. 440 (1998), p. 105-111.
[35] Hernanz A., Gavira-Vallejo J. M. and Ruiz-Lopez J. F.: Journal of Raman Spectroscopy, Vol. 37 (2006), p. 1054-1062.
[36] Legodi M. A. and de Waal D.: Dyes and Pigments, Vol. 74 (2007), p. 161-168.
[37] Froment F., Tournié A. and Colomban Ph.: Journal of Raman Spectroscopy, Vol. 39 (2008), p. 560-568.
[38] Chourpa I., Douziech-Eyrolles L., Ngaboni-Okassa L., Fouquenet J.-F., Cohen-Jonathan S., Soucé M., Marchais H. and Dubois P.: Analyst, Vol. 130 (2005), p. 1395-1403.
[39] Sousa M. H., Tourinho F. A. and Rubim J. C.: Journal of Raman Spectroscopy, Vol. 31 (2000), p. 185-191.
[40] Neff D., Reguer S., Bellot-Gurlet L., Dillmann P. and Bertholon R.: Journal of Raman Spectroscopy, Vol. 35 (2004), p. 739-745.
[41] Bertholon R., La limite de la surface d'origine des objets métalliques archéologiques. Caractérisation, localisation et approche des mécanismes de conservation., PhD Thesis, Université Panthéon-Sorbonne - Paris I, 2000, 394 pp., available on line at http://tel.archives-ouvertes.fr/tel-00331190/fr/
[42] Bertholon R.: in "Surface Modification Technologies XIV", Eds. T. S. Sudarchan and M. Jandin, ASM International, Vol. (2001), p. 442-446.
[43] Bernard M. C., Duval S., Joiret S., Keddam M., Ropital F. and Takenouti H.: Progress in Organic Coatings, Vol. 45 (2002), p. 399-404.
[44] Réguer S., Phases chlorées sur les objets archéologiques ferreux corrodés dans les sols : caracterisation et mécanismes de formation, 2005, PhD Thesis, Université Paris Sud - Paris XI, 328 pp., available on line at http://tel.archives-ouvertes.fr/tel-00011748/fr/
[45] Ståhl K., Nielsen K., Jiang J., Lebech B., Hanson J. C., Norby P. and van Lanschot J.: Corrosion Science, Vol. 45 (2003), p. 2563-2575.
[46] Réguer S., Neff D., Bellot-Gurlet L. and Dillmann P.: Journal of Raman Spectroscopy, Vol. 38 (2007), p. 389-397.
[47] Réguer S., Dillmann P., Mirambet F. and Bellot-Gurlet L.: Nuclear Instruments and Methods in Physics Research B, Vol. 240 (2005), p. 500-504.
[48] Evans U. R. and Taylor C. A. J.: Corrosion Science, Vol. 12 (1972), p. 227-246.
[49] Stratmann M.: Berichte der Bunsen-Gesellschaft für Physikalische Chemie, Vol. 94 (1990), p. 626-639.
[50] Stratmann M. and Hoffmann K.: Corrosion Science, Vol. 29 (1989), p. 1329-1352. [51] Boucherit N., Delichere P., Joiret S. and Hugot-Le Goff A.: Material Science Forum,
Vol. 44-45 (1989), p. 51-62.
[52] Lair V., Antony H., Legrand L. and Chaussé A.: Corrosion Science, Vol. 48 (2006), p. 2050-2063.
[53] Antony H., Perrin S., Dillmann P., Legrand L. and Chaussé A.: Electrochimica Acta, Vol. 52 (2007), p. 7754-7759.
[54] Dubois F., Mendibide C., Pagnier T., Perrard F. and Duret C.: Corrosion Science, Vol. 50 (2008), p. 3401-3409.