HAL Id: tel-02078687
https://tel.archives-ouvertes.fr/tel-02078687
Submitted on 25 Mar 2019HAL is a multi-disciplinary open access archive for the deposit and dissemination of sci-entific research documents, whether they are pub-lished or not. The documents may come from teaching and research institutions in France or abroad, or from public or private research centers.
L’archive ouverte pluridisciplinaire HAL, est destinée au dépôt et à la diffusion de documents scientifiques de niveau recherche, publiés ou non, émanant des établissements d’enseignement et de recherche français ou étrangers, des laboratoires publics ou privés.
Neural signatures of conciousness abolition and recovery
from coma
Brigitta Malagurski
To cite this version:
Brigitta Malagurski. Neural signatures of conciousness abolition and recovery from coma. Neuro-science. Université Paul Sabatier - Toulouse III, 2018. English. �NNT : 2018TOU30039�. �tel-02078687�
2
Acknowledgments
Firstly, I would like to express my gratitude to my supervisors, Stein Silva and Patrice Péran, for their patient guidance, enthusiastic encouragement and fruitful scientific discussions. Your passion for science is truly inspirational. Patrice, thank you for guiding me through all the subtleties of neuroimaging data analysis and for providing the opportunity to collaborate on other research projects, thus allowing me to grow as a research scientist.
Besides my advisors, I would like to thank the rest of my thesis committee, for their insightful comments and encouragement, but also for their hard questions and useful critiques of this research work.
My sincere thanks also goes to Jérémie Pariente, and Emmanuel Barbeau, who provided me an opportunity to enroll in a master's program and join their research teams, here in Toulouse. Without your help, this would not have been possible.
I would like extend my gratitude to Sophie Achard, who helped oversee my training, and offered me invaluable advice and expertise regarding the application of graph theory in the field of neuroscience.
I wish to thank my fellow labmates and all of those with whom I have had the pleasure to work during this and other related projects.
Finally, I would like to express a deep sense of gratitude to my parents whose unconditional love and support are with me in whatever I pursue. Last but not the least, I wish to thank my loving partner, Daniel, for his encouragement and continual support throughout this experience, without which I would be lost. Your support keeps me going even on the toughest days.
3
Abstract
Recent advances in clinical care have resulted in an increasing number of patients who survive severe brain injury, however, many of these patients initially show a complete absence of arousal and awareness of one self and their surroundings. From this initial state of unarousable unresponsiveness, defined as coma, patients can fully regain consciousness or evolve into other (chronic) disorders of consciousness. The aim of the present thesis was to characterize the functional and structural neural correlates of acute consciousness abolition (i.e. coma) and identify early neural signatures of long-term neurological recovery. To do so, we studied severely brain-injured patients, recruited in the acute stage of coma, using resting-state functional and structural MRI.
We have conducted our analysis at a three-fold level: i) global level, in exploring brain’s residual ability to segregate and integrate information across several high-order resting-state functional networks (RSNs) (i.e. default-mode network, executive control network and salience network), known to be involved in self-related processing and potentially critical for consciousness emergence; ii) regional level, in investigating resting-state functional interactions between the hub nodes of high-order RSNs, with a primary focus on posteromedial cortex (PMC) and the medial prefrontal cortex (mPFC) inter-connectivity; iii) multi-modal level, in exploring the association between the PMC-mPFC functional disruption and corresponding gray and white matter (i.e. cingulum) structural damage.
The global-level analysis indicated a significant topological reorganization of high-order resting-state networks in the acute stage of coma. This reorganization, assessed using graph theory, was reflected in dedifferentiated and less resilient patients’ functional brain networks, accompanied with a loss of long-range fronto-parietal connections. On a regional level, we found a complex pattern of voxel-wise decrease and increase in resting-state functional connection density between the posteromedial cortex and the medial prefrontal cortex. These connection density patterns seemed to permit outcome prediction in patients, assessed three months post-coma. Furthermore, the multi-modal analysis demonstrated a significant association between the antero-posterior functional connectivity and structural integrity between/within these two regions.
In conclusion, our results imply significant heterogeneity in both functional and structural brain integrity in coma patients irrespectively of their apparent behavioral homogeneity. Regarding
4
functional connectivity at rest, patients’ brains appear to be radically reorganized at both global and regional level, with some of these patterns seeming to be related to neurological recovery. As such, these findings hold a significant promise towards the application of neuroimaging in early outcome prediction and could inspire novel personalized therapeutic approaches aiming to promote the re-emergence of consciousness and long-term neurological recovery.
Key words: coma, brain-injury, neuroimaging, resting-state functional connectivity, structural integrity, graph theory, prognosis.
5
Résumé
Les progrès récents dans les soins cliniques ont entraîné un nombre croissant de patients qui survivent à une lésion cérébrale grave, cependant, beaucoup de ces patients montrent initialement une absence totale d'éveil et de conscience de soi et de leur environnement. À partir de cet état initial, défini comme un coma, les patients peuvent reprendre complètement conscience ou évoluer vers d'autres états plus chroniques d’altération de cette capacité cognitive.
L’objectif de cette thèse était de caractériser les corrélats neuronaux fonctionnels et structurels de l'abolition de la conscience dans le coma induit par une lésion cérébrale sévère et d'identifier les signatures neuronales précoces de la récupération neurologique à long-terme. Pour atteindre ce but, nous avons étudié des patients cérébrolésés, recrutés au stade aigu du coma, à l'aide de l'IRM fonctionnelle au repos et IRM structurale.
Nous avons mené notre analyse à trois niveaux: i) niveau global, en explorant la capacité résiduelle du cerveau à ségréger et à intégrer l'information à travers plusieurs réseaux fonctionnels au repos (RFR) d'ordre élevé (i.e. le réseau du mode par défaut, réseau de contrôle exécutif, réseau de saillance) connus pour être impliqués dans l’émergence de la notion de soi; ii) au niveau régional, en étudiant les interactions fonctionnelles à l'état de repos entre les nœuds centraux des RFR (cortex postéromédial (CPM) et le cortex préfrontal médian (CPFM)); iii) selon une approche multimodale, en explorant l'association entre la perturbation fonctionnelle du CPM-CPFM et les lésions structurelles. L'analyse au niveau global a indiqué une réorganisation topologique significative des réseaux d'état de repos d'ordre élevé dans le stade aigu du coma. Cette réorganisation mise en évidence par l’analyse des graphes, semble associée à une importante dédifférenciation et à une réduction de la résilience des réseaux fonctionnels au repos d'ordre élevé. Une perte de connexions fronto-pariétales à longue distance a été aussi observée.
Au niveau régional, nous avons caractérisé un schéma complexe de diminution et d'augmentation de la densité de connexion fonctionnelle à l'état de repos entre le CPM et CPFM.
L’importance de ces anomalies de densité de connexion, semble liée à la récupération des patients dans le coma, à trois mois après l’agression cérébrale initiale. En outre, l'analyse IRM multimodale a permis de monter une association significative entre la connectivité fonctionnelle et l'intégrité structurelle entre/dans ces deux régions.
6
En conclusion, en ce qui concerne la connectivité fonctionnelle au repos, le cerveau des patients semble être radicalement réorganisé au niveau global et régional, et certaines de ces anomalies semblent liées à la récupération neurologique. En tant que tels, ces résultats représentent une promesse importante pour l'application de la neuroimagerie multimodale dans la prédiction précoce des résultats cliniques et pourraient inspirer de nouvelles approches thérapeutiques personnalisées visant à promouvoir la réémergence thérapeutique de la conscience à partir du coma.
Mots clés : coma, lésion cérébrale, neuroimagerie, connectivité fonctionnelle au repos, intégrité structurelle, théorie des graphes, pronostic.
7 Table of Contents
1 Chapter I – Conceptual framework ... 16
1.1 Theories of consciousness: neural networks and brain complexity... 16
1.1.1 Connectionists models ... 16
1.1.2 Neural correlates of consciousness ... 20
1.1.3 Clinical models of consciousness ... 21
1.2 Behavioral assessment of consciousness ... 27
1.2.1 Behavior Rating Scales... 27
1.2.2 The challenges of diagnosis and prognosis in DOC ... 29
1.3 Neuroimaging and conscious processing: (re)framing paradigms ... 30
1.3.1 Magnetic Resonance Imaging ... 31
1.3.2 Diffusion weighted imaging (DWI) ... 32
1.3.3 Functional MRI (fMRI) ... 35
1.3.4 Resting-state fMRI (rs-fMRI) ... 36
1.3.5 Network-based analytical approach: graph theory ... 37
1.4 The restless brain: resting-state functional brain networks (RSNs) in healthy subjects ... 44
1.4.1 Functional differentiation ... 44
1.4.2 Functional integration ... 48
2 Chapter II – State of the art ... 52
2.1 Resting-state functional connectivity in acquired disorders of consciousness ... 52
2.1.1 DOC neuroimaging-based diagnosis ... 52
2.1.2 Prognostic value of resting-state functional connectivity in DOC ... 60
2.1.3 Resting-state FC-related signatures of brain injury mechanisms ... 63
2.2 Structural network integrity in coma, UWS and MCS ... 64
2.2.1 Diagnosis and patient’s stratification ... 64
2.2.2 DOC patient’s neuroprognostication ... 68
2.2.3 Structural MRI and brain injury mechanisms ... 69
2.3 Neural structure-function relationship in DOC – multimodal neuroimaging studies ... 72
2.4 Summary of neuroimaging findings – develop in more detail ... 75
3 Chapter III – The ACI-COMA project ... 76
3.1 ACI-COMA ... 76
3.1.1 Project design ... 76
3.1.2 MRI data acquisition parameters ... 77
3.1.3 The recruited participants ... 78
3.1.4 Main goals and objectives ... 79
8
4.1 Neural signature of coma revealed by posteromedial cortex connection density analysis .... 80
4.1.1 Scientific justification ... 80
4.1.2 Objectives and hypotheses ... 81
4.1.3 Materials and methods ... 81
4.1.4 Results ... 86
4.1.5 Discussion ... 93
4.2 Topological reorganization of high-order resting state networks in coma ... 97
4.2.1 Scientific justification ... 97
4.2.2 Objectives and hypotheses ... 97
4.2.3 Methods ... 98
4.2.4 Results ... 103
4.2.5 Discussion ... 112
4.3 The PMC-mPFC structure-function association in coma – an exploratory study ... 116
4.3.1 Scientific justification ... 116
4.3.2 Objectives and hypotheses ... 117
4.3.3 Methods ... 117
4.3.4 Results ... 121
4.3.5 Discussion ... 126
5 Chapter V - General discussion and future perspectives ... 131
6 Appendices ... 135
6.1 Paper I... 135
6.2 Appendices for Chapter I... 145
6.3 Appendices for Chapter IV ... 147
9
List of commonly used abbreviations
AD Axial diffusivity MCS Minimally conscious state
ADC Apparent diffusion coefficient MD Mean diffusivity
BI Brain injury mPFC Medial prefrontal cortex
BOLD Blood-oxygen-level dependent MRI Magnetic Resonance Imaging CDN Connection density negative correlation NCC Neural correlates of consciousness CDP Connection density positive correlation P.SAL Posterior salience network
CRS-R Coma Recovery Scale – Revised PCC Posterior Cingulate cortex dDMN Dorsal default mode network PET Positron emission tomography DOC Disorders of consciousness PMC Posteromedial cortex
DTI Diffusion Tensor Imaging PreCu Precuneus
DWI Diffusion Weighted Imaging RD Radial diffusivity
ECN Executive control network RECN Right executive control network EEG Electroencephalography ROI Region of interest
FA Fractional anisotropy Rs-fMRI Resting-state functional MRI FC Functional connectivity RSN Resting-state network
FPN Frontoparietal network SAL/SN Salience network
GCS Glasgow Coma Scale TBI Traumatic brain injury
GM Gray matter UWS Unresponsive wakefulness syndrome
HDI Hub disruption index VBM Voxel-based morphometry
ICA Independent component analysis vDMN Ventral default mode network LECN Left executive control network WM White matter
10
List of figures
Figure 1.1.1. Schema of the global neuronal workspace (GNW) model. ... 17
Figure 1.1.2. Seeing a face: Global Neuronal Workspace Theory (GNWT) vs. IIT. ... 20
Figure 1.1.3. Interaction between arousal and awareness in different states of (un)consciousness. ... 22
Figure 1.1.4. Different conditions that may follow acute brain injury. ... 24
Figure 1.1.5. Diagnostic criteria for DOC. ... 27
Figure 1.3.1. Three diffusion ellipsoids represent the diffusion profile of 3 different structures. ... 33
Figure 1.3.2. Major white matter structures of the human brain. ... 34
Figure 1.3.3. A. Schematic illustration of the origins of the BOLD effect in fMRI. B. Illustration of the typical BOLD hemodynamic response function. ... 35
Figure 1.3.4. An example of a a) binary graph, b) self-loop, c) weighted graph, d) directed graph, e) signed graph and a f) fully connected graph. ... 38
Figure 1.3.5. A simple binary graph and its representation by an adjacency matrix. ... 39
Figure 1.3.6. The processing pipeline for functional graph analysis. ... 40
Figure 1.3.7. A graphical example of global and local metrics. ... 42
Figure 1.3.8. Table of the most basic global and local metrics and associated interpretation... 43
Figure 1.3.9. Graphical representation of different types of networks. ... 44
Figure 1.4.1. Multiple cerebral networks that can be identified with ICA applied on rs-fMRI. ... 45
Figure 1.4.2. Functional connectivity reflects structural connectivity in the DMN. ... 47
Figure 1.4.3. A summary of functional connectivity of different sub-areas of the precuneus. ... 50
Figure 1.4.4. Illustration of the proposed theoretical account of the PCC, combining the three dimensions of (i) arousal; (ii) internal/external focus; and (iii) breadth of attentional focus. ... 51
Figure 2.1.1. Hub disruption of functional networks in comatose patients. ... 54
Figure 2.1.2. Predictive role of PCC-mPFC coupling measured during coma state and neurologic outcome. ... 63
Figure 2.2.2.2.1. Individual tract analysis comparing FA values between DOC patients and healthy controls. ... 65
Figure 3.1.1. ACI-COMA project design. ... 76
Figure 3.1.2. The MRI sequences. ... 77
Figure 4.1.1. Overview of the data analysis pipeline. ... 84
Figure 4.1.2. Differences in changes in connection density between PreCu and PCC and between traumatic and anoxic brain injury. ... 87
Figure 4.1.3. Spatial maps of changes in PMC-to-mPFC connection density in the patient group. ... 88
Figure 4.1.4. Intra-group spatial homogeneity differences between the traumatic and anoxic brain injury patients (threshold 33%). ... 90
Figure 4.1.5. The prognostic value of changes in PMC-to-mPFC connection density. ... 92
Figure 4.2.1.Global topology in controls and patients. ... 104
Figure 4.2.2. Brain node reorganization - the difference between groups in the HDI of global (nodal) efficiency and local efficiency... 105
Figure 4.2.3. Local network topology. ... 106
Figure 4.2.4. The analysis pipeline for the edge probability map. ... 108
Figure 4.2.5. Brain regions with a significantly lower local efficiency in patients in comparison to controls. ... 110
Figure 4.2.6. Network resilience. Network resilience to targeted attack (A and B) and random failure (C and D) in controls and patients. ... 111
11
Figure 4.3.4.3.2. Group differences in structural metrics of averaged ROIs. ... 121
Figure 4.3.4.3.3. Group differences in DTI metrics of the left and right cingulum. ... 122
Figure 4.3.4.3.4. Group differences in structural metrics of PMC and mPFC sub-regions... 123
Figure 4.3.4.3.5. Group differences in mean functional connectivity between the entire PMC and mPFC region... 124
Figure 4.3.4.3.6. Functional connectivity between each of the PMC and mPFC sub-regions in patient and control groups.. ... 124
Figure 4.3.4.3.7. Structure-function association in anoxic and traumatic brain injury comatose patients. ... 126
Figure 6.3.1. Individual traumatic brain injury patients’ connection density spatial maps. ... 147
Figure 6.3.2. Individual anoxic brain injury patients’ connection density spatial maps. ... 148
Figure 6.3.3. Differences in Calcarine-mPFC connection density changes between traumatic and anoxic brain injury. ... 149
Figure 6.3.4. Connection density changes in the Calcarine-mPFC control pathway (threshold 33%). ... 149
Figure 6.3.5. Logistic regression model. ... 150
Figure 6.3.6. Global topology in controls and patients – evidence of randomization. ... 153
Figure 6.3.7. Global efficiency (axis y) and HDI GE (axis x) at multiple thresholds (10-20%). ... 154
Figure 6.3.8. Functional connectivity (Pearson’s r) over all pairs of nodes, in controls and patients. 155 Figure 6.3.9. Nodal topology in non-random patients at different connection density thresholds. ... 158
12
List of tables
Table 2.1.1. Resting-state functional connectivity in DOC. ... 55
Table 2.1.2. Prognostic value of resting-state FC in chronic DOC patients. ... 61
Table 2.1.3. Prognostic value of resting-state FC in coma patients. ... 62
Table 2.2.1. Structural changes in DOC. ... 66
Table 2.2.2. Prognostic value of structural changes in chronic DOC... 70
Table 2.2.3. Prognostic value of structural changes in coma. ... 70
Table 2.3.1. Multimodal studies – structure-function association in DOC. ... 73
Table 3.1.1. Criteria for patient recruitment. ... 78
Table 3.1.2. Demographic and clinical characteristics of participants. ... 79
Table 4.4.1.1.1. Spatial homogeneity of changes in PMC connection density in the patient group. .... 90
Table 6.2.1. EEG studies with the graph theoretical approach ... 146
Table 6.3.1. Individual patient results – the total number of hypo/hyper-CDP and hypo/hyper-CDN voxels for PMC (Panel A), PreCu (Panel B) and PCC (Panel B). ... 150
Table 6.3.2. MNI center-mass coordinates of each of the nodes used in the analysis. ... 155
13
General introduction
Recent advances in clinical care have resulted in an increasing number of patients who survive severe brain injury (i.e. trauma, cardiac arrest, stroke etc.). Unfortunately, many of these patients initially show complete absence of arousal and awareness of one self and their surroundings. From this initial state of unarousable unresponsiveness, defined as coma, patients can fully regain consciousness or evolve into other disorders of consciousness such as the unresponsive wakefulness syndrome (UWS) and the minimally conscious state (MCS). Currently, there are no objective and reliable acute-stage prognostic markers that can help predict the evolution of disorders of consciousness. Estimating the likelihood of recovery in acutely comatose patients is very difficult due to behavioral non-responsiveness, differences in nature of brain injury (i.e. traumatic versus anoxic brain injury) and potential confounding factors such as medication and metabolic disturbance. More importantly, it has been implied that the lack of a complete understanding of neural characteristics of acute stage coma and reliable prognostic markers significantly contributes to practice variation in the withdrawal of life-sustaining therapy, which can be considered as soon as few days after the initial coma-inducing brain injury.
On a more positive note, recent advances in neuro-technologies implied that structural (e.g. diffusion MRI) and functional (resting-state; rs-fMRI) neuroimaging strategies, hold a significant promise in the detection of residual neural and cognitive processes indicative of consciousness, independently of behavioral responsiveness of patients.
Following this lead, we decided to focus our analysis on the intrinsic brain “activity” in the form of functional connectivity and structural integrity of brain-injured patients in the acute stage of coma. Therefore, the aim of the present thesis was to characterize the neural correlates of acute consciousness abolition (i.e. coma) and identify early neural signatures of neurological recovery. To do so, we longitudinally studied severe brain-injured patients using multimodal MRI methodology and standardized behavioral assessment.
My education background includes a MA in Psychology from the Faculty of Philosophy, University of Novi Sad (Serbia), and a MSc in Neuropsychology and Clinical Neurosciences from the Faculty of Medicine Purpan, University of Toulouse III – Paul Sabatier.
I have joined the already ongoing ACI-COMA project soon after I have finished my master’s degree in Toulouse. I have never worked with neuroimaging data before, so this thesis was challenging for me in the beginning, with all its difficulties related to data acquisition (and
14
processing) in the population of severely brain-injured patients in coma. Nevertheless, I very much appreciated the cross-domain collaboration with all its advantages and difficulties, as I worked alongside researchers with different backgrounds and clinicians who assured the safe and successful inclusion of our patients. I strongly believe that this research-clinic collaborative effort was an integral part in the evolution of the ACI-COMA project.
Outline
In chapter I we describe the behavioral profile of disorders of consciousness (DOC), various
theories of consciousness, and available behavioral and neuroimaging paradigms used for the diagnostic and prognostic assessment of brain-injured patients with impairments in consciousness.
In chapter II we review previous neuroimaging studies, upon which our research draws. This
section is divided into three sub-chapters, describing resting-state functional connectivity, structural integrity and structure-function association in chronic and acute stages (i.e. coma) of disorders of consciousness. In this chapter, we attempted to organize previous research based on its contribution to the domains of diagnostics, prognostics or pathology mechanisms related to different etiologies (i.e. traumatic and anoxic brain injury) in DOC.
In chapter III, we briefly describe the research design of the ACI-COMA project which served
as the basis for this thesis.
In chapter IV, we present the results that we have achieved to date. This section is subdivided
into three main sections, each describing a specific study conducted within the scope of this thesis.
The first study focuses on the voxel-wise resting-state functional connectivity (FC) between two regions of interest (i.e. posteromedial cortex and the medial prefrontal cortex), previously described to have a critical role in conscious processing. We also attempt to relate the identified FC changes in the acute stage of DOC – coma - to the neurological outcome registered three months after the initial inclusion.
In the second study we investigate the resting-state FC on a more global level, by applying the graph theoretical methods to analyze the topological organization of several high-order resting-state networks (i.e. DMN, SN, ECN), known to have an important role in high-level cognitive
15
functions including consciousness. This study was conducted in collaboration with Sophie Achard from the GIPSA-lab (CNRS) in Grenoble, France.
Finally, in the third study, we explore the association between the functional disruption and underlying structural damage, encompassing the regions of interest included in the first study.
In the chapter V, we review the contributions of the thesis and list possible directions of future
16
1 Chapter I – Conceptual framework
1.1 Theories of consciousness: neural networks and brain complexity
1.1.1 Connectionists models
The last few decades have given a myriad of philosophical and scientific theories attempting to account for the origin and nature of consciousness (Cavanna & Nani, 2014). Crucially, these theoretical frameworks have provided several concepts that could be empirically tested in physiology and pathological conditions.
The Global Neuronal Workspace (GNW) model was inspired by the theory of Baars (1988),
which states that consciousness is represented within a global workspace, a widespread architecture of neuronal networks with the capacity to coordinate and integrate information between a set of specialized brain sites – processors. The main idea behind the GNW is that conscious access, depends on global information availability encompassing selection, amplification, sustainability and global broadcasting of salient information between brain-wide processors.
From the neuronal architecture standpoint, this theory proposes two main computational brain spaces (Dehaene, Changeux, & Naccache, 2011): 1) a processing network which refers to a set of functionally specialized, automatic, and non-conscious processors (i.e. visual, auditive, verbal modules) with highly specific local or medium range connection which “encapsulate” information relevant to the function of a given processor; 2) global neuronal workspace consisting of a subset of distributed cortical pyramidal neurons with long-range excitatory axons (i.e. particularly dense in prefrontal, cingulate, parietal cortices) interconnecting multiple specialized processors (Figure 1.1.1).
It is worth noting that GNW neurons are widely distributed, so there is no single brain center where the conscious information is stored and broadcasted but rather a conscious synthesis achieved when multiple brain processor “converge to a coherent metastable state” (Dehaene et al., 2011). Nevertheless, empirical data suggest that the global ignition related to conscious experience is supposedly linked to the fronto-parietal network, and the state of activation of GNW neurons is assumed to be globally regulated by vigilance signals from the ascending reticular activating system which is involved in regulating the sleep-week cycle.
17 Figure 1.1.1. Schema of the global neuronal workspace (GNW) model.
The GNW model proposes that associative perceptual, motor, attention, memory and value areas interconnect to form a higher level unified space where information is broadly shared and broadcasted back to lower-level processors. Reproduced from Dehaene et al. (1998).
In 1998, Tononi and Edelman proposed an alternative model. The dynamic core hypothesis based on the assumption that consciousness experience is at once differentiated (i.e. isolation of one specific content out of a vast number of potential internal representations) and integrated (i.e. unified conscious representation, where whole carries more information than each part alone). In 2004, Tononi proposed the Integrated Information Theory of consciousness (IIT) which has been continuously developed over the last decade. IIT does not hypotheses about specific neural correlates underlying the conscious experience but it attempts to “explain the essential phenomenal properties of experience, or axioms, and infers postulates about the characteristics that are required of its physical substrate (PSC)”, described below (Tononi, Boly, Massimini, & Koch, 2016):
The first axiom of IIT states that experience exists intrinsically and that it is independent of the external observer. The corresponding postulate states that the PSC must also exist intrinsically
18
and that it must have a cause-effect power on itself. A minimal system composed of two interconnected neurons can satisfy the criteria, because it can make a difference to itself through its reciprocal connections.
The axiom of composition states that consciousness is structured, being composed of several phenomenal distinctions which exist within it. For example, within an experience I can distinguish an olive tree, a rose flower, green grass and many other sub-elements constituting a hypothetical “garden” scene. The corresponding postulate implies that elements that constitute the PSC must also have a cause-effect power upon PSC, either alone (first-order mechanism) or in various combinations (high-order mechanism).
The axiom of information states that conscious experience is specific, being composed of a set of phenomenal distinctions (qualia), thereby differing from other possible experiences (differentiation). For example, in a “garden” scene, a content of my conscious experience might be composed of me seeing a rose flower (in opposed to not seeing it) which is red (in contrary to not being red). The corresponding postulate states the PCS must specify a cause-effect structure, a specific set of cause-effect repertoires, differing it from all other possible structure. The axiom of integration states that each conscious experience is unified and irreducible to non-interdependent sub-sets of phenomenal distinctions. For example, my visual experience of the garden can’t be subdivided into independent experience of the left and right sides of the visual field. The corresponding postulate implies that cause–effect structure specified by the PSC must also be unitary and intrinsically irreducible to non-interdependent sub-systems (Φ>0). The irreducibility of a conceptual structure is measured as integrated information - Φ, the minimum distance between an intact and a partitioned cause–effect structure.
Finally, the axiom of exclusion states that an experience is definite in its content and spatio-temporal grain, implying that its phenomenal content and duration are definite. For example, I do not perceive the garden with more flowers than there are, nor do I perceive it in grey if it has colorful flowers. The corresponding postulate states that the cause-effect structure specified by the PCS must also be definite, with definite set of elements with definite spatio-temporal grain, maximally irreducible intrinsically (Φmax), called a conceptual structure, made of maximally
irreducible cause-effect repertoires (concepts).
Thus, the physical substrate of consciousness is called a complex and it is consisted of a set of elements in a state that satisfies all the postulates. According to IIT, the quality (content) of consciousness corresponds to the form of the conceptual structural and the quantity of consciousness refers to its irreducibility Φmax.
19
Although both theories put an emphasis on (global) integration of information, there are some important differences between the GNW and the IIT theory.
Perhaps the most notable one is that the GNW implies underlying neuronal structure (“ignition” of fronto-parietal workspace neurons), while IIT starts from experience itself, rather than from a specific brain area or network. A comparative example between the two theories is given in an article of Tononi and colleagues (2016) (Figure 1.1.2).
In GNW, information which is relayed through sensory pathways remains unconscious until it enters the global workspace and is broadcasted to specialized processors (Figure 2– upper panel). In IIT, the information content of consciousness is specified intrinsically (by the system for the system, rater then extrinsically) and is a conceptual structure – “a form in a cause-effect space specified by the elements of the PSC” (Tononi et al., 2016; Figure 1.1.2– lower panel). Thus, in IIT neurons shape the overall form of the conceptual structure specified by the PSC, in oppose to processing, encoding or broadcasting an information as in GNW. In addition, GNW defines consciousness as all-or-none phenomenon, while IIT implies that it is graded, that it increases in accordance to a system’s repertoire of available states.
Further, the association between the complexity (widespread and differentiated) of brain network activity and the state of consciousness (Koch et al., 2016) has been demonstrated in natural, pharmacological and pathological alterations of consciousness using coupled transcranial magnetic stimulation and EEG recordings (Casali et al., 2013; Casarotto et al., 2016), and dynamics of spontaneous activity measured using fMRI (Barttfeld et al., 2015; Hudetz et al., 2015; Tagliazucchi, et al., 2016). Moreover, the cerebral cortex is ideally suited for integrating information, due to a coexistence of functional specialization in form of multiple brain sub-networks (fronto-parietal) and hub-node integration (i.e. hub regions; PCC), often disrupted in brain injury and disorders in consciousness as we will see in the following chapters.
20 Figure 1.1.2. Seeing a face: Global Neuronal Workspace Theory (GNWT) vs. IIT.
The experience of seeing a face is contrasted with seeing visual noise following presentation of a degraded image. The top panel is a schematic rendition according to GNWT, the bottom panel according to IIT. In both panels a ‘face’ neuron in the fusiform gyrus turns from high firing (red) to burst firing (yellow) when the face is seen. (Top panel) In GNWT, a “piece” of information becomes conscious if it is broadcast (blue radio waves) to a broad neural audience. (Bottom panel) In IIT, when the “face” neuron within the PSC turns to burst firing it changes the form of the conceptual structure. Stars linked to the PSC by black dotted lines highlight a small subset of these concepts, and a blue line between ‘face’ and ‘woman’ indicates a relation. Here, the information content of consciousness is specified intrinsically (by the system for the system itself). Reproduced from Tononi et al. (2016).
1.1.2 Neural correlates of consciousness
The neural correlates of consciousness (NCC) are defined as the “minimum neuronal mech-anisms jointly sufficient for any one specific conscious percept” (Koch, Massimini, Boly, & Tononi, 2016). The NCC can be further interpreted in two ways, depending if we refer to a specific content (i.e. transitive word use) of consciousness or the overall state (i.e. intransitive word use) of consciousness (Koch et al., 2016).
The content-specific NCC are the neural mechanisms which determine a phenomenal distinction within an experience (e.g. conscious experience of observing a rose flower in the
21
garden). The full NCC, are the neural substrates supporting conscious experience in its entirety, irrespective of a specific content.
The full NCC is usually investigated through such state-based comparisons, by contrasting brain activity when consciousness is present, as in healthy subjects or recovered patients, with brain activity in UWS or coma patients, in anesthesia or dreamless sleep. It is important to note, that during such states of complete consciousness abolition induced by brain injury, alterations in conscious processing occur alongside damage to multiple cognitive functions (and brain regions), frequently yielding confounding results in terms of consciousness-related neural correlates. Nevertheless, the clinical models have been proved to be indispensable in the ongoing “quest” for neural substrates of conscious processing, as we will see in the following chapter.
1.1.3 Clinical models of consciousness
The clinical definition of consciousness (e.g. as a physiopathological state) comprises two major components (Posner, Plum, & Saper, 2007): i) the arousal (the level of consciousness) implying behavioral alternation of sleep and wakefulness and the ii) awareness (content of consciousness) referring to conscious perception which includes collective thoughts and feelings of a given individual (Laureys, Owen, & Schiff, 2004; Laureys, 2005; Soddu et al., 2011). Awareness can further be subdivided into awareness of the external world (e.g., sensory perception of the environment) and of self that is the internal world (e.g., mind-wandering, mental imagery, inner speech).At a clinical level, the wakefulness or level of arousal is inferred by a prolonged period of spontaneous eye opening, while awareness is assessed by evaluating the command following and by observing non-reflex contingent behavior (i.e. eye tracking, oriented movement to pain) toward specific environmental stimuli (Demertzi, Sitt, & Sarasso, 2017).
At a neuroanatomical level, the level of arousal (and in particular of sleep-wake cycles) is controlled by the subcortical arousal systems in the brainstem, midbrain, and thalamus (Demertzi et al., 2017; Lin, 2000; Schiff, 2008). Awareness is thought to be supported by the functional integrity of the cerebral cortex and its subcortical connections, although its supporting neural correlates still need to be elucidated (Demertzi et al., 2017).
22 1.1.3.1 Acquired disorders of consciousness
Consciousness is not an all-or-none phenomenon but lies on a continuum of states, and it can range from normal consciousness where arousal and awareness level are high, to disorders of consciousness (DOC) where arousal can be present, while awareness is absent or fluctuating (Figure 1.1.3).
Figure 1.1.3. Interaction between arousal and awareness in different states of (un)consciousness.
REM, rapid eye movement; EMCS, emergence from a minimally conscious state; MCS+, minimally conscious state plus; MCS-, minimally conscious state minus; VS/UWS, vegetative state/unresponsive wakefulness syndrome; LIS, locked-in syndrome. Reproduced from Heine, Demertzi, Laureys, & Gosseries (2015).
We will briefly define the different states of consciousness such as coma, unresponsive wakefulness syndrome (UWS; previously known as vegetative state) and minimally conscious state (MCS), and the main causes of pathological impairment in consciousness such as traumatic and anoxic brain injury. We will also describe the locked-in syndrome (LIS), which is not a disorder of consciousness but is commonly misdiagnosed as a DOC.
23 1.1.3.1.1 Brain injury (BI) leading to DOC
The main etiologies of coma, and thus disorders of consciousness, are traumatic brain injury (e.g. motor vehicle accident, falling) and non-traumatic BI, such stroke, or anoxia (e.g., cardiac arrest). We will focus on two etiologies, traumatic and anoxic BI, as these were the main underlying causes of coma in our patients.
Anoxia refers to a complete reduction of oxygen supply or utilization, which is a direct result of reduced oxygen supply, reduced ambient oxygen pO2, low hemoglobin or impaired tissue utilization following poisoning of the mitochondrial cytochrome enzymes (Howard et al., 2012). Hypoxia is a milder form where there is available oxygen but at reduced levels for a period of time. Many anoxic comatose (i.e. post cardiac arrest) patients die or survive with severe disability after a prolonged stay in the intensive care unit (ICU) associated with important cost burden. Brain damage occurring after anoxia is related to diffuse and severe structural damage encompassing brain swelling, cortical laminar necrosis, basal ganglia necrosis, and delayed white matter degeneration and atrophy (Howard et al., 2012; Weiss, Galanaud, Carpentier, Naccache, & Puybasset, 2007). Gray matter seems to have greater vulnerability to anoxia/hypoxia in comparison to white matter, especially in brain regions that show high basal metabolic levels (Howard et al., 2012; Nolan et al., 2010).
Traumatic brain injury (TBI) occurs by the impact of an external force, with leading causes being falling and motor vehicle accidents (Sharp, Scott & Leech, 2014). TBI can be classified based on severity, ranging from mild trauma to severe brain injury resulting in prolonged coma or death. The primary injury can cause both focal and diffuse effects depending on the mechanism of brain injury (i.e. direct contact and acceleration–deceleration) (Sharp et al., 2014).
Focal injuries include skull fractures, hematomas, while diffuse injuries involve damage to long-distance white matter connections via diffuse axonal injury (DAI) and blood vessel damage via diffuse vascular injury (Mckee & Daneshvar, 2015; Sharp et al., 2014). Studies show that severe TBI with poor outcome and impaired consciousness, have diffuse damage to cortical, subcortical white matter and thalamic nuclei (Adams, Graham, & Jennett, 2000; Sharp et al., 2014).
Anoxic brain injury has been associated with high mortality rate in non-traumatic coma (Horsting, Franken, Meulenbelt, van Klei, & de Lange, 2015; Posner et al., 2007), and worse functional outcome following rehabilitation in comparison to traumatic brain injury (Cullen, Park, & Bayley, 2008; Cullen, Crescini, & Bayley, 2009; Cullen & Weisz, 2010). Also,
24
outcome (and prognostic markers) in disorders of consciousness has been shown to vary depending on etiology. Thus, brain injury mechanisms need to be taken into account during clinical management, diagnosis and prognosis of DOC patients.
1.1.3.1.2 Coma
Recent advances in clinical care have resulted in an increasing number of patients who survive severe brain injury such as trauma, cardiac arrest, stroke, infection or metabolic disruption. However, many of these patients initially show complete absence of arousal and awareness of one self and their surroundings (Laureys, 2005). This state of unarousable unresponsiveness, in which patients never open their eyes even if intensively stimulated, is defined as coma.
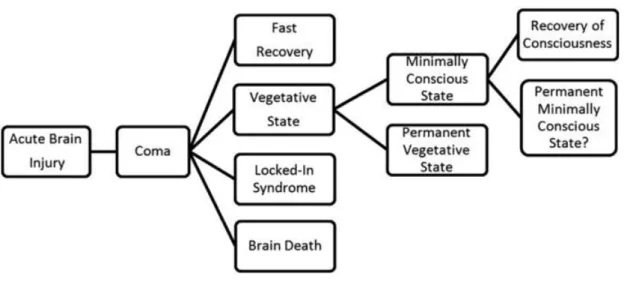
Autonomic functions, such as breathing and thermoregulation, are reduced, which often requires respiratory assistance. Nevertheless, coma needs to be distinguished from brain death (Wijdicks, 2001) resulting from irreversible brainstem damage. In this case neuroimaging shows “hollow skull phenomenon”, indicative of the permanent loss of neuronal function in the whole brain (Laureys, 2005). In general, coma persists from 2-4 weeks. From this initial state patients can fully regain consciousness or evolve into other disorders of consciousness such as the unresponsive wakefulness syndrome (UWS) and minimally conscious states (MCS) (Figure 1.1.4).
Figure 1.1.4. Different conditions that may follow acute brain injury.
The unresponsive wakefulness syndrome (UWS) was previously defined as the vegetative state. Reproduced from Gosseries et al. (2011).
25 1.1.3.1.3 Unresponsive wakefulness syndrome (UWS)
Unresponsive wakefulness syndrome, a revised name proposed as a more appropriate alternative to “vegetative state”, refers to patients who show intermittent wakefulness (manifested as eyes-open/eyes-closed periods) but have no awareness of self or the external world (Laureys et al., 2010). Patients exhibit reflexive motor activity (i.e. grinding, swallowing, crying, smiling) devoid of any voluntary interaction with the environment and unrelated to the (emotional) context (Heine et al., 2015). Hypothalamic and brainstem autonomic functions are generally preserved, with variably preserved cranial nerve and spinal reflexes, allowing survival and prolonged medical care (Demertzi, 2017). This state can be persistent but can also transient towards minimally conscious state or recovery (The Multi-Society Task Force on PVS, 1994). When there is no recovery after 12 months after traumatic brain injury and 3 months after anoxic brain injury, the state can be declared permanent and withdrawal of hydration and nutrition may be discussed (Laureys et al., 2000, 2004), however, this point is a matter of debate. Some cases of late recovery have been described in the literature (Estraneo et al., 2010), but there are currently no prognostic biomarkers which could highlight potential recovery during the early stages when withdrawal of therapy is considered.
1.1.3.1.4 Minimally conscious state (MCS)
The minimally conscious state describes patients who regain fluctuating but reproducible non-reflexive purposeful behavior such command following, visual pursuit or sustained fixation, intelligible verbalization, emotional or motor responses relevant to the environment stimuli (Demertzi et al., 2017; Giacino et al., 2002).
A new subcategorization of the MCS into MCS+ (plus) and MCS- (minus) has been recently proposed based on the complexity of patients’ behaviors (Bruno et al., 2011a). MCS+ refers to patients showing non reflexive voluntary responses such as command following, intelligible verbalization, and/or nonfunctional communication, while MCS- defines low-level behavioral responses such as visual pursuit or localization of noxious stimulation.
Patients are considered to have emerged from MCS (EMCS) when they show reliable and consistent demonstration of functional interactive communication (i.e. accurate yes/no responses to basic situational orientation questions) and/or functional object use (i.e. use of at least two different objects on two consecutive evaluations) (Giacino et al., 2002). EMCS
26
patients are no longer considered to suffer from DOC, however, they often have severe disability, and might continue to need full-time care. The MCS may be transitory, chronic or permanent, just like UWS. Interestingly, late recoveries have been noted, with one patient regaining reliable expressive language after 19 years in MCS (Voss et al., 2006). Importantly, the high rate of misdiagnosis in DOC has significant implication for prognosis, as it has been shown that MCS patients have significantly greater potential for recovery in comparison to UWS patients (Faugeras et al., 2017; Giacino & Kalmar, 1997; Hirschberg and Giacino, 2011; Luauté et al., 2010).
1.1.3.1.5 Locked-in syndrome (LIS)
This syndrome is not considered as a disorder of consciousness, but can be easily mistaken as a DOC due to patients’ loss of voluntary motor control and thus the ability to effectively communicate with the environment (Heine et al., 2015; Laureys, 2005). However, these patients are awake and aware, with no loss of cognitive function, in most cases. The most common cause of the LIS is ventral brainstem stroke. The primary mode of interaction is eye movements and blinking, however, recent advances in brain-computer interfaces (BCI) are of great help in providing more direct and spontaneous means of communication (Chaudhary, Xia, Silvoni, Cohen, & Birbaumer, 2017).
27 Figure 1.1.5. Diagnostic criteria for DOC.
Reproduced from Heine et al. (2015).
1.2 Behavioral assessment of consciousness
There are multiple standardized behavioral scales (Bruno et al., 2011b; Seel et al., 2010) routinely used in the clinical assessment of consciousness in brain injured patients. Among them, we will describe the scales used in our study (which are also routinely used in clinical practice).
1.2.1 Behavior Rating Scales
1.2.1.1 Glasgow Coma Scale (GCS)
GCS (Teasdale & Jennett, 1974; Teasdale et al., 2014) is simple and short scale, used mainly in intensive care settings. The GCS has three subscales that measure eye opening, verbal and motor responses. Each of the scales can be communicated separately or summed to create a total score. Each level of response is assigned a number—the worse the response, the lower the number. The total score varies between 3 and 15. In acute stages, brain damage is described as
28
severe if the score is less than or equal to 8, moderate if the score is between 9 and 12, and mild if the score is between 13 and 15.However, there have been some concerns with the GCS. The verbal response is impossible to assess in the case of intubation or tracheotomy, and the eye opening may not be sufficient to assess brainstem function (Laureys, Majerus, & Moonen, 2002).
1.2.1.2 The Full Outline of Unresponsiveness (FOUR)
FOUR has been proposed as a replacement to the GCS as it can detect subtler neurological changes (Wijdicks, Bamlet, Maramattom, Manno, & McClelland, 2005). It consists of four subscales (eye, motor, brainstem, and respiration), and each subscale has a maximal score of 4. The scale has been translated and validated in French language (Bruno et al., 2011b). FOUR is suitable for differentiating between VS and MCS, because it assesses visual pursuit, and can diagnose LIS and brain death.
1.2.1.3 The Coma Recovery Scale-Revised (CRS-R)
CRS-R is a recently developed clinical scale (Giacino, Kalmar, & Whyte, 2004), currently considered the most reliable and sensitive test for differential diagnosis of DOC (Seel et al., 2010).
The CRS consists of 25 hierarchically arranged items that comprise 6 subscales addressing auditory, visual, motor, oromotor, communication, and arousal processes. The lowest item on each subscale represents reflexive activity, whereas the highest items represent cognitively mediated behaviors (Giacino et al., 2004). CRS has been shown to have acceptable standardized administration and scoring, excellent content validity and test-retest reliability, and good internal consistency and inter-rater reliability (Giacino, Fins, Laureys, & Schiff, 2014; Seel et al., 2010). The scale has been translated and validated in French language (Schnakers et al., 2008). However, repeated CRS-R testing is advisable to minimize the risk of misclassification (Cortese et al., 2015), with one study suggesting at least 5 assessments within a short time interval (e.g., 2 weeks) to reduce the risk of misdiagnosis (Wannez, Heine, Thonnard, Gosseries, & Laureys, 2017).
29 1.2.2 The challenges of diagnosis and prognosis in DOC
1.2.2.1 Limitations of behavioral-based diagnosis
Diagnostic accuracy is critical in this field, in regard to appropriate everyday medical management (e.g. pain medication) and the decision of withdrawal of life-sustaining care (Turgeon et al., 2011). In addition, it could be expected that more accurate diagnosis holds the promise for personalized medicine, including individually-targeted therapeutic pharmacological (e.g. amantadine, zolpidem; Gosseries, Zasler, & Laureys, 2014) and/or nonpharmacological (e.g., deep brain stimulation, transcranial direct current stimulation) (Schiff et al., 2007; Thibaut et al., 2014, 2015, 2017; Cavaliere et al., 2016)
Diagnostic accuracy depends on multiple factors associated with the environment, examiner and/or patient. Differential diagnosis requires repeated standardized assessment by well-experienced and trained medical staff. Nonetheless, voluntary and reflexive behavior could be difficult to distinguish, as motor responses can be very small, quickly exhaustible and inconsistent, potentially leading to diagnostic error (Schnakers, Majerus, & Laureys, 2004). Environmental factors, such as paralytic and sedative medication, can significantly constrain voluntary behavioral responses, inducing bias in the diagnostic process. Furthermore, fluctuation in level arousal, fatigue, pain, severe central and peripheral damage leading to sensory deficits (e.g., cortical blindness/deafness), motor impairment (e.g., paralysis) or cognitive deficits (e.g., aphasia, apraxia, agnosia), (Bodien & Giacino, 2016) also pose a major problem in administrating and accurately interpreting the results of current clinical tests focused on overt patient behavior.
These problems are highlighted in studies that show that around 40% of patients diagnosed as UWS have some conscious awareness (Schnakers et al., 2009; van Erp, et al., 2015). LIS patients can also easily be mistaken as unconscious (Bruno et al., 2011a).
1.2.2.2 Limitations of behavioral-based prognosis
It must be stressed that prognostic markers for accurate long-term DOC patients’ assessment of recovery do not exist or are extremely limited (Haenggi, Z’Graggen, & Wiest, 2014; Weijer et al., 2016). Estimating the likelihood of recovery in acutely comatose patients is extremely difficult, due to behavioral non-responsiveness, differences in nature of brain injury (i.e. traumatic vs. anoxic BI) and potential confounding factors such as medication and metabolic disturbance. Also, patient outcome after severe brain injury is highly variable (Sharp et al.,
30
2014), especially in traumatic brain injury, as some patients regain independence, while others have serious cognitive deficit and are unable to function without personal care assistance. The prediction accuracy of current prognostic markers used in the clinical setting (for brief see Weijer et al., 2016) remains generally low, and is defined according to a binary outcome (survival vs. death) without any distinction between different DOC categories or the degree of functional impairment at long-term. More importantly, the lack of objective and reliable prognostic markers might significantly contribute to practice variation in the withdrawal of life-sustaining therapy. This was highlighted in a study of Turgeon and colleagues (2011), including 720 patients with severe traumatic brain injury in six level I trauma centers. The authors found a mortality rate of 32%, with 70% of death attributable to withdrawal of life-sustaining therapy, with half occurring within the first 72 h of injury. In addition, the hospital mortality rates differed substantially, ranging from 10.8% to 44.1%, partially due to physicians’ different perceptions of long-term prognosis (Turgeon et al., 2011).
Therefore, the importance of conducting coma-related research is two-fold: a) fundamental - coma presents a unique model for the research of neural correlates of consciousness; and b) clinical - there is an urgent need for acute-stage markers serving the purpose of diagnosis(e.g. brain’s residual capacity for conscious processing), monitoring (e.g. changes of brain function/structure), and prognosis (e.g. identifying patients with a potential for recovery). Once these markers are identified, they can be applied in the development and application of novel personalized treatments aiming to restore consciousness and neurocognitive function.
1.3 Neuroimaging and conscious processing: (re)framing paradigms
The increasingly powerful neuroimaging technologies have been leading to a significant paradigm shift and have helped surpass some limitations posed by behavioral testing (Laureys & Schiff, 2012). Functional neuroimaging strategies (i.e. fMRI, EEG) have enabled the detection of convert awareness in patients previously thought to be in unresponsive wakefulness syndrome (i.e. fMRI-based active paradigms) (Peterson, Cruse, Naci, Weijer, & Owen, 2015; Monti et al., 2010) and permitted “non-communicative” and locked-in patients to communicate their though and interact with the environment through willfully modulated brain activity (i.e. EEG paradigms; Luauté et al., 2015).
However, due to the complexity of disorders of consciousness, as described earlier, patients may not be able to participate (via brain activity or motor/behavior responsiveness) in
31
neuroimaging-based tasks, and could therefore be wrongfully identified as unconscious despite preserved capacity for conscious processing. Thus, an alternative approach has been proposed to active paradigms, in the form of resting-state functional and structural neuroimaging strategies, which serve to detect residual neural and cognitive processes indicative of consciousness, independently of behavioral responsiveness of patients. These advanced (resting-state) neuroimaging techniques hold significant promise in providing diagnostic and prognostic information for DOC patients, however, much work is needed before they can be used in clinical setting. The following chapters will provide more detail on the MRI basics, current state and methodological advancement in the application of neuroimaging in DOC assessment.
1.3.1 Magnetic Resonance Imaging
Neuroimaging includes the use of various techniques to either directly or indirectly image the structure or function of the brain. Magnetic Resonance Imaging (MRI) was developed in late 1970s, by researchers including Peter Mansfield and Paul Lauterbur, and is widely used today to image the brain both in health and disease. MRI is non-invasive imaging technique that uses magnetic fields, radio waves, and field gradients to generate images of internal organs, without exposure to ionizing radiation.
1.3.1.1 Acquisition methods
The MRI scanner consists of a large, powerful magnet placed in a horizontal tube in which the patients enters. The strength of a magnet in an MRI system is rated using a unit of measure known as a tesla (T), which can range from 0.5T to 7T, with most today’s scanners working at 3T. MRI is based on the magnetization properties of hydrogen nuclei (protons), mainly contained in water molecules. These protons are randomly spinning, or precessing, on their axis, around their individual magnetic fields.When the patient enters the MRI scanner a very strong magnetic field (B0) is applied to align the proton spins in the direction of the field (z direction). Next, a radio frequency (RF) pulse that is specific only to hydrogen (Larmour frequency) is applied, perturbing the alignment (or magnetization) of protons. The protons absorb the energy from the variable field and flip their spins into the xy plane, a process called excitation. When the RF pulse is turned off, the protons gradually return to their normal spin (equilibrium) releasing the energy absorbed from the RF pulses, creating a signal that is picked
32
up by the coils placed in the MRI tube. This process is called relaxation and occurs in different rates depending on the tissue type. There are two different relaxation times - T1 and T2. T1 is the time constant which determines the rate at which excited protons return to equilibrium, that is align with the external magnetic field in the z direction (longitudinal relaxation). T2 is the time constant which determines the rate at which excited protons reach equilibrium or go out of phase with each other in the xy plane (transverse magnetization) (external factors such as magnetic field inhomogeneity can increase the T2, as captured in T2*).
By varying several MRI sequence parameters, images can be acquired with varying contrast between different brain tissues. Some of the adjustable parameters are the: repetition time (TR) - time between successive pulse sequences - and echo time (TE) - time between the RF pulse and the sampling of the echo signal. T1-weighted images are produced by short TE and TR times. Tissues with short T1 appear bright on the image because they regain most of their longitudinal magnetization during the TR interval (such as white matter (WM)) and produce a stronger MR signal. Tissues that seem much darker on the image, therefore have longer longitudinal relaxation times (such as cerebro-spinal fluid (CSF)). T2-weighted images are produced using longer TE and TR. Therefore, tissue, such as WM, with a short T2 will appear dark on T2-weighted images, while CSF will appear bright on T2-weighted images.
1.3.2 Diffusion weighted imaging (DWI)
DWI is a variant of conventional MRI sensitive to diffusion of water protons. This technique is based on the molecular diffusion, or Brownian motion, referring to thermally driven random motion of water molecules (Soares, Marques, Alves, & Sousa, 2013; Hagmann et al., 2006). This movement is described by the diffusion coefficient, which also depends on the properties of the liquid, such as viscosity, molecular size and temperature. In an unrestricted environment, such as glass of water, the motion is completely random and only limited by the boundaries of the glass. However, biological tissue is a highly heterogeneous media, in which the random movement of molecules is impeded by compartmental boundaries and other molecular obstacles and thus restricted in various directions. The combination of these factors, produces measured signal changes that reflect the apparent diffusion coefficient (ADC) or mean diffusivity (MD) which can significantly differ from the diffusion coefficient of the unrestricted liquid (like in the glass of water).
DWI images are acquired by applying a diffusion sensitizing gradient that increases the strength of magnetic field evenly in one direction. The gradients are applied across large number of
33
different directions (minimum 6) to ensure a robust estimation of diffusion. For each direction, the first gradient pulse dephases the magnetization, and the second pulse rephases the magnetization. For stationary molecules, the second gradient will refocus the protons perfectly, resulting in maximally coherent magnetization and sampling of a high MRI signal. In case of a diffusion in the direction of applied gradient, the second gradient will cause a random phase shift resulting in an attenuation of the MRI signal. Thus the WM fiber tracts parallel to the gradient direction will appear dark on the DWI images in that direction (O’Donnell & Westin, 2011; Mori, & Zhang, 2006).
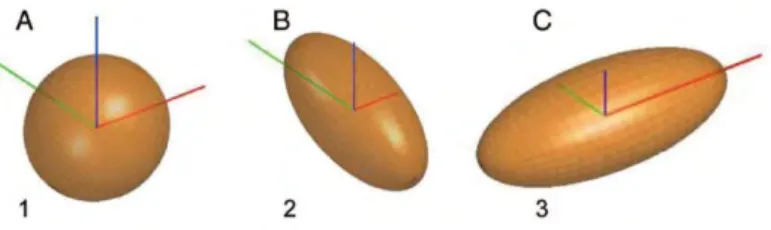
Diffusion tensor imaging is an extension of DWI which refers to a specific modelling of data, allowing the inference of directional dependencies of the diffusion signal, resulting in a 3D representation of the water molecule movement. The spatial dependence of the diffusion is characterized by a 3x3 matrix, called the diffusion tensor, that describes the diffusion along some combination of the 3 different spatial direction (x,y,z), assuming that the displacement distribution is Gaussian. The diffusion tensor is usually represented by an ellipsoid, where the axes represent three principal diffusion directions (eigenvectors – v1, v2, v3) and the corresponding diffusion magnitude (eigenvalues - λ1, λ2, λ3). Eigenvalues are ordered λ1>λ2>λ3, with an anisotropic diffusion (restricted diffusion) characterized by λ1≥λ2≥λ3 and isotropic diffusion by λ1~λ2~λ3 (Figure 1.3.1).
Figure 1.3.1. Three diffusion ellipsoids represent the diffusion profile of 3 different structures.
The axes represent the x- (left-right, red), y- (posterior-anterior, green), and z-(inferior-superior, blue) directions. (A) Isotropic diffusion ellipsoid, representing a region of cerebral spinal fluid. (B) Anisotropic diffusion ellipsoid, representing a white matter tract parallel to the y-axis (superior longitudinal fasciculus). (C) Anisotropic diffusion ellipsoid, representing a white matter tract parallel to the x-axis (corpus callosum. Reproduced from Feldman, Yeatman, Lee, Barde, & Gaman-Bean (2010).
The degree to which diffusion is directionally dependent can be expressed as the fractional anisotropy (FA), a parameter which is calculated comparing each eigenvalue with the mean of all the eigenvalues as in the following equation:
34
The values of FA range from 0 (isotropic) to 1 (anisotropic). In the brain white matter, diffusion is anisotropic as it greater along the axis of the axons and not across. Thus, DTI also allows fiber tracking that is reconstruction of major white matter tracts in the brain, which are made up of densely packed myelinated axons (high values of FA). One of these major tracts is the cingulum which nestles in the WM of the cingulate gyrus and will be mentioned in following chapters (Figure 1.3.2).
Figure 1.3.2. Major white matter structures of the human brain.
ACR, anterior corona radiata; ALIC, anterior limb of internal capsule; ATR, anterior thalamic radiation; CC, corpus callosum; CG, cingulum; CPT, corticopontine tract; CST, corticospinal tract; EC, external capsule; Fmajor, forceps major; Fminor, forceps minor; FX, fornix; GCC, genu corporis callosi; ILF, inferior longitudinal fasciculus; PLIC, posterior limb of internal capsule; PTR, posterior thalamic radiation; RLIC, retrolentricular part of internal capsule; SCC, splenium corporis callosi; SFO, superior fronto-occipital fasciculus; SLF, superior longitudinal fasciculus; SS, sagittal striatum; ST, stria terminalis; TAP, tapetum. Reproduced from Toga, Thompson, Mori, Amunts, & Zilles. (2006).
Other measures can be calculated such as mean diffusivity (λ1+λ2+λ3)/3), axial (longitudinal) diffusivity (λ1) that is the rate of diffusion in the direction that is parallel to the white matter, and radial diffusivity (λ2+λ3)/2) or perpendicular diffusivity to white matter.
More importantly, DWI/DTI is a sensitive (but non-specific) marker of neuropathology and microstructural architecture. The combination of described measures has received growing popularity in clinical diagnosis and characterization of various pathological process such as acute ischemic lesions (decrease in MD, increase in FA), inflammation and edema (increase in MD, decrease in FA), and demyelination/dysmyelination (increase MD, decrease FA, increase RD) (Alexander, Lee, Lazar, & Field, 2007).
35 1.3.3 Functional MRI (fMRI)
Functional magnetic resonance imaging (fMRI) measures the spontaneous (resting-state) or stimulus-driven fluctuation in the blood oxygenation level-dependent (BOLD) signal. The idea that changes in blood oxygenation could drive measurable signal changes in brain MR images was introduced by Ogawa and colleagues in 1990.
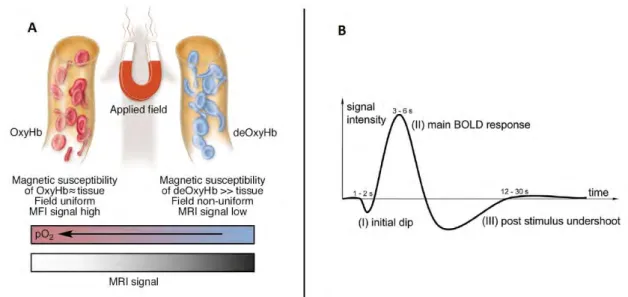
In brief, fMRI is based on the principle that an increase in neural activity in a brain region stimulates an increase in a local blood flow needed for a higher supply of oxygen and glucose. Consequently, there is a change in blood flow that exceeds the demand in the adjacent capillaries, resulting in an increase in the balance of the oxygenated arterial blood to deoxygenated venous blood (Gore, 2003). This phenomenon is called the hemodynamic response (Figure 1.3.3).
Oxygenated and deoxygenated hemoglobin present different magnetic attributes, therefore, the higher concentration of oxyhemoglobin in the venous compartment (and decreased deoxyhemoglobin) changes the paramagnetic properties of the tissue which can be detected during a T2* acquisition. An increase in blood oxygen concentration at capillary level will locally reduce magnetic field inhomogeneities leading to increased T2*-weighted signal.
Figure 1.3.3. A. Schematic illustration of the origins of the BOLD effect in fMRI. B. Illustration of the typical BOLD hemodynamic response function.
36 1.3.4 Resting-state fMRI (rs-fMRI)
RS-fMRI investigates synchronous activations between regions that are spatially distinct, without applying a task or a controlled stimulus (Lee, Smyser & Shimony, 2013). Rs-fMRI focuses on spontaneous low frequency fluctuations (<0.1 Hz) in the BOLD signal (Van Dijk et al., 2010). Relative to task-based fMRI, it requires minimal patient compliance, it can be acquired under anesthesia and it is well suited for difficult clinical populations such as Alzheimer’s disease or DOC patients (Fox & Greicius, 2010; Orringer, Vago, & Golbycole, 2012; Lee et al., 2013). Recently, there have been some advances in the application of rs-fMRI in prediction of individual differences (Calhoun, Lawrie, Mourao-Miranda, & Stephan, 2017; Dubois & Adolphs, 2016), which hold significant promise in obtaining diagnostic and prognostic information in a single subject, especially important in heterogeneous groups, such as the population of traumatic brain injury patients.
1.3.4.1 Rs-fMRI analysis methods
After image preprocessing steps, a number of methods can be applied in the analysis of the rs-fMRI data, each with its own inherent advantages and disadvantages.
The two main approaches to analyzing rs-fMRI are the: a) model-driven and b) the data-driven analysis (Cole, Smith, & Beckmann, 2010).
The first approach consists (Poldrack, 2007) of the a priori selection of a voxel, cluster or atlas region,from which to extract time series (i.e. BOLD signal) data which is then used to calculate whole-brain, seed-based, or voxel-wise functional connectivity maps of co-variance with the seed region (Cole et al., 2010).
The seed-based approach was used in the study of Biswal and colleagues (1995) in which the low-frequency coherent, spontaneous BOLD fluctuations were identified bilaterally in the somatomotor cortical regions, suggesting, for the first time, the functional importance of the resting-state activity. However, as described, this approach is hypothesis-driven, requiring a priori selection of ROIs based on the assumption of a functional dependency.
In contrast, the data-driven approach such as the independent component analysis (ICA) serves to estimate the component maps of maximal spatial independence (from each other) without the need for a prior selection of brain regions (Beckmann, DeLuca, Devlin, & Smith, 2005). Importantly, the application of seed-based and ICA analysis led to the identification of several resting-state networks (RSNs) representing spatially distant but functionally connected regions,