HAL Id: hal-01528018
https://hal-amu.archives-ouvertes.fr/hal-01528018
Submitted on 14 May 2018HAL is a multi-disciplinary open access archive for the deposit and dissemination of sci-entific research documents, whether they are pub-lished or not. The documents may come from teaching and research institutions in France or abroad, or from public or private research centers.
L’archive ouverte pluridisciplinaire HAL, est destinée au dépôt et à la diffusion de documents scientifiques de niveau recherche, publiés ou non, émanant des établissements d’enseignement et de recherche français ou étrangers, des laboratoires publics ou privés.
Simulations of atomic deuterium exposure in
self-damaged tungsten
E.A. Hodille, A Založnik, S Markelj, T. Schwarz-Selinger, C.S. Becquart,
Régis Bisson, Christian Grisolia
To cite this version:
E.A. Hodille, A Založnik, S Markelj, T. Schwarz-Selinger, C.S. Becquart, et al.. Simulations of atomic deuterium exposure in self-damaged tungsten. Nuclear Fusion, IOP Publishing, 2017, 57 (5), pp.056002. �10.1088/1741-4326/aa5aa5�. �hal-01528018�
1. Introduction
Due to its good mechanical and thermal properties, tung-sten (W) has been chosen to be the material constituting the divertor region in ITER. This region is the part of the tokamak which experiences the highest particle flux (1024 m−2 s−1)
making hydrogen isotope (HI) retention and outgassing from W a key consideration for safety and plasma control issues. During the deuterium/tritium phase in ITER, fast neutrons
(14.1 MeV) will be created. They can transmute the elements present in plasma-facing components (PFCs) [1] and they will also induce crystallographic defects that can change the HI trapping and release properties of all the materials facing the plasma. 14.1 MeV neutron sources are scarce and a hot cell facility is required to deal with neutron-irradiated samples. A good proxy to simulate the damage induced during neutron irradiations has been found in MeV heavy-ion implantations and especially MeV W ions [2], the latter irradiation resulting
Nuclear Fusion
Simulations of atomic deuterium exposure
in self-damaged tungsten
E.A. Hodille1, A. Založnik2, S. Markelj2, T. Schwarz-Selinger3,
C.S. Becquart4, R. Bisson5 and C. Grisolia1
1 CEA, IRFM, F-13108 Saint-Paul-lèz-Durance, France
2 Jožef Stefan Institute, Jamova cesta 39, 1000, Ljubljana, Slovenia
3 Max-Planck-Institut für Plasmaphysik, Boltzmannstrasse 2, D-85748 Garching, Germany 4 Université Lille I, UMET, UMR 8207, ENSCL, 59655 Villeneuve d’Ascq Cedex, France 5 Aix-Marseille Université, CNRS, PIIM, Marseille, France
E-mail: [email protected]
Received 1 September 2016, revised 12 December 2016 Accepted for publication 4 January 2017
Published 14 March 2017
Abstract
Simulations of deuterium (D) atom exposure in self-damaged polycrystalline tungsten at 500 K and 600 K are performed using an evolution of the MHIMS (migration of hydrogen isotopes in materials) code in which a model to describe the interaction of D with the surface is implemented. The surface-energy barriers for both temperatures are determined analytically with a steady-state analysis. The desorption energy per D atom from the surface is 0.69 ± 0.02 eV at 500 K and 0.87 ± 0.03 eV at 600 K. These values are in good agreement with ab initio calculations as well as experimental determination of desorption energies. The absorption energy (from the surface to the bulk) is 1.33 ± 0.04 eV at 500 K, 1.55 ± 0.02 eV at 600 K when assuming that the resurfacing energy (from the bulk to the surface) is 0.2 eV. Thermal-desorption spectrometry data after D atom exposure at 500 K and isothermal desorption at 600 K after D atom exposure at 600 K can be reproduced quantitatively with three bulk-detrapping energies, namely 1.65 ± 0.01 eV, 1.85 ± 0.03 eV and 2.06 ± 0.04 eV, in addition to the intrinsic detrapping energies known for undamaged tungsten (0.85 eV and 1.00 eV). Thanks to analyses of the amount of traps during annealing at different temperatures and ab initio calculations, the 1.65 eV detrapping energy is attributed to jogged dislocations and the 1.85 eV detrapping energy is attributed to dislocation loops. Finally, the 2.06 eV detrapping energy is attributed to D trapping in cavities based on literature reporting observations on the growth of cavities, even though this could also be understood as D desorbing from the C-D bond in the case of hydrocarbon contamination in the experimental sample.
Keywords: tungsten, damaged material, rate-equation modeling, deuterium atoms, fuel retention
(Some figures may appear in colour only in the online journal) E.A. Hodille et al
Printed in the UK 056002 NUFUAU © 2017 CEA 57 Nucl. Fusion NF 10.1088/1741-4326/aa5aa5
Paper
5 Nuclear Fusion IOPInternational Atomic Energy Agency
2017
1741-4326
https://doi.org/10.1088/1741-4326/aa5aa5 Nucl. Fusion 57 (2017) 056002 (15pp)
in so-called self-damaged W samples. The interaction of HIs with self-damaged W has been extensively studied exper-imentally, particularly in relation to their retention properties [3–8]. These studies show that the D retention in such mat-erials is significantly higher than in undamaged W. In addi-tion, by analyzing thermal-desorption spectrometry (TDS) results, it has been observed that D is released at a far higher temper ature in the case of self-damaged W than in the case of undamaged W [8].
In this study, the MHIMS (migration of hydrogen isotopes in metals) [9] code, which is based on a macroscopic rate-equation (MRE) model that couples both diffusion and trap-ping of HIs, has been upgraded to simulate the experimental results presented in [6, 7]. In these two experimental studies, self-damaged polycrystalline W (PCW) samples were exposed to a beam of deuterium (D) atoms with a low kinetic energy of ~0.3 eV. With such a low kinetic energy, D atoms may not directly reach the bulk and be implanted as they would be in the case of energetic D ions. Instead, they are first adsorbed on the W surface [10, 11]. In order to include this kind of events in simulations, a surface model needs to be built, and one of the goals of this paper is to describe the implementation of such a model in the MHIMS code. The article is organized as follows. First, the model and its main features are described, and then the procedure adopted to determine the different energy barriers at the surface is detailed. Finally, the simula-tion results obtained using the upgraded version of MHIMS are compared to the experimental studies and discussed. 2. Simulation of the experimental results
2.1. Model description
In this paper, the MHIMS code that was previously used to determine the trapping parameters of HIs in undamaged PCW irradiated with D ions [9] was upgraded to simulate the two experiments presented in [6, 7]. In the version of the code pre-sented in [9], no surface effects were taken into account since TDS experiments showed that surface recombination was not the rate-limiting process in the desorption from undamaged PCW implanted with 250 eV/D ions [12]. However, exper-imental results by ‘t Hoen et al [10] showed that the inser-tion of low energetic ions (<5 eV/D) is limited by the surface process. Such results were confirmed by molecular dynamics (MD) simulations of D on the W surface by Maya [11]. In these simulations, it was shown that atoms with energy below 1 eV/D do not penetrate beneath the surface, but are instead stuck on it. Thus, the 0.3 eV/D atoms used in [6, 7] should not be directly implanted into the bulk, but instead should be first adsorbed on the surface. To simulate such exposure con-ditions, a model describing the different surface processes has been added to the standard version of the MHIMS code.
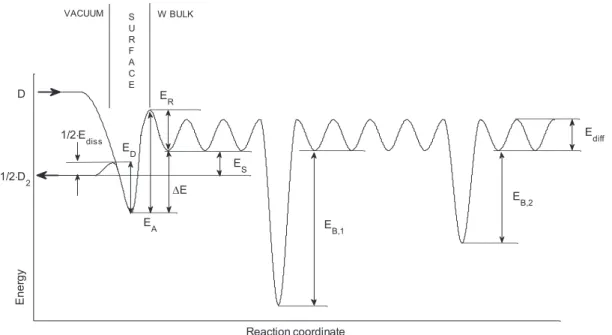
The model for surface and bulk interaction between HIs and W can be described with the idealized interaction potential diagram drawn in figure 1 [13, 14]. Here, 1E
2 diss is the energy
barrier per D atom associated to the dissociative adsorp-tion of D2 molecules impinging from the energy level 12D2.
The upper-vacuum energy-level D corresponds to the one of impinging D atoms. Noth these energy levels are thus sepa-rated by half the D2 dissociation energy 12ED D− . The
activa-tion energy for desorpactiva-tion Edes represents the energy needed to
form a desorbing D2 molecule from two chemisorbed D atoms
and can be written as Edes= ⋅2 ED where ED is the desorption
energy per D atom [14]. This quantity should not be mistaken with the chemisorption energy (Echem) or the isosteric heat of
adsorption (qst) which are equal to Edes−Ediss, nor the bond
energy of D atoms on the surface (EW–D), which is defined
as the energy difference between the vacuum energy level of the impinging D and the energy level of D at the bottom of the surface chemisorption well. According to Pick et al [14], the solution energy is defined as the difference between the molecular vacuum energy level and the atomic-bulk adsorp-tion well, i.e. ES=EA−ED+ ⋅12 Ediss−ER (figure 1), where
EA is the energy needed for an adsorbed D to enter the bulk
(absorption energy) and ER is the energy needed for an
absorbed D to go from the bulk to the surface (resurfacing energy). Finally, Ediff is the energy barrier for D diffusion in
the bulk and EB,i is the binding energy of D with a trap of type ii (in figure 1, i=1, 2 ).
To build the model, three kinds of particles (i.e. HIs) are considered:
1. Particles adsorbed on the surface: concentration csurf.
(m−2).
2. Mobile particles that can diffuse in the bulk: concentration
cm. (m−3).
3. Particles trapped in the bulk: concentration ct,i. (m−3).
Several types of traps exist, characterized by their index i. The finite amount of sites that can accommodate HIs are of three kinds:
1. Adsorption sites on the surface: concentration nsurf (m−2).
2. Interstitial sites in the bulk: concentration nTIS (m−3).
Indeed, density functional theory (DFT) calculations show that interstitial HIs diffuse from tetrahedral intersti-tial sites (TIS) [15] to nearest-neighbor TIS.
3. Trapping sites in the bulk: concentration ni (m−3).
As shown above, all bulk concentrations are in m−3 in
the model. However, in experimental results these are often expressed in terms of percentage of atomic fraction (at.%) by normalizing concentrations to the W atomic density
ρ ≈6.3×10 m−
W 28 3. Thus, in the simulation results shown
here, the concentration will also sometimes be expressed in at.%.
In the following, it is supposed that the amount of traps is small compared to the amount of possible sites for the mobile particles (ni nTIS). Thus, each trap site is surrounded
by only TIS and a HI leaving a trap cannot be immediately retrapped in another trap. In addition, it is considered that the concentration of mobile particles is much smaller than the concentration of TIS (cm nTIS). Thus, among all the TIS that
surround a trapping site, there is at least one of them that is empty. This hypothesis is always valid for the parameter range encountered in laboratory experiments. Following these two
hypotheses, the evolution of the concentration of trapped and mobile particles in the bulk can be defined by the following commonly used set of equations [16]:
( ) ∂ ∂ = ⋅ ∂ ∂ − Σ ∂ ∂ c t D T c x c t i m 2 m 2 t, (1) ( ) ( ) ( ) ν ν ∂ ∂ = ⋅ ⋅ − − ⋅ c t T c n c T c . i i i t, m m i t, i t, (2) The first term on the right-hand side of equation (1) is derived from Fick’s law of diffusion and is characterized by the dif-fusion coefficient of HIs in W, D T( ) =D0⋅e− ⋅
E
k TBdiff, (m2 s−1)
where k =8.6×10 eV K− ⋅ −
B 5 1 is the Boltzmann constant, T
(K) is the sample temperature and Ediff (eV) is the energy
barrier for diffusion (figure 1). For this study, the diffusion coefficient for hydrogen calculated using DFT by Fernandez
et al [15] is used: D TH( ) =1.9×10⁻⁷⋅e−0.2 eVk TB⋅ m s2⋅ −1. The
diffusion coefficient of D is equal to D TH( ) divided by 2,
the square root of the atomic mass ratio between D and H. The second term on the right-hand side of equation (1) cor-responds to the exchange (trapping and detrapping) between mobile and trapped particles that is described by equation (2) for trap type i. In equation (2), the first term of the right-hand side corresponds to the trapping of mobile particles into an empty trap site (ni−ct,i). This process is characterized
by the rate ν ( )T = D T( )⋅λ
n m
TIS 2 (m
3 s−1) where λ is the distance
between 2 TIS or the jumping distance. This can be estimated to be λ ≈110×10−12 m from ab initio calculations [15]. The
second term of equation (2) corresponds to the detrapping of a trapped particle. This process is characterized by the rate
( ) ν T =ν ⋅e− ⋅ i 0 E i k T t,
B (s−1) where Et,i=EB,i+Ediff. (eV) is the
detrapping energy of trap site i and ν0 is a pre-exponential
factor. The value of the pre-exponential factor is important to know (at least its order of magnitude). Indeed, a change
of one order of magnitude on this pre-exponential factor will lead to a change of ≈kB⋅ ⋅T ln 10( ) on the determination of
the detrapping energy. For the simulation of a TDS experi-ment done between 300 K and 1300 K, the corresponding error would be between 0.05 and 0.25 eV. According to first-principles calculations [15], the pre-exponential factor for detrapping of H from a W mono-vacancy is ν ≈10 s−
0 13 1 and
this is the order of magnitude which is used for several MRE simulations [5, 9] and which is used for this work too.
The model for the surface, acting as boundary conditions for the global MRE model, is described by the evolution of
( = )
c xm 0 and csurf. The surface coverage is θ = cnsurf
surf. This
defines the amount of adsorption sites that are occupied: (1−θ) is the probability that an adsorption site is empty. The evolutions of the two quantities c xm( =0) and csurf are driven by different
fluxes (m−2 s−1) which are described hereafter (see figure 2):
Figure 1. Idealized potential diagram describing the interaction of HIs with W at the surface (interface between the vacuum and the metal) and in the bulk.
Figure 2. Explicative scheme of the flux balance on the surface. Blue solid arrows correspond to flux of atoms and green dashed arrows correspond to flux of molecules.
– φatom=(1−Pr)⋅ Γatom⋅(1−θ). This corresponds to the
part of the incident flux of atoms Γatom (m−2 s−1) adsorbed
on the surface. The term 1−θ implies that a fully cov-ered surface prevents any incoming D atoms from being adsorbed. (1− Pr) is the sticking probability. According
to MD simulations [17, 18] the sticking coefficient of a 0.3 eV D atom on a pristine W surface is (1−Pr)=0.19
which is the value used in the equation (Pr is not a free
parameter) and is also in good agreement with the value determined experimentally [6].
– φexc= Γatom⋅σexc⋅ c surf. This corresponds to direct
abstraction of a chemisorbed D, i.e. the recombination of an incident D atom with an adsorbed atom on the sur-face [6] which is characterized by the cross-section σexc
(m2). The value of σ
exc. that is used in this work is the
one determined in [6] to reproduce an isotopic exchange experiment on the surface: σ ≈10− m
exc 21 2 (σexc is not a
free parameter).
– φdesorb= ⋅2 νd( )T ⋅csurf2 . This corresponds to desorption
of D atoms from the surface as molecules. The desorption rate constant is ν( )T =ν λ⋅ ⋅e− ⋅⋅ d 0d des2 E k T 2 D B (m2 s−1) where
ν0d is the frequency associated to desorption and λdes (m)
is the jumping distance between two surface-adsorption sites. This can be estimated to be λdes= n1
surf.
– φbulk→surf=νsb( )T ⋅csurf. This corresponds to the
absorption of a D adatom from the surface to the bulk (with the assumption of low mobile concentration). The absorption rate constant is ν ( )T =ν ⋅e− ⋅
sb 0sb
E
k TBA (s−1) with
ν0sb the frequency associated to absorption.
– φbulk→surf=νbs( )T ⋅c xm( =0) (⋅ 1−θ). This
corre-sponds to the release of a D atom from the bulk to the surface (resurfacing). The surface becomes inactive once it is fully covered by D atoms (1− =θ 0). The rate con-stant for this process is ν ( )T =ν ⋅λ ⋅e− ⋅
bs 0bs abs
E
k TBR (m1 s−1)
with ν0bs the frequency associated to resurfacing and λabs
(m) the jumping distance between the first TIS that the HI encounters in the bulk and the adsorption site. It can be estimated to be λ =abs nnsurf
TIS. – φ = − ( )⋅
( )
∂∂ = D T c x x diff 0m . This corresponds to the
diffu-sion of the absorbed D atom from the first bulk TIS below the surface (x=0) to deeper in the bulk (x>0).
Regarding the pre-exponential factor, the same remark as for the detrapping process applies here: a change of one order of magnitude can affect the value of the different energies (EA,
ED and ER) by about 0.1 eV for exposure at 500 K and 600 K. According to different authors [6, 19, 20], the pre-exponential factor for desorption used to reproduce experimental measure-ments is 0.01 cm s2⋅ −1>λ ⋅ν > 0.001 cm s ⋅ −
des 2
0
d 2 1. A value
of λdes of the order of 0.2 nm (~interatomic distance in the W
lattice) and ν =10 s− 0 d 13 1 leads to λ ⋅ν =0.004 cm s⋅ − des 2 0 d 2 1. As a consequence, it is assumed ν =10 s− 0 d 13 1. It is also assumed that ν =ν =10 s− 0 sb 0
bs 13 1, which is the order of magnitude of
what is calculated with the harmonic transition-state theory for these adsorption and resurfacing processes [21].
The evolution of c xm( =0) and csurf is then described by the
balance of fluxes (figure 2) as follows:
→ →
φ φ φ φ φ
∂
∂t = − − − +
csurf
atom exc desorb surf bulk bulk surf
(3) → → ⎜ ⎟ ⎛ ⎝ ⎞⎠ λ⋅ ∂ φ φ φ ∂ = = − − c t x . m
0 surf bulk bulk surf diff
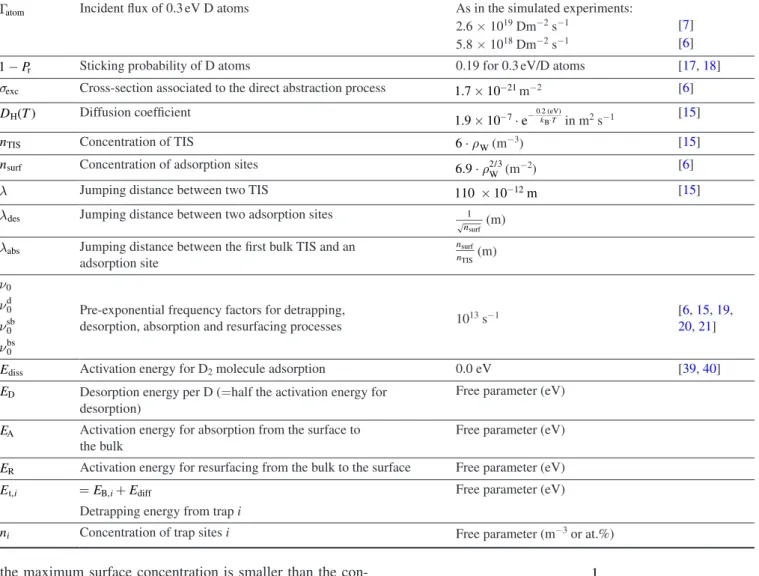
(4) The different parameters of the surface and bulk models are summarized in table 1. The values used for the non-free parameters are also given in table 1. The parameters that need to be determined are called ‘free’ parameters.
2.2. Steady-state analysis and determination of surface-energy barriers
Equations (1) and (2) give a general description of the model in the bulk and equations (3) and (4) describe the model for the surface. This set of equations are solved numerically using the code to simulate the experimental results (sections 2.3 and 2.4). Before going into the details of the simulations, a steady-state analysis and a simplified model is presented in this sec-tion that intends to define a strategy which will allow us to determine the surface-energy barriers.
In order to understand the main features of the model, the steady states of equations (3) and (4) are investigated when
= ∂ ∂ 0 c t surf and
( )
∂ = ∂ = 0 c t x 0m . In addition, it is considered that
the diffusive flux of particles from the sub-surface to the bulk
φdiff is negligible (i.e.
( )
∂∂ == 0
c x x 0
m ) in order to simplify
the approach. It can be shown by simulation that this flux is, indeed, not dominant. The steady-state regime is charac-terized by constant values of c xm( =0) and csurf (and so θ.)
written as cmeq, csurfeq and θeq.
Following this assumption, a relation between c xm( =0)
and csurf can be derived from equation (4) in the steady state:
( ) ν ( )( ) ν θ = = ⋅ − c x T T c 0 1 . m eq sb bs surf eq eq (5) Using this relation in equation (3) in the steady state, with
θ =eq cnsurfeq
surf and assuming =
∂
∂ 0
c t
surf , we have the following
relation:
( ) ( ) ω ω
− ⋅2 v Td ⋅ csurfeq 2− 1⋅csurfeq + 2=0
(6) with ω1= Γatom⋅
(
(1n− Pr)+σexc)
surf and ω =2 (1−Pr)⋅ Γatom.
These quantities are introduced only to simplify the notations. By solving equation (6), the value of csurfeq can be calculated:
ω ν ω ω ν = + ⋅ ⋅ − ⋅ c T T 8 4 . surf eq 12 d 2 1 d ( ) ( ) (7) If v Td( ) →0 (no desorption of molecules) or Γatom→∞
(high flux), the surface concentration is c →c∞ = surf eq surf = ⋅ ω ω σ − − + ⋅ n P P n surf 1 1 2 1 r
r exc surf. If σ = 0exc (no abstraction), this
the maximum surface concentration is smaller than the con-centration of surface sites nsurf depending on the efficiency of
the direct abstraction.
According to equation (5), the steady-state concentration of mobile particles c xmeq( =0) depends on the surface
concentra-tion and on the competiconcentra-tion between absorpconcentra-tion of HI atoms from the surface to the bulk and resurfacing of HI atoms from the bulk to the surface: the value of cmeq does not depend on the values of EA and ER. but on the difference ∆ =E EA−ER
since νν ( )( )T = λ ⋅e−( −⋅ ) T 1 E E k T sb bs abs A R
B . However, the values of EA and ER
have an impact on the kinetics to reach this equilibrium. According to equation (7), the steady-state concentration of HIs csurfeq on the surface depends only on the desorption energy per D atom ED and on the flux of atoms. Using both
equations (5) and (7), each couple of (∆E, ED) leads to a direct
and unique equivalence between the incident flux of atoms Γatom
and the concentration of mobile atoms below the surface cmeq. After looking at the steady-state equations describing the W/HI interactions at the surface, one can look at the steady state of equation (2), which describes the kinetic equilibrium between mobile and trapped particles in the bulk. In the steady-state, the equilibrium concentration of trapped particle ct,eqi in trap i can be expressed as follows: ceqt,i=Rtrap,i(T c, m)⋅ni with
( ) ( ) = +νν ⋅ R 1 1 . i T T c trap, i m m (8) The equilibrium ratio defined in equation (8) exhibits compe-tition between detrapping and trapping processes described by the characteristic detrapping time ν T( )1
i and the characteristic trapping time ν ( )T1⋅c
m m, respectively. If the trapping process
is faster than the detrapping process (νm( )T ⋅cm νi), Rtrap,i
will be close to 1 and almost all the traps will be filled. This is the case for low temperature (small ν Ti( )) or high flux (high
cm) exposure. Indeed, equations (5) and (7) show that a simple
equivalence between the flux of particles and the concentra-tion of mobile particles can be established and the concen-tration of mobile particles just beneath the surface increases with the atom flux Γatom. Due to the diffusion, the mobile
par-ticles that are inserted just beneath the surface migrate to the bulk making c xm( =0), the maximum of the concentration
of mobile particles. This concentration of mobile particles is called cmMAX=c xmeq( =0) in the steady state of equations (3)
and (4). To characterize the migration of mobile particles into the bulk from a surface source of mobile particles (described by cmMAX) a simple analytical model can be used, as first Table 1. Summary of the parameters used in the bulk and surface models.
Γatom Incident flux of 0.3 eV D atoms As in the simulated experiments:
2.6 × 10¹⁹ Dm−2 s−1 [7]
5.8 × 10¹⁸ Dm−2 s−1 [6] − P
1 r Sticking probability of D atoms 0.19 for 0.3 eV/D atoms [17, 18]
σexc Cross-section associated to the direct abstraction process 1.7×10⁻²¹ m−2 [6]
D TH( ) Diffusion coefficient 1.9×10⁻⁷⋅e−k T⋅
0.2 eV B
( )
in m2 s−1 [15]
nTIS Concentration of TIS 6⋅ρW (m−3) [15]
nsurf Concentration of adsorption sites 6.9⋅ρW2 3/ (m−2) [6]
λ Jumping distance between two TIS 110 ×10−12 m [15]
λdes Jumping distance between two adsorption sites
n
1
surf (m)
λabs Jumping distance between the first bulk TIS and an
adsorption site n n surf TIS (m) ν0
Pre-exponential frequency factors for detrapping,
desorption, absorption and resurfacing processes 1013 s−1
[6, 15, 19, 20, 21]
ν0d
νsb0
ν0bs
Ediss Activation energy for D2 molecule adsorption 0.0 eV [39, 40]
ED Desorption energy per D (=half the activation energy for
desorption)
Free parameter (eV)
EA Activation energy for absorption from the surface to
the bulk
Free parameter (eV)
ER Activation energy for resurfacing from the bulk to the surface Free parameter (eV)
Et,i =EB,i+Ediff Free parameter (eV)
Detrapping energy from trap i
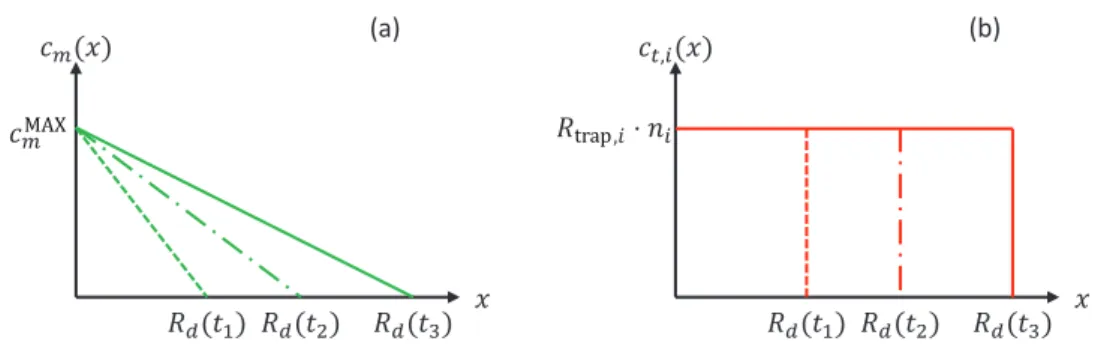
reported by Schmid et al [22], to understand the time evo-lution of the outgassing flux of molecules after the implant-ation of D ions. In this model, the evolution of the profile of mobile particles for three different times t1< <t2 t3 can be
described as a gradient from the source to the migration depth
( )
R td at each time ti=1,2,3 (figure 3(a)). Assuming that, for the
considered trap, Rtrap,i(T c, m) ≈1, then Rtrap,i evolves weakly
with cm. We then assume that Rtrap,i(T c, MAXm )≈Rtrap,i(T c, m).
In this case, the profile of trapped particles can be defined by figure 3(b). The quantity of particles that are trapped in any of the traps considered after an exposure of t time is:
( )t =R t( )⋅
∑
R (T c )⋅nTot d , .
i
i i
trap trap, mMAX
In this interpretation, the D inventory in the material is understood as a succession of layers with a constant concen-tration ΣiRtrap,i(T c, mMAX)⋅ni that pile up to the depth R td( )
when the exposure time t increases, as suggested by Grisolia
et al [23] who used a similar interpretation to describe the D inventory growth in Tore Supra plasma-facing components.
The traps are filled by the flux of particles φbulk=
( ) ( )
φ =D T ⋅c
R t
diff m
MAX
d diffusing from the surface to the bulk:
( ) ( )
∑
φ = = ⋅ ⋅ t R t R T c n dTot d d d , . d t i i i bulk trap trap, mMAXFrom this formula, it can be written
( ) ( ) ( ) ( )
∑
⋅ = ⋅ ⋅ ⋅ R t R t D T c R T c n t d , d . i i i d d m MAX trap, mMAXFinally, the evolution of the migration depth with time in this crude model is described by equation (9):
( ) ( ) ( )
∑
= ⋅ ⋅ ⋅ ⋅ R t D T c R T c n t 2 , . i i i d m MAX trap, mMAX (9) With the steady-state equations (5) and (7) and the rela-tion derived from the simple model equarela-tion (9), the different energy barriers at the surface can be estimated based on exper-imental observations. The method can be described as follows. First, if the surface concentration csurf can be deduced fromnuclear reaction analysis (NRA), depth profile analysis or elastic recoil detection analysis (ERDA) measurements [6], and assuming that it corresponds to csurfeq , the value of ED can
be calculated with equation (7). nsurf is also needed. It can be
obtained by loading atoms on the surface at low temper ature, which would likely saturate any adsorption sites. In [6], a self-damaged W sample of a different grade has been exposed to D atoms at 380 K. The D surface areal density, measured by ERDA, was found to be ±11 1.5×10 D m19 ⋅ −2. For
our analysis, we consider this value to be a good approx-imation of nsurf. It should be noted that with this value,
( ) ρ /
≈ ± ×
nsurf 6.9 1 W2 3, which means that there are 6.9
adsorption sites per W atom on the surface. The maximum surface coverage on a clean, flat (1 1 0) surface has been experimentally determined to be two monolayers (only two adsorption sites per W atoms) at 180 K [24]. However, in the experiments we are modelling, the W surfaces are not clean single crystals (1 1 0), but polycrystalline samples exposing a large variety of grain cuts that may show numerous adsorption sites due to the self-damaging. Indeed, it has been shown by Markelj et al [20] that the D surface areal density measured by ERDA at low temperature (below 380 K) is much higher on damaged W (11±1.5×10 D m19 ⋅ −2) than on undamaged W
(6.8±0.6×10 D m19 ⋅ −2). It should be pointed out that if it is
considered that n = 6.8×10 D m⋅ −
surf 19 2, this would imply a
shift of only 0.01 eV on the determination of the value of ED.
Second, from the experimental depth profile, values of R td exposure( ) and ΣiRtrap,i⋅ni are collected. The quantity
ΣiRtrap,i⋅ni is close to the observed concentration of D since
the mobile particle concentration is always small (no infor-mation on the trap concentrations or detrapping energies is needed). Using these two quantities cmMAX can be determined using equation (9).
Finally, by equalizing c xmeq( =0) given by equation (5) and
cmMAX calculated thanks to equation (9), the value of ∆E can be extracted. This procedure allows us to determine the dif-ference in energy barriers at the surface/bulk interface ana-lytically and this procedure will be used for both exposure temperatures 500 K and 600 K. Thus, in the simulation, only the bulk detrapping energies and the trap densities remain to be determined to reproduce the isothermal desorption, the depth profile and the TDS spectra.
2.3. Simulation of D atom implantation at 500 K
The upgraded version of MHIMS is used to simulate experi-ments published by Zaloznik et al [7]. In this study, recrys-tallized PCW (2000 K/2 min) was used. The samples were Figure 3. (a) Evolution of mobile particle during atomic exposure at three times t1, t2 and t3 using the approximated model. (b) Evolution of
exposed to 20 MeV W6+ ions at room temperature and at a
fluence of 7.8 × 10¹⁷ Dm−2. The projected range of the W
ions was calculated to be 1.5 µm, the thickness of the
dam-aged layer was calculated to be 2.4 µm and the irradiation
dose at the damage peak was calculated in [7] to be 0.5 dpa (displacement per atom) by evaluating the vacancy.txt output from the full cascade option of the SRIM 2013 software and a displacement energy of 90 eV [25]. After W damaging, the samples were annealed in vacuum for 1 h at different temper-atures from 600 K and 1200 K except for one sample which was not annealed. Then, they were exposed at 500 K to a D atom beam with a thermal energy of ~0.3 eV and a flux of 2.6 × 10¹⁹ Dm−2 s−1 for 144 h which corresponds to a fluence
of 1.3 × 1025 Dm−2. The samples were finally analyzed by
NRA and TDS with a heating ramp of 0.25 K s−1.
First, before simulating the experimental results, energy barriers at the surface–bulk interface (EA, ED and ER) in
vacuum were determined using the two procedures described in the previous section.
For the determination of ED, no data on the surface
con-centration has been reported after exposure at 500 K in [7]. However, in situ ERDA measurements of self-damaged W exposed to 0.3 eV/D atoms were obtained by the same group for a slightly lower temperature of 480 K and with a flux of 6.3 × 10¹⁸ Dm−2 s−1 [6]. These differences in temperature
and flux tend to compensate each other and so experiments in [6, 7] should have very similar steady-state coverage. In [6], it was measured that the surface areal density in the steady state reached 3(±0.5) × 1019 Dm−2. Using equation (7) derived
from the steady-state approach presented in section 2.2, it was determined that, in order to have this value of csurfeq , one needs
= ±
ED 0.69 0.02 eV (figure 4(a)). The uncertainties are
eval-uated by taking the extrema of the experimental values of the surface areal density.
Regarding the value of ∆ =E EA−ER, we use the experimental D depth profile (figure 5(a)) in the non-annealed case, after 144 h of D atomic exposure at 500 K where the value of Rd(144 h, 500 K ) is 2 ± 0.3 µm with
Figure 4. (a) Green solid line: evolution of csurfeq with E
D (equation (7)) at 480 K, Γatom=6.3×10 D m18 ⋅ −2⋅s−1, blue dashed line:
experimentally measured (ERDA) value of csurf [6] in the same conditions. (b) Green solid line: evolution of csurfeq with ED (equation (7)) at
600 K, Γ =5.8×10 D m⋅ − ⋅s−
atom 18 2 1, blue dashed line: value determined from experimental depth profiles [6].
Figure 5. (a) Comparison between simulation and experimental D depth profiles obtained after a 144 h D atom exposure on self-damaged W sample with a flux of 2.6×10 D m19 ⋅ −2⋅s−1 at 500 K. (b) Comparison between simulated and experimental TDS spectra obtained after
the same D atom exposure. The heating ramp is 0.25 K s−1. For the sake of clarity, only the results for un-annealed, 800 K-annealed and
ΣiRtrap,i⋅ni ≈ 0.3±0.1 at.%: using equation (9) we get
= ± × −
cmMAX(500 K) 1( 0.6) 10 at.%9 . The uncertainties are
evaluated by taking the extrema of the value of Rd(144 h, 500 K )
and ΣiRtrap,i⋅ni.
Using equation (5), it is finally determined that,
∆ =E 1.13±0.04 eV at 500 K. It is assumed that the energy barrier to go from bulk to surface ER is roughly the migration
energy of H in the bulk, as shown by several DFT calcul ations [26, 27], i.e. ER=0.2 eV. In this case, the energy barrier
required to go from surface to bulk is EA=1.33±0.04 eV.
The uncertainties are evaluated by taking the extrema of the determined value of ED and cmMAX(500 K).
Therefore, in the simulation, the following values for the energy barriers are used: ED=0.69 eV, ER=0.2 eV and
=
EA 1.33 eV.
Now, we turn to the determination of the bulk quantities using the D depth profile and TDS experiments. The simula-tion is composed of four phases, as in the experimental proce-dures. It begins through the simulation of D atomic exposure at 500 K for 144 h (the flux is Γatom = 2.6 × 10¹⁹ Dm−2 s−1).
Then, the temperature is decreased within 30 min, from 500 K to 300 K. In order to simulate the storage time, the temper ature is kept constant at 300 K for around 8 h. Then, the temper ature is increased from 300 K to 1300 K with a heating rate sim-ilar to the ramp used in the experiment: at high temperature (above ~700 K) the heating ramp is around 0.25 K s−1, but at
the beginning of the TDS, the temperature does not evolve truly linearly.
According to our previous simulations, two HI traps exist intrinsically in undamaged PCW. They are called ‘trap 1’ and ‘trap 2’ and their detrapping energies, respectively Et,1
and Et,2, have been extracted from TDS simulations [9]: =
Et,1 0.85 eV and Et,2=1.00 eV. In [9]. An additional
extrinsic trap was found in order to account for traps induced by implantation of D ions. In the simulations presented in the present paper, the extrinsic traps are not necessary since D atomic exposure will not induce such traps. The total concen-trations of the two intrinsic traps (i.e. the concentration in all the material, not only in the damaged zone) are around 0.01 at.% according to NRA results obtained using a recrystallized sample from the same material at 320 K [28]. In the simula-tion, during the atomic exposure, c ≈2.9×10 D m⋅ −
surf
eq 19 2
and c ≈ ×1 10 at.%− m
MAX 9 . If the equilibrium ratio given by
equation (8) is calculated for these two traps, at 500 K one can obtain ( ) ( ) = × = × − − R c R c 500 K, 1 10 500 K, 2 10 . trap,1 mMAX 5 trap,2 mMAX 4
Consequently, since the exposure is done at high temperature (500 K), these two traps will retain very few D, as explained in [9].
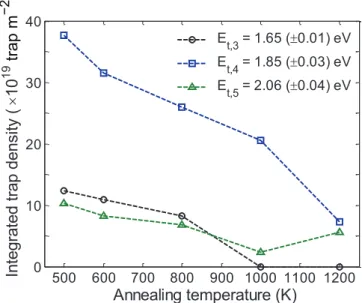
Figure 5 shows the simulation results (depth profile (a) and TDS spectra (b)) for the self-damaged PCW samples in the non-annealed case, the 800 K-annealed case and the 1200 K-annealed case. In order to reproduce the experimental TDS spectra from [7] (figure 5(b)), three new traps have to be introduced into the model. The detrapping energies for these three traps are Et,3=1.65±0.01 eV, Et,4=1.85±0.03 eV
and Et,5=2.06±0.04 eV. They will be referred to in the
following as ‘trap 3’, ‘trap 4’ and ‘trap 5’, respectively. Experimental depth profiles show a nearly uniform concentra-tion of D up to about 1.5 µm for the non-annealed sample and
up to about 2.5 µm (the entire thickness of the damage layer)
for the 1200 K-annealed case. Thus, in order to reproduce the NRA depth profile (figure 5(a)), a uniform concentration for trap 3, trap 4 and trap 5 (values summarized in table 2) is con-sidered in the damaged layer up to a depth of around 2.2 µm.
This assumption is strengthened by the scanning transmis-sion electron microscopy (STEM) images of the damage layer obtained on lamellae cut perpendicularly to the sample surface using the focused ion-beam techniques: these images show a homogeneous distribution of the radiation defects through the entire damaged layer [7] that decreases between 2.2 µm and
2.4 µm. It has to be noted that non-uniform distributions were
firstly tested in the simulations (based on SRIM distribution). No effect has been seen on the simulated TDS spectra, but the simulated depth profiles were not matching.
The experimental TDS spectra (figure 5(b)) exhibit a pre-dominant D desorption peak at 875 K, a desorption tail at high temperature up to 1100 K for all annealing cases and a smaller peak at 720 K for the non-annealed and 600 K-annealed case (not shown on figure 5(b)). This observation suggests the presence of at least three different detrapping energies. Note that the three desorption temperatures are more visible on the HD signal, which exhibits three well defined peaks. These three desorption temperatures explain why three detrapping energies have to be introduced. Thus, the experimental TDS spectra are well reproduced, especially the main peak at 875 K (detrapping from trap 4) and the high-temperature shoulder (detrapping from trap 5). Due to the presence of trap 3, a Table 2. Concentration of trap 3, trap 4 and trap 5 created by the self-damaging for the different annealing case simulated.
Annealing case Trap 3 (jogged dislocation line) Et,4=1.65±0.01 eV (at.%)
Trap 4 (dislocation loop)
= ±
Et,5 1.85 0.03 eV
(at.%) Trap 5 (cavity) Et,6=2.06±0.04 eV (at.%)
No annealing 0.09 0.28 0.08
1 h at 600 K 0.08 0.23 0.06
1 h at 800 K 0.06 0.19 0.05
1 h at 1000 K 0.00 0.15 0.02
low-temperature shoulder appears that is slightly more pro-nounced in our simulation than experimentally. The presence of trap 3, however, is necessary in our simulations because otherwise the low-temperature shoulder (observed exper-imentally) would not appear in the simulations. Moreover, it will be shown in section 2.4 that trap 3 is also necessary to reproduce isothermal desorption at 600 K.
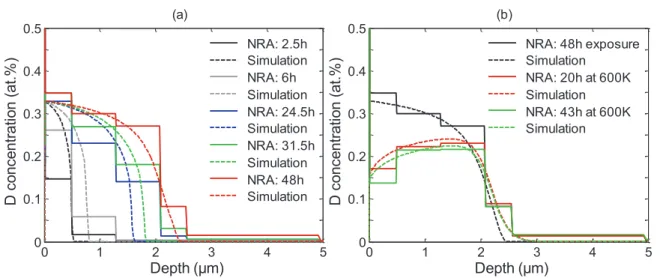
2.4. Simulation of D atom implantation at 600 K
MHIMS is also used to simulate complementary experimental results published by Markelj et al [6]. In this paper, the sample preparation and the self-damaging were identical to the work of Zaloznik et al [7]. D atom exposure was performed with an average flux of 5.8 × 10¹⁸ Dm−2 s−1 at 600 K. The NRA
D depth profiles were recorded in situ during the exposure and the maximum D atom exposure time was 48 h which cor-responds to a fluence of 1024 Dm−2. After the D atom
expo-sure, the sample was cooled down to room temperature and re-heated and maintained at 600 K to investigate isothermal outgassing.
As for the simulation of atomic exposure at 500 K, before simulating the exposure and isothermal outgassing, the energy barriers in the vicinity of the surface were firstly estimated using the steady-state equations (5), (7) and (9).
According to the experimental D depth profile from figure 6(a) after 2.5 h of exposure at 600 K, the part of D retained in the bulk, excluding the first point at 0 µm, was ≈ − ×5 6 10 D m19 ⋅ −2. Furthermore, the integrated amount
of D, including the first point at 0 µm that should represent the
D on the surface, was recorded to be ≈ − ×8 9 10 D m19 ⋅ −2
after 2.5 h of exposure at 600 K. It could then be considered that during the atom exposure the surface concentration reaches
( )3± ×1 10 D m19 ⋅ −2. Equation (7), derived from the
steady-state approach presented in section 2.2, shows that in order to reach this value of csurfeq , ED=0.87±0.03 eV (figure 4(b)).
The uncertainties were evaluated by taking the extrema of the experimental values of the surface concentration.
According to the experimental D depth profiles, after 48 h of D atomic exposure at 600 K (figure 2 in [6]) the value of Rd(48 h, 600 K ). can be estimated between 2 µm and
2.2 µm with ΣiRtrap,i⋅ ≈ni 0.325 at.%. Equation (9) then gives
( )
= ± × −
cmMAX 1.4 0.1 10 at.%9 . The uncertainties were
evalu-ated by taking the extrema of the value of Rd(144 h, 500 K )
and ΣiRtrap,i⋅ni.
Using equation (5), it can finally be determined that
∆ =E 1.35±0.02 eV. As for the simulation at 500 K, using
=
ER 0.2 eV gives EA=1.55±0.02 eV. The uncertainties
were evaluated by taking the extrema of the determined value of ED and cmMAX(600 K).
In the simulation, the value used were ED=0.87 eV, =
ER 0.2 eV and EA=1.55 eV. They are different from the
ones used at 500 K and this behavior will be addressed in the discussion section.
The simulation of the experiments presented in [6] is com-posed of two phases: the atomic exposure at 600 K and the isothermal desorption at 600 K. In order to simplify the sim-ulation, the cooling and the re-heating phases are not simu-lated. As shown by the steady-state analysis, in the simulation, Figure 6. (a) Comparison between experimental and simulated D depth profiles during atomic exposure at 600 K (maximum exposure time = 48 h). (b) Comparison between experimental and simulated D depth profiles during the isothermal desorption at 600 K.
Figure 7. Comparison between simulated and experimental evolutions of the D total amounts with time during a 48 h atomic exposure at 600 K, flux of 5.8×10 D m18 ⋅ −2⋅s−1 followed by an
during the atomic exposure c ≈ ×3 10 D m⋅ −
surf 19 2 and
≈ × −
cmMAX 1.3 10 at.%9 . Figure 6 shows the comparison
between the D depth profiles during the atom exposure (figure 6(a)) and during the isothermal desorption (figure 6(b)). Figure 7 shows the evolution of the D retention (in the bulk and at the surface) for both the experiment and the simulation. The simulation is able to reproduce (with good agreement) the evo lution of the retention with time during the atom exposure and during the isothermal desorption shown in [6]. The same traps used in section 2.3 are used here:
– The intrinsic traps with the same trap concentrations as in section 2.3: the detrapping energies are Et,1=0.85 eV
and Et,2=1.00 eV. Due to their low detrapping energies,
the retention in those traps does not influence the results considering that the exposure temperature is 600 K. – The three new traps used in section 2.3 to reproduce the
experimental TDS spectra. The detrapping energies are:
=
Et,4 1.65 eV, Et,5=1.85 eV and Et,6=2.06 eV.
To reproduce the experimental D depth profiles during the atom exposure and the isothermal desorption (figure 6), the traps in the damaged layer are distributed as explained previously: constant from the surface to 2.2 µm and decreasing between
2.2 µm and 2.4 µm. In the damaged layer, the trap
concentra-tion is n3=0.19 at.%, n4=0.16 at.% and n5=0.02 at.%.
Concerning the evolution of the D amount during expo-sure and isothermal desorption (figure 7), it is especially interesting to see that, during the isothermal desorption, the D release is initially due to the rapid outgassing from the surface (in the first minutes). Then, D is released mainly from trap 3 and a small fraction from trap 4 and no desorption is observed from trap 5 since the detrapping energy is too high to allow it. Concerning the D depth profile (figure 6) during the atomic exposure, in both experimental and simulation results, the D total concentration (mobile + trapped) propagates in the bulk as the fluence (exposure time) increases. This migration can be understood as diffusion hindered by the presence of trap 3, trap 4 and trap 5 in the damaged layer. The corresponding effective diffusion coefficient can be roughly calculated as
=
D L
t eff mig
2
exposure with Lmig the migration length observed in the
simulation (figure 6(a)) for the exposure time texposure. From
the simulation results, D ≈10− m s⋅ −
eff 17 2 1. This effective
dif-fusion coefficient is far lower than the difdif-fusion coefficient in the bulk that we used (at 600 K D T( ) = ×3 10 m s− ⋅ −
H 9 2 1).
This reduced effective diffusion coefficient is due to the pres-ence of traps with high detrapping energies and high trap con-centrations. Deeper in the bulk, i.e. outside of the damaged layer, the effective coefficient will be higher than in the dam-aged layer since the only traps present are the intrinsic traps with lower detrapping energies and lower trap concentrations. During the isothermal desorption, the maximum concentra-tion decreases from around 0.3 at.% to around 0.2 at.% and a shift of the maximum concentration from the surface to around 1.5 µm is observed in the simulation as well as in the
experi-ments (figure 6(b)). It is also observed that the concentra-tion just below the surface drops to around 0.15 at.%, which agrees with the experimental observations.
3. Discussion
3.1. Surface-energy barriers
In this paper, a model to describe D atom interaction with the surface has been proposed. The surface is commonly described using a recombination coefficient K Tr( ) (m4· s−1),
as in TMAP7 [29], assuming a local equilibrium between the bulk and the surface. This description implies that, in the steady state, the following relation can be written [14]:
( ) ( )
⋅ Γ = ⋅ ⋅
s inc 2 K Tr cmeq 2 with Γinc (m−2· s−1) the incident flux
of particles (molecules or atoms) and s (dimensionless) the sticking probability of these particles. Thus, this description is valid if the concentration of particles in the bulk is propor-tional to the square root of the incident flux, which is the case for molecular exposure as shown by Pick et al [14]. Indeed, in Pick et al’s model, which is similar to the one described here, but without the direct abstraction, the concentration of parti-cles in the bulk can take the following form in the steady state:
( )
( ) ( ) ( ) =νν ⋅ νΓ ⋅ c T T s T m eq sb 12 bs incdes . From this formula, Pick et al expressed
the recombination coefficient as K T( )=ν ( )Tν⋅( )ν ( )T
T r bs 2 des sb 2 [14]
which for our cases gives: ( ) = × − ⋅ − − ⋅
K Tr 6 10 27 e 0.88 eV 0.96 eVk TB
(m4· s−1).
Nevertheless, in the case of an atomic exposure with the present model that includes the direct abstraction process, the concentration of particles in the bulk in the steady state takes a more complex form. Introducing equation (7) into equation (5), the concentration of particles in the bulk is no longer directly proportional to the square root of the incident flux, meaning that the description of the surface with a recom-bination coefficient is not valid. In addition, it has already been pointed out [30–32] that the most important issue related to the recombination coefficient is the large scattering of the different values used in the literature. In this respect, with the present study, another way to describe the surface has been proposed here that does not involve any recombination coef-ficient. This model introduces three new free parameters: the desorption energy ED, the resurfacing energy ER and the
energy barrier for absorption EA, which have to be determined.
The NRA and TDS spectra give coupled information on the bulk and surface properties. Thus, the simulations of such experiments can only be an indirect way to determine these three new parameters. In order to tackle this issue, a procedure was proposed in section 2.2, based on a steady-state analysis as well as a simplified model for the bulk diffusion/trapping of D initially proposed by Schmid et al [22] in the case of ion implantations and extended here in the case of atom exposure (figure 6). This procedure allows us to determine the surface-energy barriers independently of bulk surface-energy barriers.
Desorption energies per D atom determined in the pre-sent work, using the approach prepre-sented in section 2.2, are ED(500 K) =0.69±0.02 eV and ED(600 K) =0.87± 0.03 eV. These two values are in agreement with experimental [19, 33, 34] and DFT [21, 26, 35, 36] values for ED that range
between 0.50 eV and 0.90 eV. Naturally, this leads one to wonder how ED could change with temperature upon D atom
Markelj et al [20] linked this type of behavior with the pres-ence of several binding states with different ED values, where
the lowest ED states were increasingly populated as the surface
temperature decreases upon D exposure. Another interpreta-tion can be proposed following the work of Alnot et al [33] and Nahm and Gomer [37]. In these studies, it was found that ED
was decreasing by 0.1–0.3 eV when the increasing hydrogen surface coverage crossed a threshold of about 0.3–0.4, most likely due to adsorbate–adsorbate repulsive interaction. The coverages θ = cnsurf
surf of the present simulation analysis are
( )
θ 500 K =0.20 – 0.37 andθ(600 K)=0.16 – 0.42. The fact that we found ED decreases by 0.18±0.05 eV when the
sur-face temperature decreases (i.e. increased sursur-face coverage at a constant flux) is consistent with both interpretations.
By postulating that the resurfacing energy ER is the same
as the diffusion energy, i.e. 0.2 eV, the present work found energy barriers for absorption of D from surface to bulk of
( ) =
EA500 K 1.33 eV and EA(600 K) =1.55 eV using the
approach presented in section 2.2. These values are in agree-ment with the recent experiagree-ments of ‘t Hoen et al [10] which argued that the insertion of 5 eV/D ions is limited by surface processes, and obtained an absorption energy comprised of between 1 and 2 eV, once experimental uncertainties are taken into account. However, our EA values are lower compared to
the ones calculated by DFT. which are comprised of between 1.7 eV and 2 eV [21, 26, 27, 35]. One should note that DFT studies tend to disagree regarding the exact shape of the min-imum energy path for hydrogen insertion into the bulk through the W(1 0 0) face, with ER>Ediff in some cases and ER<Ediff
in other cases. It is even found that ER≈0 eV for the W(1 1 0)
case. Therefore, for a polycrystalline sample, it is difficult to determine the value of ER, and thus of EA, with good acc uracy. Further experimental and theoretical studies are needed in order to clarify the exact energy barriers for hydrogen trans-ition from the surface to the bulk and back.
The solution energy ES=EA−ED+ ⋅12 Ediss−ER
(figure 1) was measured by Frauenfelder [38] and found to be equal to 1.04 eV in the HI/W system. Value of Ediss are
available in the literature for single crystals. Following the first DFT study of White et al [39] into H2 dissociation on
W(1 0 0), Busnengo and Martinez [40] constructed six- dimension potential energy surfaces (PESs) for H2 dissociative
adsorption on W(1 0 0) and W(1 1 0). They ran quasi-classical MD simulations on these PESs in order to reproduce the molecular-beam results from Berger et al [41] and Butler et al [42] with fairly good agreement. This positive result inspires confidence in their DFT results used for PESs construction, which show that a reasonable portion of configuration space is barrierless for both W crystal cuts. Therefore, we chose for the polycrystalline samples simulated in the present work to set Ediss=0.0 eV. Using this value, we obtained a solution
energy ES=0.44 eV at 500 K and ES=0.48 eV at 600 K,
which is significantly lower than the value of 1.04 eV obtained by Frauenfelder [38].
The discrepancy could come from the difference in sample preparation in the works of Frauenfelder and in the work of Markelj et al [6] and Zaloznik et al [7]. In the first one, the
sample was annealed at 2400 K for 10 h in vacuum and then at 2400 K for 10 h in H2 atmosphere (600 Torr), while in the
second two, samples were annealed for 2 min at 2000 K. In addition, while in the case of Frauenfelder the samples were annealed in vacuum before H exposure, they were exposed to air between NRA and TDS analysis in the case of Markelj
et al and Zaloznik et al. It is well known that W oxide needs a temperature of 2400 K to for annealing [43]. Thus, differ-ences in surface oxide coverage may be responsible for the different values of solution energy determined from Markelj and Zaloznik’s experiments and from Frauenfelder’s experi-ments. Other explanations could involve variation in W crystal purity and subsequent surface segregation of contaminants.
The discrepancy with Frauenfelder results could also be explained by the presence of grain boundaries (GBs) in the material. Indeed, using a thermodynamic model to describe the GB effect on hydrogen solubility, Oda [44] showed that the GBs decrease (respectively increase) the value of the solution energy (respectively the solubility) significantly below 1000 K. This effect was not seen in the experiments of Frauenfelder where the W samples were loaded and des-orbed above 1100 K. On the other hand, in the experiments simulated in this paper, with temperature of 500 K and 600 K, the GB effect may change the apparent solubility and solution energy obtained.
Finally, another explanation could invoke the additional potential energy of D atoms arriving on the surface compared to D2 molecules. Thanks to the transformation of a part of
this potential energy into kinetic energy of the incident atoms, some of them may reach the sub-surface layer more easily than D coming from molecules. This transformation of energy involves dynamic processes that may be taken into account in our kinetic model by reducing the energy barrier EA. Thus, it
would reduce the solution energy obtained from the energy barriers EA, ER and ED. Nevertheless, it has to be pointed out
that the penetration probability of low energetic D atoms has been investigated by Maya [11] with MD simulations using the H-W potentials of Li et al [45] and Juslin et al [18]. Maya showed that, for incident energies below 1 eV/D, the fraction of stuck atoms reaching the first sub-surface layer is below 5% for the H-W potential of Juslin et al and 0% for the poten-tial of Li et al (see figure 8 in [11]). Galparsoro et al [46] also conducted MD simulations and found very similar results showing that, for incident energy below 0.5 eV/H, there was no absorption of H below the surface after 1 ps of simulation. This means that the excess of potential energy is somehow dissipated through different channels. Experimentally, Bünermann et al [47] observed a large loss of translational energy of 2.76 eV/H incident atoms impinging on a clean gold surface. To investigate this loss of energy, MD simulations self-consistently treating the mechanical energy transfers to the Au lattice motion and electronic excitations have been used. Bünermann et al’s simulations showed that the energy is lost through electron–hole pair excitation. Such dissipation processes were also observed by Galparsoro et al [48] by run-ning quasi-classical MD simulations of an H atom impinging a (1 0 0) and (1 1 0) W surface using a generalized Langevin-oscillator scheme to take into account the coupling to phonons
and the local-density friction approximation to render the electron–hole pair excitations. Galparsoro et al’s simulations showed that both processes can dissipate the kinetic energy of the incident H atom. In the case of the H atoms on a clean W surface, the dissipation by electron–hole excitation seems to be the main dissipation process although, as explained earlier, the surface of the materials used in the experiments simulated in this paper may not be clean W surfaces, which may change the relative efficiency of the different dissipation processes.
3.2. Detrapping energies in the bulk
In the present work, the simulation shows that, at 500 K and at 600 K, self-damaged W contains three more type of traps than undamaged W. The associated detrapping energies are
=
Et,3 1.65 eV, Et,4=1.85 eV and Et,5=2.06 eV. Previous
simulations of retention/desorption from self-damaged W samples [5, 49, 50] and neutron-irradiated samples [51] exhibit similar trends:
- Gasparyan et al [5] reported detrapping energies between 1.7 and 2.0 eV.
- Ogorodnikova et al [17, 49, 52] reported detrapping ener-gies of 0.9 eV, 1.45 eV, 1.85–1.9 eV, 2.2 eV and 2.4 eV. - ‘t Hoen et al [50] reported detrapping energies of 1.2 eV,
1.4 eV, 1.85 eV and 2.05 eV.
- Shimada et al [51] reported values of 0.9 eV, 1.5 eV, 1.75 eV and 2.0 eV.
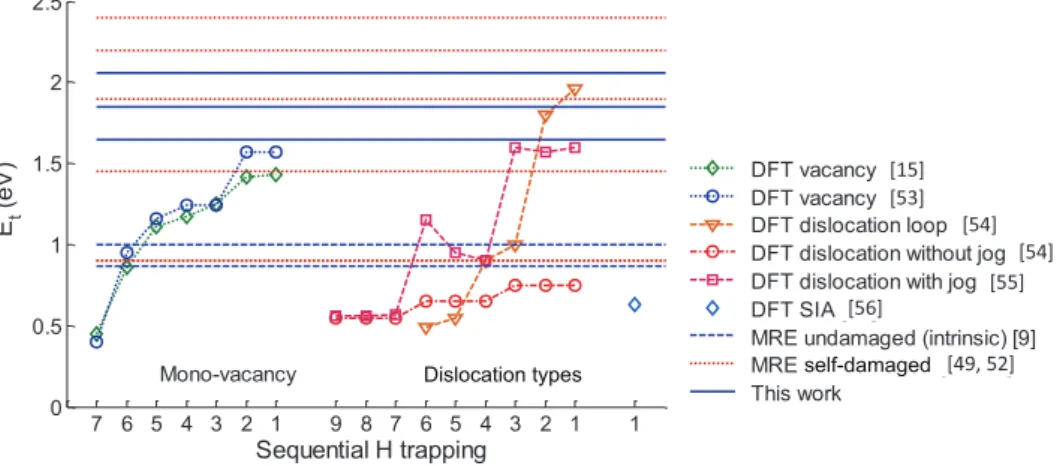
In order to understand the nature of the traps created by neutrons or self-irradiations, the detrapping energies deter-mined in this work are compared with detrapping energies calculated by DFT for H trapped in mono-vacancies [15, 53], dislocation loops [54] and dislocations with and without jog [55] (figure 8). Since the samples were irradiated with W ions, self-interstitial atoms (SIA) are also plausible traps for His; however, the corresponding detrapping energy is less than 0.7 eV [56], which means that the SIAs possibly created
during W self-irradiation will not trap the HIs atoms effi-ciently at 500 K or 600 K.
3.2.1. Trapping in mono-vacancies? The first possible type of defect created by self-irradiation is a mono-vacancy. It has been shown by DFT calculations [15, 53] that the detrapping energy of H bound with a mono-vacancy is 1.2 eV−1.1 eV if the mono-vacancy is filled with 3–5 H and it becomes 1.5−1.3 eV if the mono-vacancy is filled with 1–2 H, as shown figure 8. These DFT values are consistent with the reported detrapping energies of 1.45 eV by Ogorod-nikova et al [49, 52], of 1.2 eV and 1.4 eV reported by ‘t Hoen
et al [50] and of 1.5 eV by Shimada et al [51]. These authors linked this range of detrapping energies with TDS peaks in the 450–650 K range following HI ion/atom exposure in the 300– 525 K range. In the experiments of Zaloznik et al [7], simu-lated in the present study, HI atom exposure were performed at a sample temperature of 500 K, but the absence of a TDS peak in the 450–650 K range leads us to conclude that there is an absence of extrinsic traps below 1.65 eV. To rationalize this apparent discrepancy between various experiments, one has to consider the temperature stability of mono-vacancies. Using positron annihilation spectroscopy (PAS), Debelle
et al [57] have shown that mono-vacancies are stable fol-lowing a one-hour annealing up to 523 K. However, between 523 K and 573 K, the mobility of mono-vacancies increases and agglomeration starts generating cavities, i.e. clusters of vacancies with higher detrapping energies (see section 3.2.3). We used a thermally activated first-order kinetic process [12] with a 1013 s−1 pre-exponential factor to analyze the Debelle et al results and found that a 1 h time constant for vacancy mobility in the 523 K–573 K range corresponds to a vacancy migration energy in the 1.72–1.88 eV range. This analysis agrees well with vacancy-migration energy measurements in W of 1.7–1.8 eV [58]. Using this simple kinetic model, we estimated that in the experimental conditions of ‘t Hoen et al (HI exposure at 525 K), the typical time constant for vacancy Figure 8. Evolution of detrapping energies calculated by DFT with the number of H trapped inside different defects. For the H trapped in mono-vacancy, DFT data from Fernandez et al [15] and from You et al [53]. For H trapped by dislocations, DFT data from Terentyev et al [55] for dislocation line without and with jog and DFT data from Xiao et al [54] for dislocation loop. For H trapped by SIAs, DFT data from Heinola et al [56]. The detrapping energies are calculated by adding the migration energies calculated by DFT (0.2 eV) to the binding energies calculated by DFT for these defects. In this figure we also report the detrapping energies of intrinsic traps previously determined in [9], and detrapping energies of the self-damaged-induced trap determined in the MRE simulation from Ogorodnikova et al [49, 52] and in the present study. Detrapping energies from other MRE models are not presented on this plot for the sake of clarity.