RESEARCH ARTICLE
Advancing Pharmaceutical Dry Milling by Process Analytics
and Robustness Testing
Venkateshwar Rao Nalluri&Martin Kuentz
Published online: 9 September 2010
# Springer Science+Business Media, LLC 2010
Abstract The objectives of this work were to implement on-line dynamic image analysis and to introduce a novel at-line flowability analyzer in pharmaceutical dry milling. We used a pilot-scale conical mill and flowability of a placebo granulate was monitored using a powder avalanching analyzer. Experiments were designed and evaluated by means of response surface methodology in conjunction with robust-ness testing. The process parameters impeller speed and screen size significantly affected the particle size distribution and flow rate of the milled granules. Feeder speed did not affect the particle size, but displayed a statistically significant influence on the flow responses. Robustness testing was able to capture the effect of noise factors on the responses and showed clear differences between different lots of the placebo granulate in addition to temperature-dependent changes in flow behavior. Thus, on-line dynamic image analysis and at-line flowability characterization, together as complementary process analytical tools, provided valuable information. The combined analysis was of particular interest for testing the process and noise factors so that future process development can profit from this advancement in dry milling.
Keywords Dry milling . Process analytical technology (PAT) . Dynamic image analysis . Powder avalanche . Response surface method . Taguchi method
Introduction
Dry milling is an important pharmaceutical unit opera-tion in solid dosage form manufacturing. Much research has gone into the understanding of the comminuting process [1]. Main emphasis is placed on the evolving particle size since it influences many product attributes [2]. Therefore, knowledge of process factors is a major concern to set up a robust process, thereby producing quality milled product in a consistent manner [3,4]. The latter product quality is also influenced by critical material properties so that the interaction of process and material parameters should be thoroughly studied as part of the pharmaceutical development [5,6].
Currently, process analytics is a central topic in the pharmaceutical industry. The concept of process analytical technology (PAT) is fostered by the Food and Drug Administration, and one incentive for the industry is a greater regulatory flexibility in manufacturing. However, PAT is optimally introduced already in the development phase to better understand the process and optimize the quality of the final product. Many production issues can be avoided if the formulation is developed in a robust way. Since its introduc-tion, the concept of process analyzers has been encouraging manufacturers to experiment with new approaches and technologies to better comprehend and control their processes [7,8]. However, to advance PAT, it is important not only to introduce new process analyzers but also focus on the implementation of existing technologies. This approach is hoped to bridge the existing gap between initial research applications and current industrial practice.
The aim of this study was to identify new process analyzers in pharmaceutical conical milling and to perform robustness testing. We recently introduced an on-line dynamic image analysis (DIA) sensor in the process stream
V. R. Nalluri
:
M. Kuentz (*) Institute of Pharmaceutical Technology,University of Applied Sciences Northwestern Switzerland, Gründenstr. 40,
CH-4132 Muttenz, Switzerland e-mail: [email protected] V. R. Nalluri
Institute of Pharmaceutical Technology, University of Basel, Klingelbergstr. 50,
of a conical mill [9]. Implementation of the sensor requires a feasibility study of a broad range of process conditions. To achieve this objective, we conduct experiments using a response surface method, which is also widely used in the pharmaceutical industry [10, 11]. As response variables, different measures of the particle size distribution are selected. However, particle size alone does not fully characterize a particle system, and further aspects such as cohesion, density, and moisture content in the bulk material are of significance for further processing. It is, therefore, also interesting to characterize the flow behavior of granules after milling. In this way, the influence of particle size on flowability is emphasized. Hence, as a second objective, we introduced a novel at-line flowability analyzer. The underlying principle is powder avalanching inside a rotating drum, and it is remarkable that Kaye et al. [12] already mentioned the potential use of this avalanching method for process analytics, although PAT tools have not been used so far. A possible reason is that initial powder avalanching enabled only the counting of avalanches, whereas the method in our study analyzes the whole avalanching event and yields a series of parameters characterizing the flow. To have a reference for these parameters, conventional flow through an orifice was determined as well.
Process analytics aims to improve process development. Activities at this stage of development also include scale-up as well as investigation of further variables such as environmental factors, supplier changes, or lot-to-lot vari-ability [3]. Looking at the different variables, there are controllable factors as well as other factors that cannot be controlled. Such uncontrollable factors, otherwise called “noise factors,” were differentiated from controllable factors by Genichi Taguchi who proposed statistical designs for robustness testing. The Taguchi method is widely used in engineering [13–15] and has quite recently found its way into biotechnology [16,17]. Nonetheless, its pharmaceutical application has been limited.
In this study, we complemented the response surface design by robustness testing and addressed possible means of advancing unit operation of dry milling by the new process analyzers together with the statistical methods.
Materials and Methods Materials
Two lots of a pharmaceutical placebo formulation were manufactured and used as model granulates. The placebo mixture comprised lactose (62.6%, w/w; GranuLac® 200), microcrystalline cellulose (31.3%, w/w; Avicel® PH-101), and polyvinylpyrrolidone (6.1%, w/w; Kollidon® K90). Table 1 shows the physical characteristics of the two lots. GranuLac® 200 was obtained from MEGGLE, Wasserburg, Germany. Avicel® PH-101 was purchased from FMC BioPolymers, Brussels, Belgium. Kollidon® K90 was from BASF, Ludwigshafen, Germany. These placebo granulate lots were manufactured by Glatt GmbH (Binzen, Germany) in a GPCG 60 fluidized bed granulator/dryer.
Methods
Characterization of Raw Materials
Particle size of the granulates was analyzed using a Retsch® sieve shaker type AS200 control (Retsch GmbH, Haan, Germany). A 100-g sample was placed on top of a pile of sieves (range 180–2,000 μm) arranged according to a√2 progression. The sieves vibrated for 10 min, and data analysis was in line with the dry sieving method (method I of USP). The bulk and tapped densities of the granulates were measured in a graduated cylinder using a type SVM 102 bulk density instrument (Erweka® GmbH, Heusenstamm, Germany) that was operated according to USP method II. A MultiPycnometer® (Quantachrome GmbH, Odelzhausen, Germany) was used to determine the true densities using helium as the displacement gas. Finally, the BET-specific surface area was measured using a Gemini V (Micromeritics Instrument Corporation, Norcross, USA), and sample prepa-ration was done on a FlowPrep 060 (Micromeritics Instrument Corporation). Prior to measurement, samples were accurately weighed into sample tubes and degassed under nitrogen flow for 16 h at 40°C to condition the surface. Loss on drying of granulates was measured before and after drying. Granules were tray-dried for 1 week at 40°C in a convection oven (Heraeus® model UT12, Thermo Scientific, Germany). A
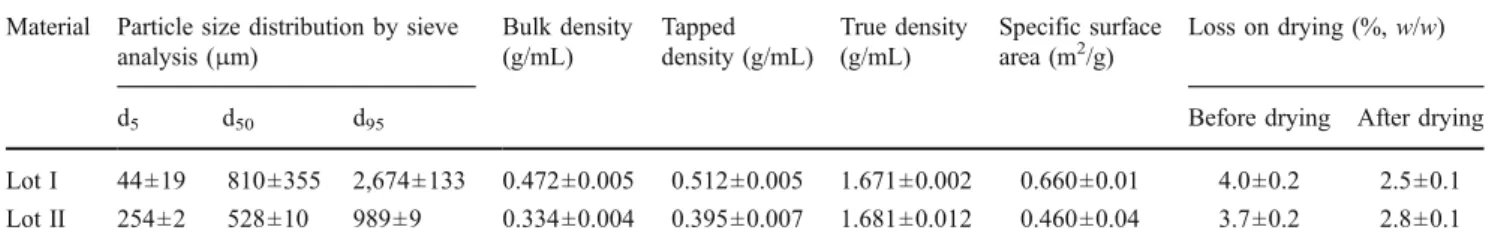
Table 1 Physical characteristics of placebo granulate lots (mean ± standard deviation, n=3) Material Particle size distribution by sieve
analysis (μm) Bulk density (g/mL) Tapped density (g/mL) True density (g/mL) Specific surface area (m2/g) Loss on drying (%, w/w)
d5 d50 d95 Before drying After drying
Lot I 44±19 810±355 2,674±133 0.472±0.005 0.512±0.005 1.671±0.002 0.660±0.01 4.0±0.2 2.5±0.1
halogen moisture analyzer, type HB43 (Mettler Toledo, Greifensee, Switzerland) was used for measuring the loss of drying. All the reported results were obtained in triplicate. Dry Milling Equipment
A pilot-scale conical mill, ConiWitt-150™ (Frewitt SA, Fribourg, Switzerland) with different screen sizes was used. The impeller was operated at variable speeds ranging from 4 to 18 m/s, and a square-shaped, two-armed rotor blade profile was used. A sample of approx. 1 kg was filled into the hopper attached to a feeder. The rate was controlled by a pneumatic system which was operated from 4 to 11 rpm. On-line Dynamic Image Analysis
An on-line dynamic image analysis sensor (XPT®-CV, PS Prozesstechnik GmbH, Basel, Switzerland) was employed for monitoring the milling process. This image analysis system is capable of measuring particle sizes in the range of 1–3,000 μm. The image update rate was kept constant at 160 ms (six images per second with 780,000 pixels). As the particles pass through the detecting zone, the xenon flash light illuminates the particles and a charge-coupled device (CCD) camera acquires images of the fast-moving particles. The flashlight and CCD camera were synchronized and the images were transferred to the analyzer computer. The software (version 4.8.19) analyzed the images in real time to display and store the results. All particle size distribu-tions were calculated on a volume basis. The size parameter “equivalent rectangle short side” [18] was chosen for this study. Equivalent rectangle short side is defined as the length of the short side of the rectangle that has the same area and same perimeter as the particle. The perimeter and the area are based on a two-dimensional projection of the individual particles onto the plane of the image.
At-line Flowability Testing Using Powder Avalanching Analyzer
Flowability of the milled materials was tested in a rotating drum using a commercial powder avalanching analyzer (REVOLUTION®, Mercury Scientific Inc., SC, USA). The bigger sample drum assembly (110 mm in diameter, 35 mm wide) was employed for all the tests. A powder sample measuring device (volume of 118.3 mL) provided with the instrument was used to standardize the sample volume of the different measurements. The images were captured at a rate of ten frames per second. During milling, a sample of standard-ized volume was quickly transferred to the instrument for analysis which was located in close proximity to the conical mill. After loading the powder into the sample drum, a preparation time of 60 s was allowed. Subsequently, the sample
drum was rotated at a speed of 0.6 rotations per minute. This rotation speed was chosen after evaluating a broad range of drum speeds (0.4, 0.6, 0.8, 1.2, and 1.6 rpm) and subsequently looking at the corresponding flow regimes exhibited by the mixtures. The avalanching data collection was limited to 2,048 data points. This duration was selected to ensure a sufficient number of data points for analysis. Tests were performed in triplicate, and means and their standard deviations were reported. All experiments were done at ambient conditions with an average relative humidity of 40±5%.
A commercially available powder flow testing instru-ment (COPLEY Scientific, Nottingham, UK) was used as a reference for monitoring the rate of flow of the samples through an orifice. A truncated cone with a circular orifice diameter of 15 mm was used. Flow rate was measured in discrete samples, and the mass flow rate was reported. No vibrator was attached to the instrument.
Design of Experiments and Statistical Analysis
The response surface design was fully randomized and conducted in a single block as 33 factorial design which studied the effects of three factors in 30 runs, including three center points per block. The design had 20 degrees of freedom for the error. Table2summarizes the three process parameters and their corresponding levels. The design of experiments and selected responses are compiled in Table3. Granulate lot I was used in this factorial design.
Subsequently, a robustness design was applied. Two control factors and two noise (uncontrollable) factors were considered for the robustness method (Taguchi), as shown in Table 4. The design resulted in a total of 16 runs that were randomized to avoid any bias. Noise factors were chosen from a practical view point since lot-to-lot varia-tions and storage temperature fluctuavaria-tions are commonly observed in the pharmaceutical industry. Table 5 summa-rizes the results of all measurements.
Statistical data analysis was done with STATGRAPHICS® Centurion XV (version 15.2.06, Stat Point, Inc., Virginia, USA) throughout. The fit of the regression models underlying the designs was checked by the coefficient of determination (R2).
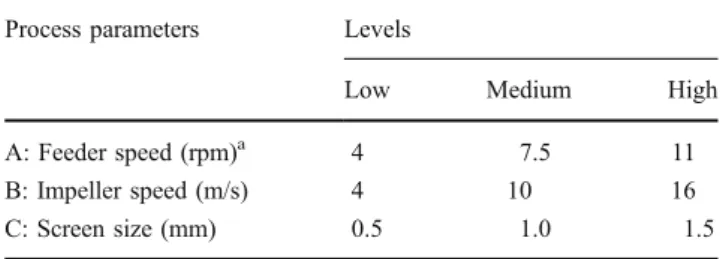
Table 2 Process parameters and corresponding levels for the response surface method
Process parameters Levels
Low Medium High
A: Feeder speed (rpm)a 4 7.5 11
B: Impeller speed (m/s) 4 10 16
C: Screen size (mm) 0.5 1.0 1.5
aLow, medium and high feeder speed correspond to approximately 35, 55 and 90 kg/h of material throughput, respectively
An analysis of variance (ANOVA) was conducted to deter-mine the significant parameters at the 95% confidence level.
Results and Discussion Response Surface Methodology
Particle Size Data Monitored by On-line Dynamic Image Analysis
In a previous study, we evaluated different PAT modes of DIA [9]. Based on these findings, on-line configuration was
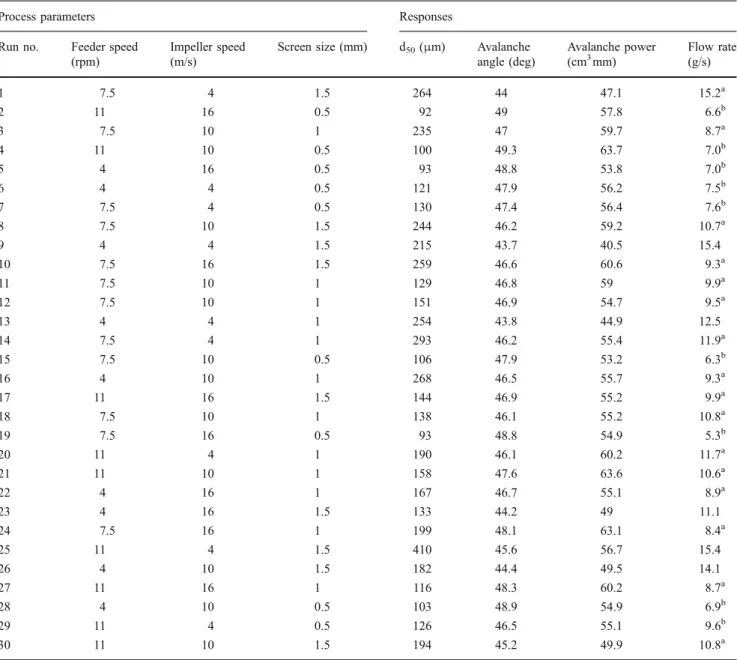
Table 3 Response surface method: design of experiments and measured responses
Process parameters Responses
Run no. Feeder speed (rpm)
Impeller speed (m/s)
Screen size (mm) d50(μm) Avalanche angle (deg) Avalanche power (cm3mm) Flow rate (g/s) 1 7.5 4 1.5 264 44 47.1 15.2a 2 11 16 0.5 92 49 57.8 6.6b 3 7.5 10 1 235 47 59.7 8.7a 4 11 10 0.5 100 49.3 63.7 7.0b 5 4 16 0.5 93 48.8 53.8 7.0b 6 4 4 0.5 121 47.9 56.2 7.5b 7 7.5 4 0.5 130 47.4 56.4 7.6b 8 7.5 10 1.5 244 46.2 59.2 10.7a 9 4 4 1.5 215 43.7 40.5 15.4 10 7.5 16 1.5 259 46.6 60.6 9.3a 11 7.5 10 1 129 46.8 59 9.9a 12 7.5 10 1 151 46.9 54.7 9.5a 13 4 4 1 254 43.8 44.9 12.5 14 7.5 4 1 293 46.2 55.4 11.9a 15 7.5 10 0.5 106 47.9 53.2 6.3b 16 4 10 1 268 46.5 55.7 9.3a 17 11 16 1.5 144 46.9 55.2 9.9a 18 7.5 10 1 138 46.1 55.2 10.8a 19 7.5 16 0.5 93 48.8 54.9 5.3b 20 11 4 1 190 46.1 60.2 11.7a 21 11 10 1 158 47.6 63.6 10.6a 22 4 16 1 167 46.7 55.1 8.9a 23 4 16 1.5 133 44.2 49 11.1 24 7.5 16 1 199 48.1 63.1 8.4a 25 11 4 1.5 410 45.6 56.7 15.4 26 4 10 1.5 182 44.4 49.5 14.1 27 11 16 1 116 48.3 60.2 8.7a 28 4 10 0.5 103 48.9 54.9 6.9b 29 11 4 0.5 126 46.5 55.1 9.6b 30 11 10 1.5 194 45.2 49.9 10.8a
aOne single tap was necessary to initiate powder flow through the orifice bContinuous tapping was necessary to make the powder flow
Table 4 Control and noise factors for the Taguchi method Levels
Inner array (control factors)
B: Impeller speed (m/s) 4 10
C: Screen size (mm) 1.0 1.5
Outer array (noise factors)
D: Lots I II
chosen for the present work. The size measure was the equivalent rectangle short side which has an advantage with respect to image analysis of moving particles. Equivalent rectangle short side is less affected by motion blur (apparent streaking of rapidly moving particles) than other commonly used size parameters. Motion blur might result in overesti-mation of the particle size because of particle elongation due to high air pressure employed in the venturi systems.
The data obtained from on-line DIA were analyzed to find statistically significant process parameters that affect particle size distribution. Data were obtained for d5, d50, and d95.
Impeller speed (p=0.0036) and screen size (p<0.0001) were statistically significant at the 95% confidence level even with the fine particle fraction (d5). On the other hand,
feeder speed was not significant for all particle size responses. Changes in the coarser size fractions were mainly of interest in a milling process. Figure1shows the mean particle size (d50) as a response plot. The model had
an R2 of 0.69, and only the significant factors are shown. The nonlinear decline of the size as a function of increasing impeller speed (p=0.0034) agreed with the expectation that an increased amount of energy was brought into the milling process. It is known from the literature [1] that size and energy needed for comminution share a highly nonlinear relationship. Impeller speed not only introduced more local energy but also increased the rate of milling. Moreover, the screen size had a significant effect on the d50 values (p=
0.0001). Arising from smaller screen sizes, the milled product became coarser with increasing size and leveled off at
1.5 mm. The results were analogous to the findings of Carstensen [19] who earlier studied the case of hammer mills. It is interesting that the feed rate was not statistically significant even with d50and d95. Theoretically, it would be
expected that feed rate influences milling rate. However, milling rate is the outcome of the comminution characteristics of a given material. A material that breaks or deagglomerates easily will, for example, less likely lead to material accumu-lation in the milling chamber and thus will not display a pronounced feed rate effect on size distribution. The results of our model granulate can be compared with findings from a previous study by Motzi and Anderson [20] who investigated an aspirin granulate in a Comil®. This study also failed to
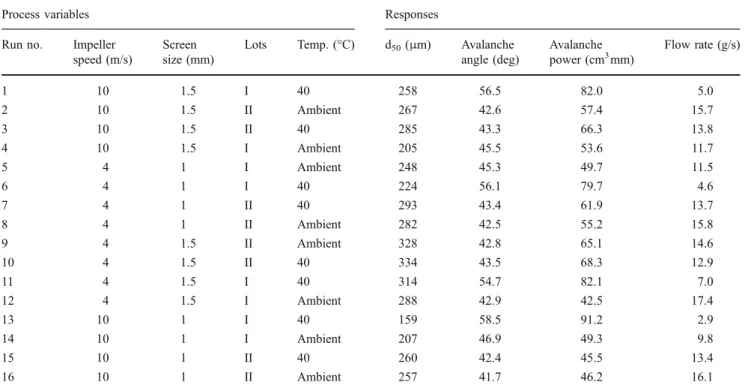
Table 5 Taguchi method for robustness testing: design of experiments and measured responses
Process variables Responses
Run no. Impeller speed (m/s)
Screen size (mm)
Lots Temp. (°C) d50(μm) Avalanche angle (deg) Avalanche power (cm3mm) Flow rate (g/s) 1 10 1.5 I 40 258 56.5 82.0 5.0 2 10 1.5 II Ambient 267 42.6 57.4 15.7 3 10 1.5 II 40 285 43.3 66.3 13.8 4 10 1.5 I Ambient 205 45.5 53.6 11.7 5 4 1 I Ambient 248 45.3 49.7 11.5 6 4 1 I 40 224 56.1 79.7 4.6 7 4 1 II 40 293 43.4 61.9 13.7 8 4 1 II Ambient 282 42.5 55.2 15.8 9 4 1.5 II Ambient 328 42.8 65.1 14.6 10 4 1.5 II 40 334 43.5 68.3 12.9 11 4 1.5 I 40 314 54.7 82.1 7.0 12 4 1.5 I Ambient 288 42.9 42.5 17.4 13 10 1 I 40 159 58.5 91.2 2.9 14 10 1 I Ambient 207 46.9 49.3 9.8 15 10 1 II 40 260 42.4 45.5 13.4 16 10 1 II Ambient 257 41.7 46.2 16.1 Impeller speed (m/s) Screen size (mm) 4 6 8 10 12 14 16 0.5 0.70.9 1.11.3 1.5 90 130 170 210 250 290 330
Fig. 1 Response surface plot for the effect of impeller speed and screen size (at a constant feeder speed of 7.5 rpm) on d50
show the effect of feed rate on particle size. An absent effect of feeder speed was also seen with the d95 values, but
statistical significance was observed with the impeller speed (p=0.0103) and screen size (p<0.0001). The d95model had
an R2of 0.79.
The observed particle size distributions obtained from DIA exhibited a normal distribution, but some samples displayed a tendency toward bimodal distribution. These observations were in agreement with Heywood’s [21] experimental finding of the effect of milling time on particle size distributions. Heywood mentioned that as the milling continued, materials which originally exhibit normal particle size distribution transform to a size-reduced bimodal distribution. The material properties of the granules also play a role in size reduction. Material characteristics such as density, hardness, cohesiveness, and moisture content among others influence mill performance and particle size. Furthermore, the type of mill has a major effect on the size and shape of particles, as stated by Holt [22]. In the current study, on-line DIA provided reliable size information in a broad range of milling conditions. The use of response surface methodology appears especially useful to develop a process for a given material. Process analytics contribute to monitoring any deviation from a reference state during production. However, measuring size is only one aspect of a particle bulk. To better assess surface properties and cohesion, flowability is an interesting parameter to monitor as it is highly relevant for further processing. At-line Flowability Characterization Using Powder Avalanching Analyzer
After milling, the different granules were characterized with a powder avalanching tester to evaluate its usefulness as an at-line monitoring tool. We used a novel testing instrument that analyzes the images of the entire avalanche event to calculate derived parameters [23,24]. In the present study, we focused on the avalanche angle and avalanche power. Both parameters can be advantageous with respect to the interpretation of avalanches. Thus, some particle systems exhibit double or multiple avalanches rather than a clear single discharge. Since we also observed some double avalanches, it was less adequate to simply count the avalanches for sample comparison. Avalanche angle is measured before the discharge at peak position and is therefore hardly affected by the type of discharge. Ava-lanche power is a measure for the potential energy of the mean avalanche [23].
The avalanche angle had a model R2 of 0.88, with all process parameters, namely, feeder speed (p = 0.0028), impeller speed (p<0.0001), and screen size (p<0.0001), being statistically significant. The avalanche angle de-creased as the screen size inde-creased from 0.5 to 1.5 mm,
indicating that coarse particles flow better. High impeller speed produced rather fine particles which have a relatively poor flow, thus exhibiting high avalanche angles. Accord-ingly, Figs. 1 and 2a were in good agreement, but flowability parameters include factors in addition to particle morphology. Aspects of surface roughness and cohesion play a role. Flowability parameters may therefore include a potential surface amorphization or loss of solvent that could occur during the milling process.
It was remarkable that the avalanching method revealed the significance of feeder speed. Effects of feeder speed can be inferred from Fig.2bas a function of the screen size for which an interaction was revealed (p=0.0139). According-ly, the effect of feeder speed was different at a smaller screen size when compared to screens having a compara-tively large opening of 1.5 mm. It should, however, be noted that these differences were rather subtle. While avalanche angle is a dynamic angle of response, avalanche power is a measure of the potential energy of particles in the avalanche and is measured in cubic centimeters times
a
Impeller speed (m/s)
Screen size (mm)
Avalanche angle (degrees)
4 6 8 10 12 14 16 0.5 0.70.9 1.11.3 1.5 44 45 46 47 48 49 50
b
Feeder speed (rpm) Screen size (mm)
Avalanche angle (degrees)
4 6 8 10 12 0.5 0.7 0.9 1.1 1.3 1.5 44 45 46 47 48 49 50
Fig. 2 Response surface plots for the effect of impeller speed and screen size (at a constant feeder speed of 7.5 rpm) on avalanche angle (a) and the effect of feeder speed and screen size (at a constant impeller speed of 10 m/s) on avalanche angle (b)
height (cm3 × mm). High values of avalanche power indicate the formation of a large avalanche before ava-lanching. Again, feeder speed (p=0.0010), impeller speed (p=0.0336), and screen size (p=0.0292) were statistically significant for avalanche power. However, the model R2 was comparatively low for this descriptor at 0.65, which was mainly due to a scattering of values. The avalanche angle and avalanche power were correlated as expected, and the Pearson product moment correlation was 0.7 between the two descriptors. Accordingly, a high potential energy of the avalanche was mainly seen with samples having comparatively high avalanche angles. Such samples were associated with comparatively poor flowability.
In order to compare the powder avalanching data with the most widely used flow characterization technique, the flow rate through an orifice was additionally determined. The samples milled through the fine screen at high impeller speed resulted in very poor flow (Fig. 3). Conversely, samples milled through the coarse screen at low impeller speed flowed freely. The flow rate model resulted in a high R2of 0.95. Impeller speed and screen size affected flow rate through the orifice and were statistically significant, with both parameters having a p value<0.0001. Moreover, an interaction (p=0.0006) between the two factors was found (p=0.018). Thus, the interaction of feeder speed and screen size observed earlier was confirmed by the flowability parameter (p=0.018). A good Pearson product moment correlation of −0.88 was observed between flow rate and avalanche angle. This implies that the smaller the avalanche angle, the higher the flow rate of the milled granules. Besides, a Pearson correlation of 0.70 between mean particle size and flow rate was also observed.
The avalanching method provided useful information in addition to the monitoring of the particle size alone. Avalanching flowability values were in good agreement with the results of the conventional flow rate that served as a
reference rather than as an at-line PAT tool. The avalanching method is more advanced compared to the conventional flow through orifice since it provides dynamic images of the flowing powder. Hence, the avalanching technique is a potential at-line PAT tool, and future applications could even include automated filling and emptying of the rotating drum. Process analyzers also provided the means to establish a design space for the product in dry milling. Impeller speed and screen size were the two main process parameters found to be significantly influencing particle size as well as flowability. High impeller speed combined with the fine screen resulted in a fine particle size and subsequently in poor flow. Therefore, an impeller speed of 4–10 m/s and a screen size of 1.0–1.5 mm were considered to obtain coarse particles with a good flow. Since the feeder speed only slightly affected the particle size, it was left to operate at average speed of 7.5 rpm in subsequent experiments. These conditions were used for robustness testing which is described in the following chapters.
Impeller speed (m/s) Screen size (mm)
Flow rate (g/s) 4 6 8 10 12 14 16 0.5 0.70.9 1.11.3 1.5 5 7 9 11 13 15 17
Fig. 3 Response surface plot for the effect of impeller speed and screen size (at a constant feeder speed of 7.5 rpm) on flow rate through a 15-mm orifice Lots Flow r a te (g/ s ) I II Temperature conditions 40˚C Ambient 0 3 6 9 12 15 18 Lots Av a la nche a ngle (degree s ) Temperature conditions 40˚C Ambient 42 45 48 51 54 57 I II
a
b
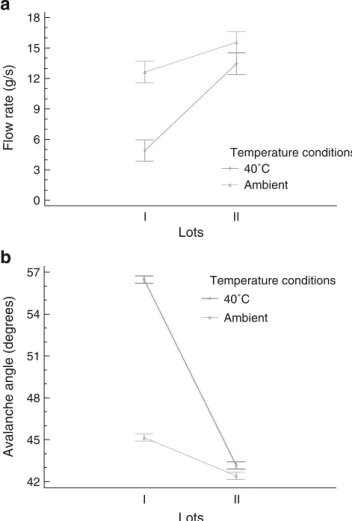
Fig. 4 Interaction plots showing the effect of noise factors on flow rate (a) and avalanche angle (b)
Robustness Methodology
The robustness test (Taguchi design) focused on a part of the response surface that was of interest for processing. A classical ANOVA was used to evaluate the effects instead of considering the signal-to-noise ratio. The latter method reduces the degrees of freedom and should primarily be conducted with Taguchi designs having sufficient experi-mental runs. However, since material is usually a limiting factor, such larger Taguchi designs have a limited impor-tance for pharmaceutical process development.
The control factors impeller speed and screen size had a statistically significant effect on d50and d95. Impeller speed
showed a stronger influence on d50(p=0.0023) than on d95
(p=0.0189). In addition, screen size showed a stronger influence on d50(p=0.0048) than on d95(p=0.0104). These
data were in good agreement with the observations of the response surface method. Impeller speed (p=0.0030) and screen size (p=0.0073) also showed statistical significance for avalanche angle. Both control factors resulted in comparatively low p values for flow rate, but the effects were not significant at the 95% confidence level. This was indicative of the importance of noise factors.
The two noise factors, namely, different lots and temper-ature conditions (Table4), strongly affected the avalanching parameters and flow rate. Avalanche angle (p<0.0001), avalanche power (p=0.0189), and flow rate (p=0.0002) were statistically significantly influenced by the factor of granulate batches. The two batches had a different particle size distribution and therefore exhibited variable flow characteristics. Temperature also influenced avalanche angle (p<0.0001), avalanche power (p=0.0004), and flow rate (p =0.0004). Additionally, strong interactions were observed between the two noise factors for all flowability responses. Examples of such an interaction between the two noise factors affecting flow rate (Fig. 4a) and avalanche angle (Fig.4b) are presented. Large differences depending on the temperature conditions were seen in lot I when compared to lot II with respect to avalanche angle and flow rate. Flow rate in Fig. 4a decreased drastically for lot I when the temperature was increased to 40°C. This can be attributed to the fact that the material that was dried at 40°C for 1 week became fluffy upon milling and flowed inconsistently, thus leading to a lower flow rate. On the other hand, lot II did not show any major change in flow rate or decreased only slightly with increasing temperature and had a better flow rate than lot I. Figure 4b shows a large increase in avalanche angle with increasing temper-ature in the case of lot I. This is a marker of poor flowability. As for flow rate, avalanche angle did not change much for lot II. A slight difference, both in flow rate and avalanche angle, for the two lots was observed at ambient temperature, which had become more marked at
higher temperature. The optimal choice would then be to mill lot II at ambient conditions to maximize the output responses, namely, high flow rate and low avalanche angle. Our results emphasize the importance to balance process factors with potential noise factors. A Taguchi design may be performed as part of process development. A knowledge database could be generated for a product, which is important for later manufacturing. Issues of lot-to-lot variability or storage conditions can be avoided. Thus, embedding process analyzers into the design and implementing robustness testing optimize the quality of resulting granulates.
Conclusions
On-line dynamic image analysis was implemented in the dry milling process. By using at-line powder avalanching, a new process analyzer was introduced. The different methods provided complementary information relevant for further processing. Therefore, both process analyzers were needed for a full characterization of the milled material.
Process analyzers already help during process develop-ment, thus providing a sound basis for later manufacturing. Since noise factors were shown to be of relevance, part of this basic knowledge should include robustness testing. Influencing factors, such as lot-to-lot variability for example, are often not sufficiently considered during development. This necessitates the balancing of such noise factors against process factors for clarification. Combined use of process analyzers and statistical methods as reported here for dry milling can be part of a broader concept of solid dosage form manufacture. In conclusion, advancing the individual me-chanical unit operations is a prerequisite for optimizing the quality of the final dosage form.
Acknowledgments The authors thank the Commission for Technology and Innovation (CTI), Switzerland, for funding this research work under the project no. 9025.1 PFIW-IW. Thanks also go to Philippe Chavanne and Michael Mueller for their technical support during the course of this work. Glatt GmbH (Binzen) is greatly acknowledged for kindly donating the pharmaceutical placebo granulate lots.
References
1. Parrott EL. Milling of pharmaceutical solids. J Pharm Sci. 1974;63:813–29.
2. Shekunov BY, Chattopadhyay P, Tong HHY, Chow AHL. Particle size analysis in pharmaceutics: principles, methods and applica-tions. Pharm Res. 2007;24:203–27.
3. Guidance for industry PAT—a framework for innovative pharma-ceutical development, manufacturing, and quality assurance. U.S. Department of Health and Human Services Food and Drug Administration (FDA), Center for Drug Evaluation and Research (CDER), Center for Veterinary Medicine (CVM), Office of
Regulatory Affairs (ORA), Pharmaceutical cGMPs. http://www. avarent.com/docs/pat.pdf, September 2004.
4. Scott B, Wilcock A. Process analytical technology in the pharmaceutical industry: a tool kit for continuous improvement. PDA J Pharm Sci Technol. 2006;60:17–53.
5. Hlinak AJ, Kuriyan K, Morris KR, Reklaitis GV, Basu PK. Understanding critical material properties for solid dosage form design. J Pharm Innov. 2006;1:12–7.
6. Schofield T, Bavitz JF, Lei CM, Oppenheimer L, Shiromani PK. Key variables in dosage form design. Drug Dev Ind Pharm. 1991;17:959–74.
7. MacGregor JF, Bruwer MJ. A framework for the development of design and control spaces. J Pharm Innov. 2008;3:15–22. 8. Yu LX. Pharmaceutical quality by design: product and process
development, understanding, and control. Pharm Res. 2008;25:781– 91.
9. Nalluri VR, Schirg P, Gao X, Virdis A, Imanidis G, Kuentz M. Different modes of dynamic image analysis in monitoring of pharmaceutical dry milling process. Int J Pharm. 2010;391:107–14. 10. Sastry SV, Reddy IK, Khan MA. Atenolol gastrointestinal therapeu-tic system: optimization of formulation variables using response surface methodology. J Control Release. 1997;45:121–30. 11. Rambali B, Baert L, Thone D, Massart DL. Using experimental
design to optimize the process parameters in fluidized bed granulation. Drug Dev Ind Pharm. 2001;27:47–55.
12. Kaye BH, Gratton-Liimatainen J, Faddis N. Studying the avalanching behavior of a powder in a rotating disc. Part Part Syst Charact. 1995;12:232–6.
13. Hou TH, Su CH, Liu WL. Parameters optimization of a nano-particle wet milling process using the Taguchi method, response surface method and genetic algorithm. Powder Technol. 2007;173:153–62.
14. Shahbazian A, Navarchian AH, Pourmehr M. Application of Taguchi method to investigate the effects of process factors on the
performance of batch emulsion polymerization of vinyl chloride. J Appl Polym Sci. 2009;113:2739–46.
15. Gopalsamy BM, Mondal B, Ghosh S. Taguchi method and ANOVA: an approach for process parameters optimization of hard machining while machining hardened steel. J Sci Ind Res (India). 2009;68:686–95.
16. Houng JY, Hsu HF, Liu YH, Wu JY. Applying the Taguchi robust design to the optimization of the asymmetric reduction of ethyl 4-chloro acetoacetate by bakers’ yeast. J Biotechnol. 2003;100:239– 50.
17. Rao RS, Kumar CG, Prakasham RS, Hobbs PJ. The Taguchi methodology as a statistical tool for biotechnological applications: a critical appraisal. Biotechnol J. 2008;3:510–23.
18. National Instruments. User’s manual for LabVision. Texas, USA, 2005.http://www.ni.com/pdf/manuals/322916a.pdf.
19. Carstensen JT. Comminution. In: Carstensen JT, editor. Advanced pharmaceutical solids: drugs and the pharmaceutical sciences, vol. 110. New York: Marcel Dekker; 2001. p. 323–33.
20. Motzi JJ, Anderson NR. The quantitative evaluation of a granulation milling process. II. Effect of output screen size, mill speed and impeller shape. Drug Dev Ind Pharm. 1984;10:713–28. 21. Staniforth J. Particle size reduction. In: Aulton ME, editor. Pharmaceutics: the science of dosage form design. 2nd ed. New York: Churchill Livingstone; 2002. p. 168–9.
22. Holt CB. The shape of particles produced by comminution: a review. Powder Technol. 1981;28:59–63.
23. Nalluri VR, Kuentz M. Flowability characterization of drug-excipient blends using a novel powder avalanching method. Eur J Pharm Biopharm. 2010;74:388–96.
24. Bonfichi R, Cloralio G, Rainoldi A. Dynamic avalanching accurately assesses flowability and quality. Pharm Technol Europe 2009. http://pharmtech.findpharma.com/pharmtech/article/article Detail.jsp?id=607093&pageID=1&sk=&date. Accessed 31 May 2010.