DOI 10.1007/s11151-012-9348-6
A Comparison of National and International Innovation
Cooperation in Five European Countries
Spyros Arvanitis · Thomas Bolli
Published online: 15 March 2012
© Springer Science+Business Media, LLC. 2012
Abstract This paper analyses the differences between national and international
innovation cooperation in five European countries: Belgium, Germany, Norway, Portugal and Switzerland. We find that absorptive capacity, incoming spillovers, appro-priability and risk-sharing are more important in an international context. Further-more innovation performance is positively influenced by international cooperation, but remains unaffected by national cooperation. Despite the heterogeneity of the investi-gated countries, we find similar determinants and impacts of innovation cooperation.
Keywords National innovation cooperation· International innovation cooperation ·
Innovation performance
JEL Classification O30
1 Introduction
This paper analyses the differences between national and international innovation
cooperation1with respect to their determinants and their impact on innovation
per-formance. The interest in the cooperation behaviour of firms stems from the growing importance of innovation networks and the increasing openness of firm boundaries in the innovation process.
1 In the text below ‘cooperation’ denotes always ‘innovation cooperation’. S. Arvanitis (
B
)KOF Swiss Economic Institute, ETH Zurich, 8092 Zurich, Switzerland e-mail: arvanitis@kof.ethz.ch
T. Bolli
Economics Department, Lancaster University, Lancaster LA1 4YX, UK e-mail: bolli@alumni.ethz.ch
In order to keep up with the pace of the markets and to remain competitive, it is often no longer sufficient to rely only on in-house innovation, but becomes increasingly important to make the borders of the firms permeable. In particular, the relevance of cooperation with partners from other countries is increasing due to the ongoing glob-alisation of production and development processes. But while the promotion of inter-national cooperation constitutes an important goal of technology policy especially of
the European Union [see, e.g.,Vonortas(2000) andHagedoorn et al.(2000); see also
Boardman and Gray(2010)], our understanding of the differences between national and international cooperation agreements with respect to their determinants and their impacts remains incomplete.
This paper attempts to investigate the differences between national and interna-tional cooperation. To this end, we analyse the cooperation behaviour of innova-tive firms in five European countries: Belgium, Germany, Norway, Portugal and Switzerland. This heterogeneous sample of countries varies with respect to size, degree of openness, innovation performance and cultural background. The database consists of Community Innovation Survey (CIS3) data for the EU member states and Norway. For Switzerland the data were collected through a comparable sur-vey.
We investigate cooperation agreements along the dimension of national versus inter-national cooperation. More concretely, in a first step, we analyse the determinants of national and international cooperation by estimating two probit models that use dummy variables that indicate national and international cooperation, respectively. In the second step, we estimate a tobit model that uses the share of sales that are generated by innovative products as dependent variable. The independent variables include dummy variables for exclusive national cooperation and for international cooperation. We address endogeneity using an instrumental variable approach.
The paper extends the existing empirical work concerning innovation cooperation in two ways: First, we complement existing research by specifying separate equa-tions for the determinants of national and international cooperation and their impact on innovation performance. We also account for potential endogeneity of cooperative agreements in the innovation equation. Second, our analysis comprises five Euro-pean countries, thereby allowing an assessment of the validity of our findings across countries and an analysis of differences between countries.
The set-up of the paper is as follows: In Sect. 2 of the paper the conceptual
framework and related empirical literature is presented. The data and some country
characteristics are briefly described in Sect.3. Section5presents the model
specifi-cation and the estimation procedure. In Sect.5the empirical results are discussed and
Sect.6concludes the paper.
2 Conceptual Framework and Literature Review 2.1 Preliminary Remarks
The following discussion of the conceptual framework concerning the determinants of innovation cooperation is based on three literature strands. The industrial organisation
(IO) literature analyses the incentives that are created by incoming and outgoing
spill-overs [seeKaiser(2002) andDe Bondt(1996) for reviews]. The second strand
orig-inates from the management literature and discusses potential motives for innovation
cooperation [seeCaloghirou et al.(2003) for a review]. Third, the regional
innova-tion systems literature focuses on the characteristics of spillovers [Simmie (2004)
provides a review]. The final paragraphs of the section discuss the existing litera-ture on the impact of cooperation on innovation output and present our hypothe-ses.
2.2 Absorptive Capacity and Knowledge Spillovers
An important strand of the IO literature is concerned with endogenous absorptive capacity, which is the ability to exploit externally generated knowledge: knowledge that is generated by competitors, suppliers, customers, and/or public research
institu-tions and universities (Cohen and Levinthal 1989,1990). Firms with well-educated
staff and permanent research activities are supposed to have higher absorptive capacity than do firms that lack such characteristics.
The concept of incoming spillovers (seeCassiman and Veugelers 2002) is strongly
related to the absorptive capacity of a firm. It indicates the “amount” of exploit-able external knowledge that flows into the firm. The type of cooperation partner is an important characteristic that can affect the extent of such spillover effects in a cooperative project. In cooperative agreements with universities or research organi-zations, maximizing incoming spillovers is important for a cooperating firm. When collaborating with other enterprises (suppliers, customers or competitors) in addition to exploiting incoming spillovers cooperating firms are also interested in minimizing outgoing spillovers.
Outgoing spillovers measure the amount of a firm’s knowledge that seeps out of the firm and can be utilised by other firms. While incoming spillovers may motivate a firm to seek Research and Development (R&D) cooperation, outgoing spillovers exert the opposite influence: They hinder innovative activities because of the risk of internal knowledge leaking out to competitors. The negative effects of outgoing spillovers can be attenuated through several formal (e.g., by ensuring property rights through patents) and informal (e.g., secrecy, lead time over competitors, complexity of developed products) appropriability mechanisms.
There is an inherent relationship between these three concepts: Absorptive capacity is necessary for a firm in order to be able to exploit available external knowledge: to ensure knowledge flows to the firm (incoming spillovers). But the firm also protects its own knowledge base from being exploited by other firms or institutions without paying for it, thus controlling outgoing spillovers, e.g., through various protection mechanisms.
Innovation cooperation, particularly in the form of joint ventures, is an impor-tant single knowledge acquisition strategy, which has been the subject of theoret-ical and empirtheoret-ical analysis since some years. Economic research in the field of R&D cooperation essentially aims at understanding why firms are undertaking such
cooperation, how they do it, and with what result [seeKaiser(2002), andDe Bondt
(1996), for reviews of this literature].
Probably the most influential theoretical paper in this field is that ofD’Aspremont
and Jacquemin(1988). They derived a two-stage Cournot duopoly game in which firms decide upon R&D investment and then compete in the product market. R&D expendi-tures are larger in research joint venexpendi-tures than in the competition case if (exogenous) spillovers exceed a critical value.
Kamien et al.(1992) generalize the framework ofD’Aspremont and Jacquemin
(1988). Relevant key findings of this paper are that: (a) An increase in spillovers tends
to reduce incentives to collaborate in R&D; (b) An increase in market demand leads to an increase of research efforts; (c) An increase of market demand fosters R&D cooperation; and (d) Increased research productivity leads to increased incentives to invest in R&D and also to cooperate.
Using data from the Community Innovation Survey (CIS) for different European
countries,Cassiman and Veugelers(2002),Belderbos et al.(2004a),Bönte and
Keil-bach (2005),Schmidt(2005),Miotti and Sachwald (2003) and Abramovsky et al.
(2009) provide empirical evidence that supports the notion that absorptive capacity
and the extent of incoming and extent of outgoing spillovers have the expected effects on the likelihood of innovation cooperation. Moreover, analyzing national and
interna-tional cooperation separatelyFaria and Schmidt(2007) find little evidence for
differ-ences between national and international cooperation with respect to these variables.
2.3 Cost- and Risk-Sharing Motives
The second branch of literature to be taken into consideration is research on the
motives of international firm alliances in management economics (see, e.g.,Glaister
and Buckley 1996). The most relevant motive in this context is the realisation of syner-gies by transferring complementary technology. Another motive is to share innovation risks.
However, whileBelderbos et al.(2004a) find a positive significant coefficient for
a variable that measurs innovation risk, the risk-sharing motive appears to be of no
relevance inCassiman and Veugelers(2002),Bönte and Keilbach (2005),Schmidt
(2005) andMiotti and Sachwald (2003). A potential explanation could be that the
positive effect for international cooperation is disguised by the insignificant effect for national cooperation in empirical estimates that do not distinguish between these two types of cooperation.
Furthermore, Glaister and Buckley (1996) argue that firms might cooperate to
share costs and thereby realise economies of scale. The empirical results of
Cassi-man and Veugelers(2002),Bönte and Keilbach(2005), andSchmidt(2005) support
this hypothesis.Miotti and Sachwald(2003) augment the hypothesis arguing that the
cost-sharing motive is more important for national than for international cooperation. Firms might enter innovation cooperation in order to attract governmental funding. Since the acquisition of funding by foreign governments requires specific knowledge about local funding schemes, international cooperation reduces information costs.
Furthermore, there are many funding schemes that require firms to enter an
interna-tional cooperation agreement (see, e.g.,Czarnitzki and Fier 2003).
A further motive for international cooperation that is discussed in the management economics literature is that spillovers and synergies might be larger in the international context. Potential reasons for larger spillovers could be the likelihood that international
partners might be closer to the technological frontier than are national partners (Miotti
and Sachwald 2003) and the necessity of applying location-specific technology (see,
e.g.,Li and Zhong 2003).
2.4 The Role of the Regional Dimension
The third literature strand—the economics of regional innovation systems—investi-gates geographic innovation clusters and the role of technological spillovers in this
context (see, e.g.,Leamer and Storper 2001;Sonn and Storper 2008).
An early explanation for the formation of such clusters is that innovation activities require flexible inputs and a high degree of communication that can be achieved
only in urban areas (Vernon 1966). The existence of local spillovers provides
an alternative explanation: The transfer of uncodifiable and complex knowledge requires trust and understanding among cooperation partners that can be developed
more effectively through face-to-face contacts (Simmie 2004;Storper and Venables
2004).
The findings ofLindelöf and Löfsten(2004) support the relevance of informal
con-tacts for university-industry linkages. Furthermore,Aldieri and Cincera(2009) as well
asBottanzi and Peri(2003) provide empirical evidence for the local nature of spill-overs: Regional but not interregional spillovers show a positive impact on productivity growth.
The general impression from this literature is that incoming spillovers are more important for intra-regional (national) than inter-regional (international) cooperation. The implications with respect to outgoing spillovers and hence appropriability are ambiguous: While outgoing spillovers appear to be larger in the national context, trust might provide an alternative mechanism to secrecy and/or legal protection thus raising knowledge appropriabilty for a given level of outgoing spillovers. Since trust is harder to achieve in the international context, appropriability that is based on legal protection and/or secrecy might be more important in the international context despite the smaller magnitude of outgoing spillovers.
However,Waxell and Malmberg (2007) observe that while the Uppsala biotech
cluster is locally anchored, it has strong links to the world as well.Bathelt et al.(2003)
see these interregional connections as network pipelines that mitigate the lock-in effect
that may be created by high levels of geographic concentration (see, e.g.,Boschma
2005). Such pipelines work through functional proximity rather than geographic
prox-imity (Cooke 2006). Similarily,Morgan(1997),Hart and Simmie(1997), andWolfe
and Gertler(2004) stress the relevance of interregional and international pipelines for innovation.
Maskell et al.(2006) add a further aspect to this perspective by pointing out the rele-vance of temporary clusters—for example, international professional gatherings—for
the creation of trust that is needed to complement the functional proximity. On the whole, this part of the regional innovation systems literature emphasises in accordance with the management economics literature the relevance of spillovers (and synergies) in the international context.
2.5 The Impact of Cooperation on Innovation Performance
In sum, existing literature seems to provide conflicting views as to the role of spill-overs in the national and international context with respect to both the effect on the likelihood of cooperation and the impact on innovation output and productivity.
Empirical evidence is also mixed.2A number of empirical studies have found a
positive impact of engaging in innovation cooperation on innovation performance,
which is usually measured by the sales share of innovative products [see, e.g.,Klomp
and van Leeuwen(2001),Lööf and Heshmati(2002); andBelderbos et al.(2004b)]. However, other studies find little evidence for a significant correlation between
innova-tion cooperainnova-tion and innovainnova-tion performance (e.g.,Kemp et al. 2003;Janz et al. 2003).
Moreover, the existing evidence with respect to the differences between national
and international innovation cooperation remains inconclusive as well. Namely,Miotti
and Sachwald(2003) show that in France innovation performance is not affected by innovation cooperation agreements with national partners but is positively influenced
by cooperation with foreign partners. Similarly,Lööf(2009) finds that the presence
of foreign cooperation partners in the network has a positive effect on innovation
per-formance. However,Lööf and Heshmati(2002) find positive effects on innovation for
both partner types andJaklic et al.(2008) find positive effects of national but not of
international innovation cooperation for Slovenian firms. 2.6 Research Hypotheses
Based on the literature discussed above, we formulate the following hypotheses: Hypothesis 1 Absorptive capacity exerts a positive influence on the likelihood of cooperation.
Hypothesis 2 Incoming spillovers exert a positive influence on the likelihood of cooperation.
Hypothesis 3 Appropriability exerts a positive influence on the likelihood of cooperation.
Given the existing theoretical and empirical literature we have no specific a pri-ori expectations as to the effects of absorptive capacity and incoming and outgoing
2 Nevertheless, subjective measures of cooperation performance obtained from a broad survey of European countries (Caloghirou and Vonortas 2000) showed a wide spectrum of expected benefits, primarily from international research joint ventures: acquisition and/or creation of new knowledge, development of new products, improvement of the technological capabilities of participating firm, etc. (see alsoCaloghirou et al.
Table 1 Population size, sample size and response rate by country
Country Firms in population Firms in sample Response rate in % Observations used in estimations Belgium 13,827 4,482 47 428 Switzerland 56,722 6,000 40 980 Germany 117,979 13,642 21 1,314 Norway 9,316 3,796 96 1,068 Portugal 23,816 4,097 na 460 Source:Lucking(2004)
spillovers separately for national and international cooperation. It is expected that the empirical comparative analysis would cast more light on this issue.
Hypothesis 4 Innovation risks exert a positive influence on the likelihood of cooper-ation.
Hypothesis 4a Innovation risks as a determinant of the likelihood of cooperation are more important for international than for national cooperation.
Hypothesis 5 Financial constraints exert a positive influence on the likelihood of coop-eration
Hypothesis 5a Financial constraints as a determinant of the likelihood of cooperation are more important for national than international cooperation
According to the theoretical arguments and existing empirical evidence the effect of innovation cooperation on innovation performance is not a priori clear.
3 Data Description
The data for Belgium, Germany, Norway, and Portugal were collected in the course of the Third Community Innovation Survey (CIS3), which covered the period 1998– 2000 and were available as micro-aggregated data in the form that is usually provided
by Eurostat. The questionnaire that was used was based on the Oslo manual (OECD
1997). Sample reliability of the CIS data is ensured by the sampling procedure that
is described inEurostat(2001). The Swiss data are from the Swiss Innovation
Sur-vey 2002, which covered the period 2000–2002 and referred to R&D-active firms.
The underlying questionnaire was also based on the Oslo manual [seeArvanitis and
Hollenstein(2004) for the sample construction].3
Table1 provides information on the number of firms in the population and the
sample as well as the response rates and the number of observations without miss-ing values due to item-non-response for each country. Response rates vary between
3 Thus, there is a comparability problem of the Swiss data that we consider not to be serious given that many characteristics of cooperation behaviour have structural character, at least for the short period of time taken into account in this study.
Table 2 Composition of the sample by sector, firm size and type of innovation cooperation
BE CH DE NO PT
N % N % N % N % N %
By sector:
Mining, construction and energy 5 1 61 6 30 2 60 6 10 2
Consumer goods 42 10 63 6 94 7 139 13 91 20
Intermediate goods 111 26 193 20 299 23 199 19 123 27
Investment goods 129 30 415 42 503 38 333 31 134 29
Traditional services 61 14 130 13 190 14 132 12 62 13
Knowledge-based services 80 19 118 12 198 15 205 19 40 9 By firm size in employees:
Small (10–49) 180 42 386 39 431 33 469 44 152 33
Medium (50–249) 148 35 415 42 458 35 195 18 145 32
Large (250 and more) 100 23 179 18 425 32 404 38 163 35 By type of innovation cooperation:
No cooperation 297 69 789 81 906 69 589 55 343 75
National cooperation 39 9 62 6 227 17 223 21 66 14
National and international cooperation 92 21 129 13 181 14 256 24 51 11
Total 428 100 980 100 1,314 100 1,068 100 460 100
The sector definitions refer to the following 2-digit NACE codes: mining, construction, energy (10–14 and 40–41); consumer goods (SECTOR_2; 15–19), intermediate goods (SECTOR_3; 20–27); investment goods (SECTOR_4; 28–37); traditional services (excluding hotels and restaurants) (SECTOR_5; 50–52; 60–64); knowledge-based services (SECTOR_6; 72–74)
21 % for Germany and 96 % for Norway. For all countries we restrict the sample to firms with 10 and more employees. Furthermore, the data sets contain only innovating firms. Therefore, our inferences refer only to innovating firms. In addition, we elimi-nate financial intermediaries from our sample as well as observations that indicate an R&D or investment intensity above one. Finally, we drop observations of firms that conduct international but not national innovation cooperation to facilitate the
inter-pretation of our cooperation variables. Table2shows the composition of the data sets
that are used in this study for all five countries by sector, firm size class and type of innovation cooperation.
Table3provide the definitions of the variables that are used in this study. Table4
contains descriptive statistics of the used variables; and Table5shows the
correla-tions between the model variables. Country-specific descriptive statistics and cross-correlations are available upon request.
4 Model Specification and Estimation Procedure 4.1 Specification of the Cooperation Equations
The fact that many firms are engaged at the same time in both types of cooperation leads to the problem of interdependence between national and international cooperation,
Table 3 Definition of the variables of the cooperation equation
Variables Description Dependent variables
First equation
COOP_NAT_INT 0: no cooperation; 1: only national cooperation; 2: also international cooperation
Second equation
NEWS Sales share of new or significantly improved products in % Independent variables
Absorptive capacity
FEPT Innovation expenditures divided by sales (Switzerland: R&D expenditures) OSKILL Dummy variablea; 1: lack of qualified personnel is an important innovation
obstacle; 0: otherwise
Incoming spillovers
SPILLIN Dummy variableb; 1: high relevance of customers, suppliers of materials and capital goods and universities reflects as innovation-relevant external knowledge resource; 0: otherwise
Appropriability
APPR Dummy variablec; 1: any of the following means to protect inventions or innovations were used: patents; design patterns; trademarks; copyright; 0: otherwise
Proxies for risk- and cost sharing
ORISK Dummy variablea; 1: risks of innovation projects are an important innovation obstacle; 0: otherwise
OFIN Dummy variablea; 1: difficulty to access to financial sources is an important innovation obstacle; 0: otherwise
Cooperation variables (for second equation)
NATCOOP Dummy variable; 1: firms that have co-operation arrangements with other firms or organisations (only national partners); 0 otherwise
INTCOOP Dummy variable; 1: firms that have co-operation arrangements with other firms or organisations (also international partners); 0: otherwise
Control variables
INVPT Gross investment divided by sales
PUBFIN Dummy variable for public financial support in the respective reference period
GROUP Dummy variable; 1: firm is part of an enterprise group; 0: firm is independent
FOREIGN Dummy variabled; 1: firm with foreign headquarter; 0: otherwise MARKET_2 Dummy variable; 1: firm operating primarily in a national market; 0:
otherwise
MARKET_3 Dummy variable; 1: firm operating primarily in an international market; 0: otherwise
SIZE_2; SIZE_3 Dummy variables; 1: 50 to 249 employees; 0: otherwise and 1: 250 employees and more; 0: otherwise, respectively; reference group: firms with 10–49 employees
which can be addressed econometrically by estimating a multinomial probit model that is based on a dependent variable referring to exclusive groups of firms. To this end, we constructed the nominal variable COOP_NAT_INT (0: no cooperation; 1:
Table 3 continued
Variables Description
SECTOR_2-SECTOR_7 7 sectoral dummies; see Table2for the definitions; reference group: mining, construction, energy
aThe dummy variable takes the value 1 if a firm reports the values 3 or 4 and the value 0 if a firm reports the values 1 or 2 on a four-point Likert scale (1: ‘not relevant’: 4: ‘high importance’); Switzerland: the dummy takes the value 1 if a firm reports 4 or 5 and the value 0 if a firm reports 1, 2 or 3 on a five-point Likert scale (1; ‘not important’; 5: very important’);bthe dummy variable takes the value 1 if the average score of the relevance of customers, suppliers of materials and capital goods and universities as sources of innovation-relevant information is higher than 4; the importance of each single source is measured on four(five)-point Likert scale;cfor Switzerland, the dummy variable takes the value 1 if a firm reports that the relevance of innovation protection measures takes the value 4 or 5 and 0 otherwise;dfor Switzerland the dummy variable takes the value 1 if the firm is foreign-owned
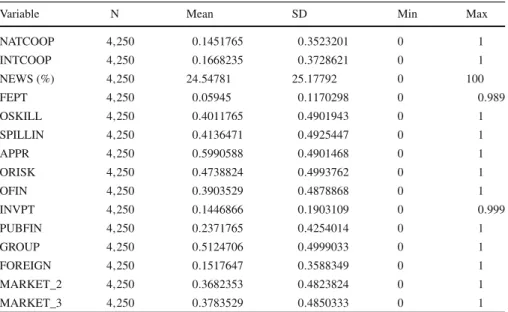
Table 4 Summary statistics
Variable N Mean SD Min Max
NATCOOP 4,250 0.1451765 0.3523201 0 1 INTCOOP 4,250 0.1668235 0.3728621 0 1 NEWS (%) 4,250 24.54781 25.17792 0 100 FEPT 4,250 0.05945 0.1170298 0 0.989 OSKILL 4,250 0.4011765 0.4901943 0 1 SPILLIN 4,250 0.4136471 0.4925447 0 1 APPR 4,250 0.5990588 0.4901468 0 1 ORISK 4,250 0.4738824 0.4993762 0 1 OFIN 4,250 0.3903529 0.4878868 0 1 INVPT 4,250 0.1446866 0.1903109 0 0.999 PUBFIN 4,250 0.2371765 0.4254014 0 1 GROUP 4,250 0.5124706 0.4999033 0 1 FOREIGN 4,250 0.1517647 0.3588349 0 1 MARKET_2 4,250 0.3682353 0.4823824 0 1 MARKET_3 4,250 0.3783529 0.4850333 0 1
only national cooperation; 2: also international cooperation) that serves as dependent variable for the cooperation equation.
Our model contains variables that measure a firm’s knowledge absorptive capacity, the availability of qualified personnel, incoming spillovers, appropriability, the extent of innovation risks, the extent of financial constraints, a series of control variables with respect to capital intensity, public promotion of innovation, affiliation to a group of enterprises, type of market in which a firm operates, firm size and sector affiliation. We measure absorptive capacity (FEPT) by the innovation expenditures inten-sity: the ratio of innovation expenditures to sales (for Switzerland: R&D
expendi-tures/sales). Based on hypothesis1, we expect a positive effect of this variable. We
use a variable for lack of qualified personnel (variable OSKILL) as an additional measure that reflects absorptive capacity. For this variable we expect a negative effect.
Ta b le 5 Correlation m atrix; cooperation equation N A TCOOP INTCOOP LNEWS F EPT OSKILL SPILLIN APPR ORISK OFIN INVPT PUBFIN G R OUP FOREIGN MARKET2 N A TCOOP 1. 00 INTCOOP − 0. 18 1. 00 LNEWS − 0. 02 0. 08 1. 00 FEPT 0. 05 0. 16 0. 16 1. 00 OSKILL − 0. 02 0. 02 0. 01 0. 01 1. 00 SPILLIN 0. 06 0. 22 0. 05 0. 12 0. 13 1. 00 APPR 0. 06 0. 22 0. 12 0. 15 0. 08 0. 23 1. 00 ORISK 0. 04 0. 09 0. 02 0. 09 0. 19 0. 18 0. 11 1. 00 OFIN 0. 04 0. 03 0. 04 0. 13 0. 19 0. 13 0. 08 0. 34 1. 00 INVPT − 0. 09 − 0. 02 0. 11 0. 03 − 0. 11 − 0. 18 − 0. 13 − 0. 11 − 0. 10 1. 00 PUBFIN 0. 18 0. 20 0. 03 0. 21 0. 04 0. 18 0. 16 0. 11 0. 13 − 0. 11 1. 00 GR OUP 0. 01 0. 21 − 0. 02 − 0. 03 − 0. 02 0. 09 0. 15 − 0. 01 − 0. 12 − 0. 06 0. 01 1. 00 FOREIGN − 0. 09 0. 12 0. 00 − 0. 02 − 0. 02 0. 02 0. 08 − 0. 07 − 0. 12 − 0. 01 − 0. 05 0. 38 1. 00 MARKET_2 0. 03 − 0. 06 − 0. 05 0. 00 0. 01 0. 00 − 0. 02 0. 03 0. 05 − 0. 13 0. 04 − 0. 07 − 0. 06 1. 00 MARKET_3 − 0. 05 0. 19 0. 09 0. 04 0. 07 0. 13 0. 21 0. 04 0. 00 0. 03 0. 07 0. 17 0. 16 − 0. 60
The variable serving as a proxy for incoming spillovers (SPILLIN) is based on the average score (on a four-point Likert scale for all countries with the exception of Switzerland, where a five-point scale is used) of the innovation relevance of knowledge from customers, suppliers of material and capital goods and universities (on the whole:
four different sources). Following hypothesis2, we expect a positive effect from this
variable, but remain agnostic with respect to the relative effects as to national and international cooperation.
Outgoing spillovers (APPR) are proxied by a dummy variable that is constructed on the basis of information on the availability and use of several legal means (patents, design patterns, trademarks, and copyright) to protect innovation returns. For firms that use such means extensively, we assume that the firms need them in order to protect their knowledge from imitation and improve the appropriability of their innovation revenues. But this kind of measure does not denote in itself much about the effec-tiveness of these protection means. Unfortunately, measures of the effeceffec-tiveness of protection are not available in our dataset. If protection is effective, appropriability is warranted and cooperation could not be harmful. If protection is ineffective, low appropriability would be a problem for the firm and cooperation would be avoided.
In accordance with hypothesis3, a positive sign of the variable would be interpreted
as support for the validity of the assumption that high appropriability (low level of outgoing spillovers) is present, a negative sign would be a confirmation of the low appropriability assumption (high level of outgoing spillovers).
Further, the management literature considers two additional motives for innovation (R&D) cooperation: sharing of innovation risks, and sharing of innovation invest-ment. As proxies for these two motives we use the variables ORISK, which refers to the importance of innovation risks as an innovation obstacle and OFIN controlling for
lack of funds for innovation, respectively. Based on hypotheses4and4a, we expect that
high innovation risks are a motivation for cooperation and that this effect is stronger for international than for national cooperation. Furthermore, we expect lack of funds for innovation to be an incentive rather for national than international cooperation as
described in the hypotheses5and5a.
Several additional firm characteristics are also taken into account as control vari-ables: the intensity of physical capital (INVPT), measured by the ratio of investment expenditures to sales; whether a firm receives public financial support (PUBFIN); whether a firm belongs to a group of enterprises (GROUP); and whether a firm is for-eign or domestic (FOREIGN). For public support we expect a positive sign because in most countries public support is tied to the condition of cooperative projects.
A positive sign is expected also for the variable GROUP. Firms that are embedded in a network of sister firms would show a higher cooperation propensity than would firms without such ties. It is not a priori clear if there are differences with respect to cooperation behaviour between domestic and foreign firms. Finally, dummy variables for market orientation (local, domestic, international), firm size (10–49, 50–249, 250 and more employees) and sector affiliation are included in the cooperation equations. Hence, a formal expression of the probability that firm i cooperates with national / international partners is as follows:
+ α4, jA P P Ri+ α5, jO R I S Ki + α6, jO F I Ni
+ α7, jI N V P Ti+ α8, jPU B F I Ni+ α9, jG R OU Pi
+ α10, jF O R E I G Ni + controlvariables
+ ui, j; ( j=1 : onlynational; j=2 : alsointernational).
(1)
4.2 Specification of the Innovation Equation
Our innovation equation is specified on the basis of the resource-based firm concept
[see, e.g.,Teece(1982) andTeece et al.(1997)]. Innovation performance (NEWS) is
measured by the sales share of new and considerably modified products (see Table3).
As independent variables we use proxies for the intensity of innovation expenditures (FEPT), investment intensity (INVPT), and a series of control variables for foreign ownership, firm size and sector affiliation. Finally, we include also the cooperation dummy variables (NATCOOP; INTCOOP).
We expect a positive effect of the two resource-related variables. According to the-oretical arguments and existing empirical evidence the direction of the effects of the two cooperation variables is not a priori clear. A formal expression of this equation for a firm i is as follows:
N E W Si = β0+ β1N AT C O O Pi + β2I N T C O O Pi+ β3F E P Ti
+ β4I N V P Ti+ β5F O R E I G Ni+ control variables + vi. (2)
In this second step, we estimate tobit models for Eq. (2), since NEWS, the dependent
variable, was downward censored at 0. Reported standard errors are heteroscedasticity-robust standard errors.
4.3 Endogeneity
Being involved in cooperation activities might not be exogenous to innovation
activities. FollowingCassiman and Veugelers(2002), we tested the endogeneity of
three variables in the cooperation equations (FEPT, SPILLIN, APPR) and the two cooperation variables in the innovation equation (NATCOOP, INTCOOP) according
to the following procedure (Rivers and Vuong 1988): Instrument equations were
esti-mated separately for each cooperation variable and each sample. Instrument choice was based on a significant correlation with the endogenous variable and an insignificant coefficient in a regression that includes both endogenous and instrumental variables. The residuals of the first stage equations were inserted in the cooperation equations and in the innovation equations respectively as additional regressors. Bootstrapping was used in order to correct the standard errors of the estimated parameters.
If the coefficient of the residuals was statistically significant (at the 10 % test level), we have assumed that endogeneity is present and consequently based our inference on instrumented variables; also in this case standard errors were estimated
by bootstrapping. In cases in which the coefficient of the residual was not statistically significant, we have assumed exogeneity. Tables with the estimates of the instrumen-tal equations, the results of the endogeneity tests, and the reduced form estimates are available upon request.
The endogeneity tests for FEPT, SPILLIN, and APPR show that the null hypoth-esis of exogeneity cannot be rejected. Endogeneity tests for NATCOOP and INT-COOP reveal endogeneity for NATINT-COOP in Germany and Norway, while INTINT-COOP is endogenous in all equations except for Belgium and Portugal. Therefore, we report results based on instrumented variables in these cases. As instruments we used (a) the 2-digit industry means of four variables that measure the importance of the following sources of external knowledge: suppliers (manufacturing; CH; DE); firms belonging to the same group (CH); universities (pooled; manufacturing; services sector); and public research institutions (pooled; NO); (b) the 2-digit industry means of two vari-ables that measure the importance of the following obstacles of innovation: costs of innovation (DE); and lack of market information (services sector); and (c) the 2-digit industry means of the export shares of turnover (NO). All instrument variables fulfilled the conditions for appropriate instruments that are mentioned in the first paragraph of this section.
5 Empirical Results 5.1 Cooperation Propensity
Table6summarizes the main results, and Tables7and8show the estimates of the
multinomial probit model for the exclusive categories ‘only national’ and ‘also inter-national’ innovation cooperation with respect to the reference category (consisting of firms that are not engaged in innovation cooperation). In addition to country results,
Tables7and8 contain estimates of pooled regressions. Further, we report separate
estimates for the pooled manufacturing and the pooled service sector. The estimates at country level are justified by the Chow-type likelihood ratio test, which rejects the pooled model with a p value of 0.001. A further test rejected pooling sectors with a p value of 0.02.
Supporting hypothesis1, we find that absorptive capacity as measured by intensity
of innovation expenditures (FEPT) increases the likelihood of national cooperation except for Portugal (no effect) and Belgium (negative effect). The insignificant mar-ginal effect for pooled manufacturing indicates that the overall positive effect can be traced back mainly to the services sector. The marginal effects become positively significant in all equations that analyse international innovation cooperation with the exception of Portugal. Furthermore, the effect is larger for international than for national cooperation.
The measure for absorptive capacity that is related to human capital (OSKILL) shows the expected negative sign in the regressions of national cooperation, but it is statistically significant only at the more aggregate for the service sector and at the country level only for Norway. Also in this case the expected negative effect is found primarily in the pooled service sector. We found no effect for international cooperation.
Ta b le 6 Cooperation equations; summary results NA T IN T Pool Man S erv B E C H G E N O P T P ool Ind S erv B E C H G E N O P T Abs. capacity (FEPT) +** n s + ** − ** +** + * + ** ns +*** +*** +*** +*** +*** +*** +*** ns Incoming spill. (SPILLIN) +** + ** ns ns ns +** − * n s + *** +*** +*** +*** +*** +*** +*** +*** Appropriability (APPR)) +*** +*** ns ns ns +*** ns ns +*** +*** +*** +* +** + *** +*** +** Risk-sharing (ORISK) ns ns ns ns ns ns ns ns +** + *** ns ns +*** ns ns ns Cost-sharing (OFIN) ns ns +** n s n s + * n s n s n s n s + ** ns ns ns ns ns + /− : positi v e/ne g ati v e coefficient, *, ** and *** denote statistically significance at the 10, 5 and 1 % test-le v el; ns : statistically insignificant at the 10 % test le v el
Ta b le 7 Multinomial probit m odel estimates for C OOP_N A T_INT = 1 (only national cooperation; ref. cat.: n o cooperation) Pooled Manuf acturing Service BE CH GE NO PT FEPT 0.025** − 0. 037 0.086** − 0. 677** 0.298** 0.114* 0.091** 0 .143 (0.046) (0.077) (0.062) (0.286) (0.178) (0.103) (0.084) (0.177) OSKILL − 0. 023** − 0. 016 − 0. 040 * − 0. 014 − 0. 002 − 0. 030 − 0. 047* − 0. 014 (0.011) (0.013) (0.022) (0.028) (0.017) (0.020) (0.028) (0.034) SPILLIN 0 .007*** 0.012*** − 0. 009 − 0. 010 0.006 0.019** − 0. 012* 0 .011 (0.011) (0.013) (0.022) (0.028) (0.020) (0.021) (0.024) (0.032) APPR 0.017*** 0.021*** 0.014 0.022 0.012 0.082*** − 0. 046 0.018 (0.012) (0.014) (0.022) (0.032) (0.016) (0.026) (0.026) (0.032) ORISK − 0. 004 0.002 − 0. 024 − 0. 044 0.005 − 0. 007 0.015 0 .003 (0.011) (0.013) (0.022) (0.031) (0.017) (0.022) (0.028) (0.033) OFIN 0 .007 − 0. 004 0.040** 0.031 − 0. 003 0.036* − 0. 015 − 0. 012 (0.012) (0.013) (0.022) (0.028) (0.018) (0.022) (0.029) (0.033) INVPT − 0. 052 − 0. 034 − 0. 076 0.037 0.022 − 0. 013 − 0. 277** − 0. 192 (0.040) (0.049) (0.072) (0.165) (0.034) (0.101) (0.119) (0.117) PUBFIN 0 .118*** 0.108*** 0.140*** 0.097*** 0.026 0.126*** 0.187*** 0.110*** (0.011) (0.013) (0.023) (0.028) (0.030) (0.020) (0.026) (0.036) GR OUP 0.011*** 0.003** 0.034* 0.001 0.022* 0.002 − 0. 003* 0.073*** (0.012) (0.014) (0.022) (0.033) (0.015) (0.024) (0.027) (0.034) FOREIGN − 0. 085*** − 0. 077*** − 0. 113*** − 0. 036 − 0. 031 − 0. 040 − 0. 144*** − 0. 207*** (0.018) (0.021) (0.034) (0.034) (0.025) (0.040) (0.038) (0.065) MARKET_2 − 0. 023 − 0. 007 − 0. 033 − 0. 036 − 0. 031 − 0. 014 − 0. 039 0 .017 (0.014) (0.018) (0.022) (0.038) (0.022) (0.030) (0.028) (0.044) MARKET_3 − 0. 038 − 0. 010 − 0. 118*** − 0. 060 − 0. 045* − 0. 029 − 0. 093 0.098** (0.015) (0.019) (0.030) (0.038) (0.021) (0.031) (0.034) (0.049)
Ta b le 7 Continued Pooled Manuf acturing Service BE CH GE NO PT SIZE_2 0 .019 0.021 0.007 0.016 0.002 0.020 − 0. 018 0.054 (0.014) (0.017) (0.025) (0.033) (0.017) (0.027) (0.036) (0.043) SIZE_3 0 .034*** 0.027*** 0.039*** 0.045* − 0. 009 0.016** 0.055*** 0.086** (0.014) (0.017) (0.026) (0.039) (0.022) (0.029) (0.029) (0.043) SECT OR_2 − 0. 126*** − 0. 130 *** − 0. 154** − 0. 020 − 0. 106* − 0. 238*** − 0. 119 (0.028) (0.028) (0.092) (0.036) (0.077) (0.056) (0.101) SECT OR_3 − 0. 118*** − 0. 122*** − 0. 185** − 0. 065* − 0. 048 − 0. 231*** − 0. 119 (0.026) (0.026) (0.088) (0.031) (0.070) (0.057) (0.098) SECT OR_4 − 0. 108*** − 0. 115*** − 0. 137* − 0. 062** − 0. 066 − 0. 204*** − 0. 090 (0.025) (0.026) (0.089) (0.029) (0.068) (0.054) (0.096) SECT OR_5 − 0. 090 *** − 0. 007 − 0. 146* − 0. 060 * − 0. 047 − 0. 145*** − 0. 007 (0.027) (0.022) (0.090) (0.032) (0.071) (0.056) (0.100) SECT OR_6 − 0. 080 *** − 0. 153* − 0. 019 − 0. 036 − 0. 184*** − 0. 078 (0.027) (0.093) (0.031) (0.072) (0.056) (0.107) COUN_BE 0.009 0.027 − 0. 021 (0.027) (0.032) (0.051) COUN_DE 0.073** 0.082* 0.052 (0.021) (0.024) (0.039) COUN_NO 0.102*** 0.114*** 0.084** (0.021) (0.025) (0.040) COUN_PT 0.074** 0.080** 0.060 (0.023) (0.027) (0.048) Constant − 1. 510 *** − 1. 641*** − 1. 886*** − 0. 061 − 1. 774*** − 1. 967*** − 0. 124 − 1. 863*** (0.210) (0.242) (0.262) (0.886) (0.351) (0.423) (0.314) (0.695)
Ta b le 8 Multinomial probit m odel estimates for C OOP_N A T_INT = 2 (also international cooperation; ref. cat.: n o cooperation) Pooled Manuf acturing Service BE CH GE NO PT FEPT 0.269*** 0.331*** 0.194*** 0.537*** 0.987*** 0.236*** 0.308*** − 0. 102 (0.042) (0.069) (0.047) (0.146) (0.231) (0.077) (0.081) (0.155) OSKILL 0.004 0.001 0.013 − 0. 008 0.033* − 0. 006 − 0. 004 − 0. 008 (0.011) (0.013) (0.019) (0.036) (0.020) (0.017) (0.025) (0.029) SPILLIN 0 .091*** 0.101*** 0.074*** 0.097*** 0.063*** 0.070*** 0.144*** 0.073*** (0.011) (0.013) (0.018) (0.036) (0.021) (0.018) (0.023) (0.028) APPR 0.087*** 0.098*** 0.055*** 0.065* 0.044** 0.085*** 0.151*** 0.068** (0.012) (0.015) (0.020) (0.041) (0.019) (0.026) (0.029) (0.030) ORISK 0 .028** 0.042*** − 0. 008 0.047 0.057*** 0.008 − 0. 002 0.034 (0.011) (0.014) (0.019) (0.039) (0.019) (0.020) (0.026) (0.028) OFIN 0 .009 − 0. 004 0.035** − 0. 052 0.029 0.009 0.037 0.005 (0.012) (0.014) (0.020) (0.040) (0.023) (0.019) (0.027) (0.028) INVPT 0.035 0.027 0.018 − 0. 746*** 0.022 0.147* − 0. 049 0 .183 (0.040) (0.051) (0.062) (0.277) (0.052) (0.079) (0.104) (0.104) PUBFIN 0 .094*** 0.093*** 0.094*** 0.147*** 0.140*** 0.068*** 0.070*** 0.082*** (0.011) (0.013) (0.020) (0.033) (0.031) (0.017) (0.025) (0.030) GR OUP 0.078*** 0.107*** 0.012 0.059 0.057*** 0.043** 0.130*** 0.113*** (0.012) (0.015) (0.020) (0.046) (0.022) (0.020) (0.029) (0.030) FOREIGN 0.040 0.051* 0.022 0.041 0.008 0.054 0.097* − 0. 015 (0.014) (0.017) (0.026) (0.043) (0.026) (0.027) (0.031) (0.040) MARKET_2 0 .050*** 0.032 0.065*** 0.052 0.021 0.068** 0.065* 0.013 (0.016) (0.021) (0.022) (0.060) (0.029) (0.032) (0.031) (0.039) MARKET_3 0 .100*** 0.080*** 0.126*** 0.092 0.061* 0.127*** 0.131*** 0.015 (0.016) (0.020) (0.024) (0.058) (0.026) (0.032) (0.032) (0.045)
Ta b le 8 continued Pooled Manuf acturing Service BE CH GE NO PT SIZE_2 0 .008 − 0. 011 0.055*** 0.025 0.000 0.041* 0.017 0 .027 (0.014) (0.018) (0.022) (0.044) (0.024) (0.028) (0.036) (0.040) SIZE_3 0 .083*** 0.066*** 0.109*** 0.091** 0.073*** 0.147*** 0.045** 0.044* (0.014) (0.017) (0.022) (0.046) (0.027) (0.029) (0.029) (0.040) SECT OR_2 − 0. 030 ** − 0. 026** − 0. 160 0.043 − 0. 063 − 0. 025* − 0. 071 (0.031) (0.032) (0.150) (0.059) (0.058) (0.061) (0.089) SECT OR_3 − 0. 034** − 0. 032** − 0. 149 0.042 − 0. 097** − 0. 047** − 0. 029 (0.029) (0.030) (0.144) (0.052) (0.052) (0.061) (0.085) SECT OR_4 − 0. 042*** − 0. 039** − 0. 197 0.004 − 0. 095** − 0. 033* − 0. 020 (0.028) (0.029) (0.146) (0.050) (0.051) (0.058) (0.084) SECT OR_5 − 0. 018 0.021 − 0. 164 − 0. 015 − 0. 049 − 0. 026 − 0. 030 (0.030) (0.019) (0.148) (0.057) (0.054) (0.062) (0.089) SECT OR_6 − 0. 044** − 0. 159 − 0. 007 − 0. 025 − 0. 124*** − 0. 058 (0.030) (0.150) (0.054) (0.054) (0.064) (0.090) COUN_BE − 0. 046* − 0. 067** − 0. 006 (0.024) (0.030) (0.041) COUN_DE − 0. 111*** − 0. 130 *** − 0. 069 (0.021) (0.026) (0.037) COUN_NO − 0. 022 − 0. 031 0.003 (0.021) (0.026) (0.035) COUN_PT − 0. 084*** − 0. 086** − 0. 073 (0.025) (0.030) (0.044)
Ta b le 8 continued Pooled Manuf acturing Service BE CH GE NO PT Constant − 2. 757*** − 2. 747*** − 3. 179*** − 1. 532* − 3. 363*** − 3. 727*** − 2. 607*** − 3. 189*** (0.239) (0.266) (0.299) (0.925) (0.443) (0.465) (0.405) (0.824) N 4 ,250 3,034 1,216 428 980 1,314 1,068 460 W ald chi2 935.595 717.528 291.739 126.445 158.214 273.265 310.454 114.999 Prob > chi2 0 .000 0.000 0.000 0.000 0.000 0.000 0.000 0.000 *, ** and *** denote significances of marginal ef fects at the 10, 5 and 1 % test-le v el; T able reports marginal ef fects and h eteroscedasticity-rob u st stan dard errors (White procedure). T esting w hether sector/country dummies are jointly significant y ields p v alues belo w 1 %. A C ho w-type lik elihood ratio test rejects the pooling o f countries and sectors with p v alues of 0.001 and 0 .02, respecti v ely
Thus, there is little support for hypothesis1coming from this variable, presumably because of the nature of the proxy used that does not allow a direct measurement of human capital endowment.
These results coincide with the findings ofWoerter(2011) for Switzerland.Faria and
Schmidt(2007) find a significantly positive impact of human capital endowment for both Germany and Portugal based on a different specification of this variable (dummy variable with the value 1 when a firm has a share of employees with tertiary-level education higher than the sample median).
In accordance with hypothesis2, we find a significantly positive effect of
incom-ing spillovers (SPILLIN) for both national (only pooled manufacturincom-ing) and interna-tional cooperation (both pooled sectors). At the county level, the effect for nainterna-tional cooperation is significantly positive only for Germany and is negative for Norway, though only marginally significant. For international cooperation, the effect is signifi-cantly positive in all equations. Furthermore, the marginal effect is substantially larger for international cooperation, which suggests that incoming spillovers are larger in the international context.
Faria and Schmidt(2007) found no significant effect for their variable that
mea-sured overall incoming spillovers for Germany and Portugal.Abramovsky et al.(2009)
obtained a positive effect of incoming spillovers (also measured by an overall variable) for Germany after taking into account the endogeneity of this variable.
In accordance with hypothesis3and the existing empirical evidence, the variable
for appropiability (APPR) generally shows a positive effect on cooperation. However, in the case of national cooperation the variable for appropriability is statistically signif-icant only for the pooled manufacturing sector, for which intellectual property rights are in general more important than for the service sector. At the country level, only the marginal effect for Germany is significantly positive. By contrast, the marginal effects of the appropriability variable for international cooperation are throughout positive and statistically significant.
We interpret the positive sign of this variable as evidence in favour of the assump-tion of high appropriability (low level of outgoing spillovers) influencing positively the cooperation propensity. This finding is also in accordance with the theoretical expectation that appropriability that is based on legal protection or secrecy etc. is
more important for international than national cooperation (see Sect.2).
The results for Germany and Portugal are in line with the findings ofFaria and
Schmidt(2007) and those for Germany are also in accordance withAbramovsky et al.
(2009). The positive significant effect on national cooperation in Germany might
reflect the large size of the domestic economy, which provides firms with more pos-sible sources of innovation-relevant information cooperation partners than do small countries’ economies.
As expressed in hypotheses 4 and 4a, the theoretical expectation with respect
to innovation risk (as measured by the variable ORISK as a proxy for the risk-sharing motive of cooperation) is that the perspective of risk-risk-sharing increases the cooperation propensity of firms, especially for international cooperation. In line with the higher uncertainty in an international environment, we find partial evidence for the presence of this positive effect in the context of international cooperation agree-ments, as the variable ORISK is significant for manufacturing and for Switzerland.
Miotti and Sachwald(2003), who use a similar variable in their study do not find a strong relationship for France.
Obstacles with respect to the availability of financing (OFIN) serve as a proxy for the cost-sharing motive for cooperation. It does not affect the decision to cooperate significantly. However, we found a significantly positive effect for the pooled service sector both for national and international cooperation. At the country level, only the effect on national cooperation for Germany is significant. Hence, there is no
confir-mation for hypotheses5and5a.
The positive effect of public finance support (variable PUBFIN) on the propensity to cooperate both nationally and internationally for all countries reflects, even if it can-not be causally interpreted, the common goal of technology policy in most countries to foster cooperation by providing subsides under the condition of cooperation either with universities or other firms.
In the group of variables that capture the market environment, operating in regional, national or international markets does not make a difference for national cooperation at country level with the exceptions of Switzerland, where firms that operate in interna-tional markets show a lower propensity for nainterna-tional cooperation than firms operating in regional markets and Portugal, where the marginal effect is positive. At more aggre-gate level, we found that service firms with international orientation of their activities in general tend to cooperate less at the national level than other firms. On the contrary, firms operating in international markets show not astonishingly a significantly higher inclination for international cooperation than firms with regional or national action radius.
Furthermore, being a member of an enterprise group (variable GROUP) increases the likelihood of cooperation, both at the national and international level. This effect is stronger for international cooperation. In the regressions for the pooled, the manufac-turing and services sample as well as in Norway and Portugal the variable FOREIGN has a significantly negative sign, implying that the propensity to cooperate only at a national level is lower for foreign firms. In Belgium, Switzerland, and Germany there appears to be no difference between domestic and foreign firms with respect to cooperative behaviour. Foreign firms show a higher propensity for international coop-eration than do domestic firms. This effect could be found for pooled manufacturing and for Norway at the country level.
Large firms with more than 250 employees cooperate within national borders more frequently than do SMEs. For international cooperation, the marginal effect of the dummy variable for larger firms is significantly positive in all countries and larger than for national cooperation.
5.2 Innovation Output
In a second step we analyse the impact of innovation cooperation (instrumented, when appropriate) on the innovation performance of firms by estimating a Tobit model, where the dependent variable is the share of sales that are generated by innovative (new and considerably modified) products. Also in this case a Chow-type likelihood ratio test rejects pooling countries and sectors with p values of 0.000 and 0.008,
Table 9 Innovation equations; summary results
Pooled Manuf Service BE CH GE NO PT
National cooperation ns ns ns ns ns ns ns ns
International cooperation +*** +*** +*** ns +*** +** +*** +*** Instrumented NATCOOP variable for DE and NO and instrumented ITCOOP variable in all equations except BE and PT;+/−: positive /negative coefficient, *, ** and *** denote statistically significance at the 10, 5 and 1 % test-level; ns: statistically insignificant at the 10 % test level
respectively. The results are summarised in Table9, and the detailed results are found
in Table10.
The results exhibit no evidence for an effect of the dummy variable for national cooperation (NATCOOP) on innovation performance. International cooperation (INT-COOP), on the other hand, is clearly positively correlated to innovation performance. The coefficients are significantly positive in all regressions with the exception of that for Belgium. There are no discernible differences between the manufacturing and the sector service.
These results are in line with the findings of Miotti and Sachwald (2003) that
show that in France innovation performance is not affected by cooperation agree-ments with national partners but is positively affected by cooperation with foreign
partners. Similarly,Lööf(2009) finds for Swedish firms that innovation performance
is positively affected by the presence of foreign cooperation partners in the network. A possible explanation for this difference between national and international cooperation may be given by different motives behind the two types of coopera-tion. More knowledge-oriented motives (e.g., utilization of technological synergies; access to specialized technology) could be expected to be primarily drivers of inter-national cooperation because the likelihood to find such partners interinter-nationally is
higher than inside a single country, especially inside a small single country (Miotti
and Sachwald 2003). Moreover, such motives seem to enhance stronger innovation performance than more cost-oriented motives (e.g., saving of R&D costs) that tend to
improve overall firm efficiency (Arvanitis 2008). If knowledge-oriented motives are
predominant in international cooperation, then it is not astonishing that the impact of international cooperation on innovation shows to be significantly larger than that of national cooperation.
In accordance with our expectations, the intensity of innovation or R&D expendi-tures (FEPT) is positively correlated with the share of innovative products. Exceptions are Belgium and Germany, where the coefficient is positive but insignificant.
As to the control variables, we find a counterintuitive negative effect for investment intensity (INVPT) in the regressions for Norway and Portugal that render the effect in the pooled and manufacturing equations negative as well. The variable remains insignificant in the other regressions. This finding might reflect the specific indus-try structure of Portugal and Norway, where oil refineries, cement production and paper manufacturing are among the major industries; these are industries that are not particularly innovative industries but quite investment-intensive. In four of the five countries (except Germany) foreign firms are as innovative as are domestic firms.
Ta b le 1 0 T obit estimates for N EWS including N A TCOOP and INTCOOP DEP: NEWS Pooled M anuf acturing Services BE CH GE NO PT N A TCOOP − 0. 364 0.369 − 1. 562 − 6. 088 − 2. 596 2.814 − 0. 640 − 0. 756 (1.148) (1.525) (2.145) (3.986) (3.512) (2.028) (1.766) (4.830) INTCOOP 26.001*** 28.245*** 25.773*** 3.035 24.693*** 42.663*** 22.346*** 20.425*** (3.442) (3.332) (6.377) (2.833) (7.732) (8.369) (4.789) (4.843) FEPT 23.055*** 1 2.115* 29.542*** 16.369 67.115** 18.647 24.410*** 33.291* (5.301) (6.840) (7.635) (11.448) (29.387) (11.431) (7.835) (19.242) INVPT − 7. 057 ** − 9. 929 ** 2.136 − 2. 614 1.002 1.515 − 16 .574 ** − 42 .144 *** (2.964) (4.497) (5.399) (12.272) (4.269) (9.304) (6.922) (13.925) FOREIGN − 0. 747 − 1. 421 − 0. 681 − 0. 823 3.477 − 6. 076 ** − 2. 509 3.863 (1.192) (1.482) (2.409) (2.949) (2.218) (2.778) (2.165) (4.863) SIZE_2 − 2. 704 ** − 1. 826 − 5. 804 *** 7.848*** − 6. 974 *** − 3. 833 * − 3. 517 3.760 (1.135) (1.336) (2.069) (2.753) (1.959) (2.037) (2.542) (4.396) SIZE_3 − 6. 913 *** − 6. 440 *** − 9. 603 *** 3.588 − 11 .168 *** − 9. 674 *** − 7. 143 *** − 0. 838 (1.277) (1.379) (2.333) (3.544) (2.966) (2.883) (1.907) (4.530) SECT OR_2 6.017** 6 .219** 10.357 6 .869 9.290 5 .105 − 2. 834 (2.613) (2.651) (7.506) (4.659) (6.184) (3.754) (17.253) SECT OR_3 5.460** 5 .646** 16.940** 0.357 10.245* 3.090 − 3. 918 (2.501) (2.478) (7.363) (4.489) (5.702) (3.714) (17.254) SECT OR_4 15.307*** 15.397*** 25.613*** 13.094*** 15.795*** 15.872*** 4.662 (2.557) (2.450) (7.248) (4.006) (5.663) (3.720) (17.047) SECT OR_5 7.274*** − 8. 027 *** 19.036** 5.190 6.881 8.762** − 4. 418 (2.546) (1.845) (7.438) (4.253) (5.646) (3.473) (17.523)
Ta b le 1 0 Continued DEP: NEWS Pooled Manuf acturing Services BE CH GE NO PT SECT OR_6 16.716*** 32.712*** 8.184* 15.039** 20.478*** 9.314 (2.764) (8.127) (4.601) (6.008) (4.173) (18.045) COUN_BE − 23 .094*** − 25 .118*** − 17 .367*** (1.795) (2.413) (3.088) COUN_DE − 12 .342*** − 12 .702*** − 10 .259*** (1.410) (2.058) (2.735) COUN_NO − 14 .737*** − 17 .149*** − 8. 339*** (1.601) (2.192) (2.849) COUN_PT − 16 .977*** − 17 .982*** − 12 .883*** (1.932) (2.522) (4.526) Constant 21.320*** 22.354*** 33.686*** − 12 .789* 22.765*** 6.226 8.156** 11.652 (2.737) (3.419) (3.022) (7.465) (4.201) (5.806) (3.829) (16.810) N 4 ,250 3,034 1,216 428 980 1,314 1,068 460 W ald chi2 539.019 421.772 168.879 131.063 108.301 225.239 Prob > chi2 0 .000 0.000 0.000 0.000 0.000 0.000 0.000 0 .000 Left-censored 657 475 182 94 72 236 110 1 45 Instrumented N A TCOOP v ariable for D E and NO and instrumented INTCOOP v ariable in all equations ex cept B E and PT ; * , * * and *** denote significance at th e1 0 , 5 and 1 % test-le v el; T able reports marginal ef fects on the latent v ariable and bootstrapped standard errors in parantheses. T esting w hether sector/c ountry dummies are jointly significant y ields p v alues belo w 1 %. A C ho w-type Lik elihood ratio test rejects pooling countries and sectors with p v alues of 0.000 and 0 .008, respecti v ely
The effect of size is ambiguous, as it is positive in Belgium and negative in Switzer-land, Germany and Norway.
6 Summary and Conclusions
Fostering innovation cooperation constitutes an important element of innovation policy around the globe but especially in Europe. In order to select the optimal policy instruments, politicians require information on both the determinants and the impact of different cooperation forms. This paper adds to the literature by providing informa-tion about determinants and impact of two major categories of innovainforma-tion cooperainforma-tion:
national and international cooperation, across 5 European countries. Tables6and9
summarize the results.
With respect to the determinants of innovation cooperation, we find that absorp-tive capacity, incoming spillovers, and high appropriability foster both national and international cooperation, but the effect is more pronounced for international cooperation. Risk-sharing as a motive of cooperation appears to be weak and primarily for international cooperation. Cost-sharing has no relevance as a cooper-ation motive. Finally, we find evidence that public support fosters cooperative behav-iour, thereby supporting the potential effectiveness of public policy instruments in this respect.
On the whole, despite the structural heterogeneity of the investigated countries, we find similar determinants and impacts of innovation cooperation, although Chow-like Chow-likelihood ratio tests indicated that the countries ought not to be pooled for analysis. Greater differences are detected between the pooled manufacturing and the pooled service sector, presumably due to sectoral differences in the nature of innova-tions.
Our analysis of the impact of innovation cooperation shows that international coop-eration exerts a significantly positive effect on innovation performance, while national cooperation remains insignificant. If knowledge-oriented motives are predominant in international cooperation because of the higher likelihood to find technologically high-qualified partners internationally, then it is not astonishing that the impact of international cooperation on innovation shows to be significantly larger than that of national cooperation.
Our results have two main policy implications. First, the engagement in some coop-eration projects appears to exert a positive influence on firm innovation output; thus policy instruments that promote innovation cooperation may contribute to an increase of innovation output. Second, the choice of cooperation partner—national or inter-national—matters. Notably, while the effectiveness of policy instruments fostering national cooperation agreements is questionable, instruments that facilitate interna-tional cooperation clearly increase innovation output. Potential instruments include fiscal facilitation and/or subsidies that encourage involvement in such projects (see,
e.g.,Audretsch et al. 2002).
Acknowledgments This study was financed by the Swiss National Science Foundation SNSF. Comments and suggestions of the participants of the Conference on Neo-Schumpeterian Economics 09, Trest, Czech, June 2009, the General Editor of this Journal and two anonymous referees are gratefully acknowledged.
References
Abramovsky, L., Kremp, E., Lopez, A., Schmid, T., & Simpson, H. (2009). Understanding coopera-tive R&D activity: Evidence from four European countries. Economics of Innovation and New
Technology, 18(3), 243–265.
Aldieri, L., & Cincera, M. (2009). Geographic and technological R&D spillovers within the triad: Micro evidence from US patents. Journal of Technology Transfer, 34, 196–211.
Arvanitis, S. (2008). How Do different motives for R&D cooperation affect firm performance?—An
analysis based on Swiss micro data. KOF Working Papers No. 233, Zurich.
Arvanitis, S., & Hollenstein, H. (2004). Firm panel data from the Swiss innovation survey. Schmollers
Jahrbuch, 124(2), 305–314.
Audretsch, D. B., Bozeman, B., Combs, K. L., Feldman, M., Link, A. N., Siegel, D. S., Stephan, P., Tassey, G., & Wessner, C. (2002). The economics of science and technology. Journal of Technology
Transfer, 27, 155–203.
Bathelt, H., Malmberg, A., & Maskell, P. (2003). Clusters and knowledge: Local buzz, global pipelines and the process of knowledge creation. Progress in Human Geography, 28, 31–56.
Belderbos, R., Carree, M., Diesderen, B., Lokshin, B., & Veugelers, R. (2004a). Heterogeneity in R&D cooperation strategies. International Journal of Industrial Organization, 22, 1237–1263. Belderbos, R., Carree, M., & Lokshin, B. (2004b). Cooperative R&D and firm performance. Research
Policy, 33, 1477–1492.
Boardman, C., & Gray, D. (2010). The new science and engineering management: Cooperative research centers as government policies, industry strategies, and organizations. Journal of Technology
Transfer, 35, 445–459.
Bönte, W., & Keilbach, M. (2005). Concubinage or marriage? Informal and formal cooperations for innovation. International Journal of Industrial Organization, 23, 279–302.
Boschma, R. A. (2005). Proximity and innovation: A critical assessment. Regional Studies, 39(1), 61–74. Bottanzi, L., & Peri, G. (2003). Innovation and spillovers in regions: Evidence from European patent
data. European Economic Review, 47, 687–710.
Caloghirou, Y., Ioannides, S., & Vonortas, N. S. (2003). Research joint ventures: A critical survey of the theoretical and empirical literature. Journal of Economic Surveys, 17(4), 541–570.
Caloghirou, Y. & Vonortas, N. S. (2000). Science and technology policies towards research joint ventures,
Final Report, Project SOE1-CT97-1075, TSER. European Commission, DG XII, Brussels.
Cassiman, B., & Veugelers, R. (2002). R&D cooperation and spillovers: Some empirical evidence from Belgium. American Economic Review„ 92(4), 1169–1184.
Cohen, W. M., & Levinthal, D. A. (1989). Innovation and learning: The two faces of R&D. Economic
Journal, 99, 569–596.
Cohen, W. M., & Levinthal, D. A. (1990). Absorptive capacity: A new perspective on learning and innovation. Administrative Science Quarterly, 35, 128–152.
Cooke, P. (2006). Global bioregions: Knowledge domains, capabilities and innovation system net-works. Industry and Innovation, 13(4), 437–458.
Czarnitzki, D. & Fier, A. (2003). Publicly funded R&D collaboration and patent outcome in Germany. ZEW Discussion Paper No. 03-24, Center for European Economic Research, Mannheim. D’Aspremont, C., & Jacquemin, A. (1988). Cooperative and non-cooperative R&D in duopoly with
spillovers. American Economic Review, 78(5), 1133–1137.
De Bondt, R. (1996). Spillovers and innovative activities. International Journal of Industrial
Organi-zation, 15, 1–28.
Eurostat. (2001). The third community innovation survey: Methodological recommendations.http://kis.
stepi.re.kr/upload/kis/public_data/CIS3quest_20_02_2001.pdf.
Faria, P. & Schmidt, T. (2007). International cooperation on innovation: Empirical evidence for German
and Portuguese firms. ZEW Discussion Paper No. 07-060, Center for European Economic Research,
Mannheim.
Glaister, K. W., & Buckley, P. J. (1996). Strategic motives for international alliance formation. Journal
of Management Studies, 33, 301–332.
Hagedoorn, J., Link, A. N., & Vonortas, N. S. (2000). Research partnerships. Research Policy, 29(4–5), 567–586.
Hart, D., & Simmie, J. (1997). Innovation, competition and the structure of local production networks: Initial findings from the Hertfordshire project. Local Economy, 12(3), 235–246.