HAL Id: hal-03066020
https://hal.archives-ouvertes.fr/hal-03066020
Submitted on 15 Dec 2020
HAL is a multi-disciplinary open access
archive for the deposit and dissemination of
sci-entific research documents, whether they are
pub-lished or not. The documents may come from
teaching and research institutions in France or
abroad, or from public or private research centers.
L’archive ouverte pluridisciplinaire HAL, est
destinée au dépôt et à la diffusion de documents
scientifiques de niveau recherche, publiés ou non,
émanant des établissements d’enseignement et de
recherche français ou étrangers, des laboratoires
publics ou privés.
Tracy L. Beck, G. H. Schaefer, S. Guilloteau, M. Simon, A. Dutrey, E. Di
Folco, E. Chapillon
To cite this version:
Tracy L. Beck, G. H. Schaefer, S. Guilloteau, M. Simon, A. Dutrey, et al.. On the Nature of the
T Tauri Triple System. The Astrophysical Journal, American Astronomical Society, 2020, 902 (2),
pp.132. �10.3847/1538-4357/abb5f5�. �hal-03066020�
On the Nature of the T Tauri Triple System
Tracy L. Beck,1 G. H. Schaefer,2S. Guilloteau,3 M. Simon,4 A. Dutrey,3E. Di Folco,3 and E. Chapillon3,5 1The Space Telescope Science Institute, 3700 San Martin Drive, Baltimore, MD 21218, USA a
2The CHARA Array of Georgia State University, Mount Wilson Observatory, Mount Wilson, CA 91023, USA
3Laboratoire dAstrophysique de Bordeaux, Universit de Bordeaux, CNRS, B18N, Alle Geoffroy Saint-Hilaire, 33615 Pessac, France 4Department of Physics and Astronomy, Stony Brook University, Stony Brook, NY 11794, USA
5IRAM, 300 Rue de la Piscine, 38406 Saint Martin dHres Cedex, France
(Accepted for publication in the Astrophyisical Journal, September 5, 2020) ABSTRACT
We present a multi-wavelength analysis to reveal the nature of the enigmatic T Tauri triple star system. New optical and infrared measurements are coupled with archival X-ray, UV and mm datasets to show morphologies of disk material and outflow kinematics. A dark lane of obscuring material is seen in silhouette in several emission lines and in model-subtracted ALMA mm continuum dust residuals near the position of T Tau Sa+Sb, revealing the attenuating circumbinary ring around T Tau S. The flux variability of T Tau S is linked in part to the binary orbit; T Tau Sb brightens near orbital apastron as it emerges from behind circumbinary material. Outflow diagnostics confirm that T Tau N powers the blue-shifted western outflow, and the T Tau S binary drives the northwest-southeastern flow. Analysis of the southern outflow shows periodic arcs ejected from the T Tau system. Correlation of these arc locations and tangential kinematics with the orbit timing suggests that launch of the last four southern outflow ejections is contemporaneous with, and perhaps triggered by, the T Tau Sa+Sb binary periastron passage. We present a geometry of the T Tau triple that has the southern components foreground to T Tau N, obscured by a circumbinary ring, with mis-aligned disks and interacting outflows. Particularly, a wind from T Tauri Sa that is perpendicular to its circumstellar disk might interact with the circumbinary material, which may explain conflicting high contrast measurements of the system outflows in the literature. T Tauri is an important laboratory to understand early dynamical processes in young multiple systems. We discuss the historical and future characteristics of the system in this context.
Keywords: stars: pre-main sequence — stars: circumstellar disks — stars: winds, outflows — stars: variables: T Tauri, Herbig Ae/Be — stars: formation — stars: binaries (including multiple): general — stars: individual (T Tau)
1. INTRODUCTION
T Tauri is the eponymous pre-main sequence sun-like star (Joy 1945), but investigation over the past 30 years has
revealed that it is a remarkable member of this class of young stars. T Tau was identified as an interesting variable
star in the 1800’s, particularly when the associated extended nebula 20-3000 to the west disappeared from detection
in the 1860’s (Hind 1864). Hind’s variable nebula underwent multiple dimming events throughout the late 1800s and
early 1900s, and was the first astronomical nebula confirmed to vary in brightness level (Burnham 1890). In 1890,
Burnham reported on low level nebulous emission surrounding T Tau, with a prominent ∼400extension at a position
angle (PA) of ∼151◦. This nebula, now designated Burnham’s nebula, has also varied in morphology and brightness
over its observation history (Burnham 1890;Struve 1862;Robberto et al. 1995). T Tau itself was historically seen to
flicker in brightness in optical wavelengths, from its peak level at Vmag ∼9.5 to fainter than the detection limit on
Corresponding author: Tracy L. Beck a[email protected]
Figure 1. An optical broadband g, i and z three-color image of T Tauri and its surrounding environment, including Hind’s variable nebula, NGC 1555, to the west. The image display scale enhances the low level extended emission in the environment of T Tau, but as a result the southern arc-like extensions of Burnham’s nebula are overwhelmed by central stellar flux. Observations were acquired using the GMOS imaging camera at the Gemini North Observatory (Table1).
photographic plates (<13.5-14th magnitude;Lozinskii (1949); Beck & Simon (2001)). Figure 1presents a three color optical view of T Tau, revealing the optical star and its surrounding nebulosities.
The T Tau triple star system consists of the optical star, T Tau North (T Tau N), and the infrared binary, T Tau
South (T Tau S), at a separation of 0.007 to the south (Dyck et al. 1982). T Tau S has never been detected in the
optical, to a limiting V magnitude of 19.6 (Stapelfeldt et al. 1998). Koresko (2000) discovered that T Tau S is itself a binary with a projected spatial separation of ∼7 AU (∼0.0005) at the time of its discovery observation in 1997. The stars of the T Tau S binary, designated Sa and Sb, have been monitored for the past two decades for orbital motion using high resolution near-infrared (IR) adaptive optics imaging (Schaefer et al. 2006; K¨ohler et al. 2008; Schaefer et al. 2014;Cs´ep´any et al. 2015;Kasper et al. 2016;K¨ohler et al. 2016;Schaefer et al. 2020). In this time, the T Tau
S binary has been mapped through more than two thirds of its 27.2±0.7 year orbit (Schaefer et al. 2020). The total
mass of T Tau S is ∼2.5-2.7M , T Tau Sb is 0.4-0.5M and Sa is 2.0-2.3M , based on the most recent published
dynamical model of the orbit (Schaefer et al. 2020). The range of the derived mass values depend on the distance
adopted for the T Tau system (Schaefer et al. 2020); 143.7pc from Gaia DR2 (Bailer-Jones et al. 2018), or 148.7pc
from VLBI measurements (Xu et al. 2019). Recent IR spectral measurements find evidence for a cooler photospheric
temperature and later spectral type for T Tau N;Flores et al.(2020) postulate that it is lower mass and young, while
Schaefer et al.(2020) argue for variable star spot activity. Although T Tau N is one of the most luminous T Tauri stars within 200pc of the sun and T Tau S is optically undetected, the orbital models reveal that T Tau Sa is the most massive star in this young triple system. Our reference to ”T Tau S” throughout this document is to the combined T Tau Sa+Sb binary system.
T Tau N is among one the brightest Classical T Tauri Stars (CTTSs) in the Taurus-Auriga association of young
stars. The T Tau system is known to have natal envelope material in its surrounding environment (Momose et al.
1996;Schuster et al. 1997), which suggests that this triple system is on the young side for T Tauri Stars (TTSs;Adams et al.(1987); Lada(1987)). HR diagram analysis with modern stellar models span a wide range: T Tau N is either
at an older state with star spot activity (to 4 Myr; Schaefer et al. (2020)), or younger with a cooler photospheric
temperature and hence lower mass (Flores et al. 2020). T Tau N also exhibited rampant historical optical variability
with more than 3 magnitudes of brightness variation, a defining characteristic of the T Tauri class of stars (Joy 1945), which ceased abruptly in the 1920s (Lozinskii 1949;Beck & Simon 2001). The near-IR K magnitudes of T Tau N were
found to be stable with a low level of variability in monitoring measurements (Beck et al. 2004;Schaefer et al. 2020).
By contrast, the IR flux of the combined T Tau S binary system has varied wildly. Ghez et al. (1991) discovered a
∼2 magnitude flare in the brightness of T Tau S from 2 through 10µm, and attributed the increase to an accretion
outburst in the system. Beck et al. (2004) found that the near-IR flux of the combined T Tau S binary can change
drastically on timescales of a week with a redder when faint character, suggesting that variable obscuration along the line of sight may play a role in the fluctuation. van Boekel et al.(2010) also found that the mid-IR flux of T Tau S can change measurably over several nights, and they present a model that incorporates rapid changes in accretion to
explain the mid-IR emission heating of dust in the inner disk. Moreover,van Boekel et al. (2010) further postulated
that IR variability characteristics of the combined T Tau S system may be linked to the binary orbital motion, perhaps from pulsed accretion onto T Tau Sa as Sb passes at periastron.
The T Tau triple system has evidence for non-coplanar circumstellar disks and two nearly perpendicular outflows (B¨ohm & Solf 1994;Hogerheijde et al. 1997; Akeson et al. 1998;Solf & B¨ohm 1999;Beck et al. 2004;Duchˆene et al. 2005;Manara et al. 2019). Each of the three stars has a circumstellar disk, with mass accretion measured by atomic hydrogen emission transitions that trace accretion flows from a disk onto a young star (Kasper et al. 2002;Duchˆene et al. 2002;Beck et al. 2004;Duchˆene et al. 2005). The circumstellar disk around T Tau N has been studied extensively
at mm through infrared wavelengths and is viewed ∼20-30◦ from face-on (Akeson et al. 1998;Gustafsson et al. 2008;
Guilloteau et al. 2011, 2013; Podio et al. 2014; Manara et al. 2019). A small (<4 AU) circumstellar disk around T Tau Sa is detected with a near-edge on orientation (> 70◦;Ratzka et al.(2009);Manara et al.(2019)). Material along
the line of sight toward T Tau S that causes Av ∼20 magnitudes of foreground attenuation is detected in solid state
absorption features of water ice, silicates and CO2 ice (Ghez et al. 1991;Beck et al. 2001, 2004; Skemer et al. 2008;
Ratzka et al. 2009;van den Ancker et al. 1999). Figure2 shows the 1 - 18µm spectral energy distribution (SED) of T Tau N and S (Sa+Sb unresolved), including 2-4µm and 8-13µm spectral measurements that trace the ice and silicates. The SED of T Tau N is typical of young sun-like stars with silicates in emission tracing hot dust in its inner heated
disk (Ghez et al. 1991; Skemer et al. 2008; Ratzka et al. 2009). Figure 2 demonstrates the strong flux attenuation
and solid state absorption features in the SED of T Tau S. Because of the significant obscuration toward the T Tau S binary and small extinction toward T Tau N, the attenuating material that causes the ice and silicate absorption has been best described as a circumbinary disk encircling the T Tau Sa+Sb stars. Indirect evidence for a circumbinary
distribution of material encircling T Tau S has been detected in near IR polarimetric maps (Yang et al. 2018), and
as a dimming at its position in the background ultraviolet (UV) molecular hydrogen emission (Walter et al. 2003).
However, spatially resolved IR measurements suggest that the flux attenuation of Sb may be significantly less than Sa (Ratzka et al. 2009). The nature of the foreground obscuring material along the line of sight toward T Tau S has been elusive.
The T Tau triple system hosts three cataloged Herbig-Haro flows. The HH 155 outflow is oriented in the east-west direction, arises from T Tau N and extends to Hind’s variable nebulosity 20-3000 to the westB¨ohm & Solf(1994);Solf & B¨ohm(1999). The extended HH 255 outflow is believed to arise from T Tau S, extends ∼4000 in the North-South
direction, terminating in the HH 355 red and blue shifted lobes which are ∼20 arc minutes distant (Reipurth et al.
1997; Solf & B¨ohm 1999). This outflow represents one of the few extensive, ∼1.55 parsec giant Herbig-Haro flows
in Taurus (Reipurth et al. 1997). Optical spectral measurements of Burnham’s nebula (HH 255) reveal an extensive
array of over 80 optical emission lines, attributed to shocks in the inner outflows (Solf et al. 1988). Resolved spectral
imaging has found multiple loops and arcs of emission from Hα, [S II] and near-IR H2associated with the inner HH 255
flow and Burnham’s nebula (Herbst et al. 1997;Robberto et al. 1995;Herbst et al. 2007;Beck et al. 2008;Gustafsson et al. 2010). However, a new generation of extremely sensitive high contrast adaptive optics imaging has challenged
the outflow geometry found from the past kinematic measurements. Particularly,Herbst et al.(2007) andYang et al.
(2018) measured high contrast near-IR H2 and H-band polarized continuum, respectively, and found evidence that T
Tau Sa or Sb may be driving a western component of the outflows, previously attributed to T Tau N. As observations of the inner environment of T Tau have improved and become more sensitive, confusion in the orientation and nature of the outflows from the system has followed.
T Tau exhibits intriguing evidence for mis-aligned circumstellar disks and outflows, which has made it a
demon-stration case for orbital dynamical evolution during the formation stages of multiple star systems (Reipurth 2000).
In this paper, we present a new multi-wavelength investigation of the T Tauri triple to reveal the new observable characteristics of the system and its geometry. We analyze archival ALMA maps of the 1.3mm dust continuum, and present multi-wavelength UV through optical emission maps to reveal the circumstellar and circumbinary material in
T Tau N
T Tau Sa+Sb
Water Ice
Silicates
Figure 2. The 1.0 to 18µm spectral energy distribution of T Tau N (blue) and T Tau S (red); the Sa and Sb binary components were unresolved. Symbols plot the broadband fluxes in the near-IR Z through L band and 7.9, 11.6 and 18.3µm mid-IR bands (T Tau N triangles, T Tau S, diamonds). 2-4µm (IRTF SpeX) and 7.5-13.2µm (Gemini North Michelle) longslit spectra are overplotted to reveal broad features of 3µm water ice and ∼10µm silicates. The Z and J-band measurements are from 2005, the near-IR and mid-IR measurements are from Fall 2003, see Table1.
The shortest wavelength measurement in the Z-band presents the upper bound to the flux of T Tau S for this non-detection. the system. We present and analyze previously unpublished optical and infrared measurements of outflow diagnostics and relate the flows to characteristics of this young triple system. We emphasize in this study that a multi-wavelength understanding of the characteristics of young star systems is important, and that the T Tau triple system is a funda-mental laboratory for understanding dynamical effects in the early evolutionary stages of triple and high order multiple systems.
1.1. A Historical Summary of T Tauri
As the prototypical member of its class, T Tau has become a laboratory to reveal intriguing astrophysical phenomenon on the formation of across the electromagnetic spectrum. The T Tau system has a number of historical observational firsts. To study variability in the nearby Hind’s nebula, T Tau was the first astrophysical source to have low level extended nebular morphology analyzed by computer digitized subtraction of the bright stellar core (first electronic
PSF subtraction; Lorre (1975)). T Tau was the first clear detection of the bright 2.12µm H2 feature arising from a
young star (Beckwith et al. 1978), although ro-vibrational molecular hydrogen in the Orion star forming region had
been identified a few years earlier by Gautier et al. (1976). It was also the first detection of the UV electronic H2
emissions from hot gas in the environments of a TTS (Brown et al. 1981), and discovery of T Tau S was the first
identified companion seen only in the infrared (Dyck et al. 1982; Koresko et al. 1997). The system has exhibited
strong and highly variable circular polarization and non-thermal radio emission, serving as a demonstration for radio properties of inner magnetized outflows (Phillips et al. 1993;Skinner & Brown 1994;Ray et al. 1997;Johnston et al. 2003; Smith et al. 2003). Schneider et al.(2018) used T Tau as an accretion laboratory to reveal that strong mass accretion affects the hot 106K coronal emission, resulting in an observed anti-correlation between mass accretion and stellar X-Ray activity.
Prior to ∼1900, T Tau was highlighted in the literature as an interesting system because of significant optical
brightness variability. T Tau N varied in optical brightness randomly and by more than 3 magnitudes (Lozinskii 1949;
Beck & Simon 2001). The American Association of Variable Star Observers (AAVSO) has collected over 28,000 optical brightness measurements of T Tau from the last 150 years, including historical literature reports and contributions
from amateur astronomers. Figure 3 presents the AAVSO optical V-band light curve of the T Tau system from the
early 1860s to 2020 (Kafka 2020). As also found byLozinskii(1949) andBeck & Simon (2001), Figure3 shows that the optical brightness of T Tau varied by over 3 magnitudes, and then the rampant variability abruptly ceased before
Figure 3. The historical optical variability of T Tau from over 120 years of monitoring observations, as reported by the American Association of Variable Star Observers. The historical measurements are in an optical visible bandpass equivalent, the green data points since 2000 are in a v-band filter. The times highlighted by red arrows show the approximate orbital periastron passage date of the T Tau S binary for the past 5 orbits.
the 1930’s. Regular measurements by the AAVSO since that time show T Tau to be much more stable, with annual variations on at the ±0.5-0.7 magnitude level. This is also consistent with variability monitoring observations ofHerbst et al.(1994) and the available PanStarrs measurements (Chambers et al. 2016). Herbst et al.(1994) found that the ∼1 magnitude optical photometric brightness variations of T Tau indicated a likely origin caused by accretion variability and possible variations in flux attenuation, such as from dust structures passing through the line of sight. From the
AAVSO light curve in Figure 3 we see that a slow, extended ∼0.5 mag decrease in the average brightness occurred
between 1950 to 1965. More recent measurements in the past ∼5-7 years suggest another slight decrease in the optical flux of T Tau may again be occurring. However, for the most part, the optical flux of T Tau has been much more stable in the past 8 to 9 decades compared to its historical rampant variability. Variations in line of sight obscuration to the system were postulated as likely cause of the large and random changes in optical brightness of T Tau prior to ∼1930 (Beck & Simon 2001), but the abrupt cessation of this variability has never been explained.
2. OBSERVATIONS
In this paper we present previously unpublished imaging, spectroscopy and imaging spectroscopy at optical, near-IR and mid-near-IR wavelengths. We also present and reanalyze archival datasets at X-Ray, UV and mm wavelengths.
Table1summarizes the observations presented in this study (top) and the archival datasets from the Chandra X-Ray
Observatory, Hubble Space Telescope (HST) and Atacama Large Mm Array (ALMA) downloaded and presented here
(bottom). The archival X-ray dataset from Chandra was presented and analyzed in detail by Schneider et al.(2018)
and the ALMA observations of T Tau were included in the 1.3mm dust continuum survey paper of Manara et al.
(2019). To the best of our knowledge, this is the first publication of the archival UV imaging dataset from the HST.
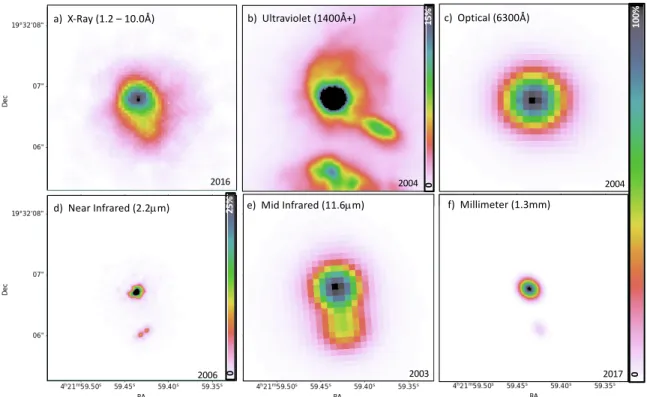
Figure 4presents the continuum flux of the inner 300×300 region around the T Tau triple system from X-ray through
1.3mm from the datasets summarized in Table 1. The three stars in the T Tau triple system are spatially resolved
and detectable only in the near-IR continuum imaging (Figure 4d). In all other images the T Tau S binary is either
obscured to non-detection (UV and optical; Figure 4b & c), or below the sensitivity or spatial resolution limit of the
measurements without specialized processing (X-Ray, mid-IR, mm; Figure4a, e & f). The UV image presented here is
from the HST Advanced Camera for Surveys (ACS) F140LP long pass filter, and in addition to continuum flux, strong
extended UV H2emission is also measured. This is the only image in Figure4that exhibits strong line emission above
the continuum.
2.1. Optical Imaging
To study the nebulosity and extended outflow structure, optical imaging of T Tau with the Gemini Multi-Object Spectrograph (GMOS) imaging camera was carried out in October 2004 in the g, i, z broadband filters and the Hα
b) Ultraviolet (1400Å+) c) Optical (6300Å)
d) Near Infrared (2.2µm) e) Mid Infrared (11.6µm) f) Millimeter (1.3mm)
2004 2004 2006 2003 2017 a) X-Ray (1.2 – 10.0Å) 2016 0 100% 0 15% 0 25%
Figure 4. The inner 300×300
region around T Tau from X-ray through mm wavelengths. All images are scaled logarithmically from 0 to 100% of the peak flux (of T Tau N), except for panels b) and d), which are scaled from 0 to 15% and 25% of the peak flux, respectively, to enhance the significantly fainter extended emission structure and the fainter stars, T Tau Sa+Sb.
two exposure times to increase dynamic range with a straightforward 4 point dither pattern. These data were reduced
into combined images using the Gemini IRAF package. The GMOS imager has a ∼60×60field of view sampled in these
observations at a 0.000727 plate scale. GMOS on-instrument wavefront sensor (OIWFS) delivered seeing enhanced
(tip-tilt corrected) images with a FWHM of ∼0.005. The data processing software combined individual images in the 4
point dither pattern into a single image, and binned by a factor of 2 for an 0.001458/pixel dominant WCS axis. Field
distortions were preserved in the WCS header matrix. In all of the broad-band images, the central ∼0.005-100region of T Tau N was saturated in the long exposure images. The saturated pixels were replaced with unsaturated data from shorter exposure images, and inner saturation spikes on the detector were interpolated using a linear fit. The three color g, i, z image mosaic is presented in Figure1, and the Hα image of extended outflow structure is analyzed in §6. A second epoch of optical imaging through the Hα filter was acquired with the GMOS imaging camera in October
2019 (Table1; Gemini program ID: GN-2019B-Q-204, PI=T. Beck). The GMOS imaging mode had a detector change
between these two observations, with the updated camera having a 0.00080 plate scale. The data were acquired with a
180s individual exposure time with a 5 point dither pattern. The DRAGONS data reduction package offered by the Gemini Observatory was used to process the images, which were then also binned by a factor of 2 for a WCS with
a 0.001619/pixel dominant axis. Field distortions were preserved in the WCS header matrix. For these images, the
central region was saturated and the inner spikes on the detector were not interpolated. This imaging was used in conjunction with the 2004 epoch to measure outflow proper motions, see §6.
2.2. High Resolution Near-IR Imaging
Adaptive optics (AO) imaging provides precise measurements of the orbital motion and relative flux ratios of the three components in the T Tau system. Near-IR AO measurements of T Tau at or near the diffraction limit were made at Gemini and Keck Observatories from 2015 - 2019 by G. Schaefer (PI). These observations are presented
and discussed in detail in a companion paper,Schaefer et al.(2020). Many of the images are used here for reference
positions of the T Tau N and Sa+Sb stars. SeeSchaefer et al.(2020) for the details and a log of the photometric and
astrometric results for the near-IR AO imaging observations of components in the T Tau system. Figure4d presents
T able 1. Summary of Observ ations UT Date T elescop e Instrumen t Configuration Exp osure Time (s) T otal Exp osure Program ID Figure / # Exp. Time / PI Previously Un published Data 2003 Se p. 03 Gemini North Mic helle 7.9, 11.6, 18.3 µ m 30 / 20 600 GN-2003B-SV-81 / 2, 4 Imaging T. Bec k 2003 Se p. 03 Gemini North Mic helle 9-13 µ m 30 / 20 600 GN-2003B-SV-81 / 2 Mic helle Sp ectrosc op y T. Bec k 2003 Dec. 05 NASA IR TF Sp eX LXD1.9, 2-4 µ m 30 / 20 600 – / T. Bec k 2 2004 O ct. 04 Gemini North GMOS g, i, z, H α 30 (180 120 GN-2004B-Q-80 / 1, 16 Imaging @ H α ) / 4 (720 @ H α ) T. Bec k 17 2019 O ct. 01 Gemini North GMOS H α 180 / 5 900 GN-2019B-Q-204 / 17 Imaging T. Bec k 2004 O ct. 04 Gemini North GMOS IFU R831 Grating 600 / 1 600 GN-2004B-Q-80 / 4, 8, @768nm 8 p ositions T. Bec k 10-13 2005 O ct. 19 Gemini North NIFS Z, J 10 (20 @ Z) / 12 120 (240) Engineering Time 2, 8 2005 O ct. 25 Gemini North NIFS K 127.2 (5.3 × 24) / 36 4580 Engineering Time 15, 20 2006 Dec. 25 Gemini North NIFS H and K w/ 120 / 16 19 20 GN-2006B-DD-6 / 14, 15 0. 005 OD T. Bec k Arc hiv al Data 2015 Ja n. 1-3 Chandra X-Ra y A CIS HETG 0th -127.4 k s 16672 / 4 Observ atory Order Image -P . Sc hneider 2004 N o v. 05 Hubble Space A CS F 1 40LP & F165LP 990 / 4 10489 / 4, 9, 2004 N o v. 05 T elescop e Filters A. Bro wn 16, 20 2017 A ug. 18 ALMA Band 6 233Ghz -526 2016.1.01164.S / 4, 7, G. Hercze g 8, 20
2.3. IR Longslit Spectroscopy and Mid-IR Imaging
Observations of T Tau with the SpeX instrument (Rayner et al. 2003) on the NASA Infrared Telescope Facility
(IRTF) were acquired using the LXD1.9 2-4µm grating setting (R∼1000 spectra) with an 0.005 slit width during
scheduled visiting observations (PI=T. Beck). Weather conditions were photometric and dry, with infrared seeing of
∼0.0055. The spatial point spread functions (PSFs) of T Tau N and S were blended in the cross dispersion direction.
Accurate extraction of the spectra of T Tau N and S was carried out by scaling the spatial PSF measured using the
telluric standard observation, and scaling, shifting and adding profiles to fit the binary using our χ2 minimization
routines created for this purpose (Prato et al. 2003; Beck et al. 2004). The component spectra were extracted and
formatted into a structure for subsequent processing using the SpexTool software package provided by the IRTF (Cushing et al. 2004). Spatially resolved 2-4µm spectra of T Tau N and S are presented in Figure2.
Mid-IR imaging and spectral measurements of T Tau were acquired with the Michelle instrument at Gemini North Observatory for system verification observations (Gemini Program ID: GN-2003B-SV-81, PI = T. Beck). The mid-IR diffraction-limited images were observed through the 7.9, 11.6 and 18.3µm medium band filters and low resolution spectroscopy was acquired from 7.6-13.5µm at resolution R∼100. Data were observed using standard chop-nod ob-servation strategies for mid-IR wavelengths to produce near diffraction limited images. Packages in the Gemini IRAF suite of reduction routines were constructed to reduce and analyze this data. T Tau N and S were easily resolved in the images, but the close Sa+Sb binary system was well below the resolution limit. Flux calibration of the images was carried out using observations of Vega (α Lyr) as the mid-IR standard reference source, observations of which were well matched in airmass. The spectral extraction was carried out by scaling, shifting and summing the PSF observations of Vega into a model binary using routines adapted from the near-IR processing (Prato et al. 2003;Beck et al. 2004). The flux calibration of the spectral observations was accomplished by referencing and scaling the broadband mid-IR images at 7.9 and 11.6µm to the appropriate wavelength range in the spectra. The the SED of Figure 2 includes the
photometry and spectra, and the 11.6µm image of T Tau is presented in Figure4e.
2.4. Optical Integral Field Spectroscopy
High resolution optical spectroscopy with 2-D spatial resolution provides the unique opportunity to detect and isolate the inner HH emission to probe the nature of outflows from the T Tau system. The GMOS Integral Field Unit
(IFU) was used with the blue slit (3.005×500 field of view), the R831 grating, RG610 long pass filter with a 768nm
central wavelength setting to acquire simultaneous R∼6000 imaging spectra from 620nm - 850nm (Gemini program ID: GN-2004B-Q-80, PI=T. Beck). Within this bandpass lie the common nebular emission features of [OI], Hα, [N
II] and [S II] from 630nm to 673nm. The fiber-fed GMOS IFU has an 0.001 sampling in hexagonal spatial elements in
its single slit setting, providing a spatial view that spans 3.5”×500 on the sky. The OIWFS seeing-enhanced spectral
images had an 0.0045 FWHM. Two exposures of 600s were acquired at each of eight positions to map a 500×1000region
around T Tau. The optical IFU data were processed using the standard routines in the Gemini GMOS IRAF package, and the dithered IFU positions were stitched together using specific IDL routines created for this purpose. The optical
continuum image (extracted at 630nm) is shown in Figure4c, and the line emission maps are presented and analyzed
in detail in the outflow discussion of §5.
2.5. Near-IR Integral Field Spectroscopy
We include here and summarize in Table 1 the three different sets of near-IR integral field spectroscopy from
Gemini North Observatory’s Near-IR Integral Field Spectrograph (NIFS) that have been used for this project. All NIFS observations have a two pixel spectral resolving power of ∼5300 and provide the spatially resolved imaging spectroscopy over a 300×300 field of view with ∼0.001 spatial FWHMs (∼0.001× ∼0.0004 spatial pixels). In all cases,
observations were acquired using the Gemini North Facility adaptive optics system, Altair, using T Tau N as the optical wavefront reference star (Rmag = 9.6) with 1000Hz guiding for typical diffraction limited imaging at
1.6-2.2µm. This provided AO-corrected imaging spectroscopy with spatial FWHM of ∼ .001. IFS data were reduced and
formatted into datacubes with 0.0004×0.0004 square spatial elements using the tasks in the Gemini NIFS IRAF package; the reduction process is described in detail inBeck et al.(2008).
The first dataset consists of a short set of exposures through all four of the NIFS grating settings at the Z-band (0.95-1.12µm) and J-band (1.17-1.34µm) wavelengths. These data were acquired during engineering time as a test of NIFS observing tool (OT) sequence execution, on the night that NIFS had first light at Gemini (2005 Oct. 19). The
Z and J-band continuum photometry are included in Figure 2, and continuum subtracted map of the extended and resolved 1.08µm He I line emission is presented and discussed in §4.
The second dataset was from long duration flexure tests acquired during NIFS engineering commissioning time to investigate the flexure movement of astrophysical targets versus time within the NIFS imaging field. This test used the K-band grating setting and had a long clock duration of over 4 hrs (including overheads). T Tau is bright in the near IR, the short individual observations had to be co-added to avoid saturation, resulting in integrated IFS observations
of T Tau with a combined time of 4580s. The resulting maps of near-IR ro-vibrational H2 from this dataset were
previously published and analyzed inBeck et al.(2008). The H2line emission map from these observations is discussed
in detail in §5.
The third NIFS dataset presented here consists of H and K-band observations of T Tau using the 0.005 diameter
occulting disk (OD) to block the bright flux from T Tau N (Table1; program ID GN-2006B-DD-6, PI=T.Beck). The
occulting spot was used for this observation to block the bright central flux of T Tau N and to optimize the dynamic range and sensitivity to low level line emission in a shorter amount of total exposure time. The goal of this project was
to measure the extended line emission from 1.644µm [Fe II] and acquire a second epoch of near-IR H2 emission maps
to compare with the prior observations described above. In §5, the [Fe II] Line emission map from these observations
is presented in detail in §5, and the H2maps are used to analyze tangential outflow motions.
2.6. Archival Chandra X-Ray Imaging
T Tau was observed with the Chandra X-ray Observatory from 01-03 January 2015 under program number 16672 (PI = P. C. Schneider). The ACIS instrument with the High energy transmission grating (HETG) acquired spectra and the 0th order HETG map of X-ray emission from T Tau over a 127.4 ks exposure time. The 0th order image has a 0.4 - 10kEV bandpass (31 - 1.2˚A). The image and spectra from this observation are presented and analyzed in detail in
Schneider et al.(2018). Particularly, the X-ray emission character from T Tau N, and its observed anti-correlation with optical tracers of mass accretion activity, are analyzed and modeled in that study. For wavelength completeness in our
view on the T Tauri triple system, the Chandra ACIS HETG 0th order image of T Tau is included in the Figure4a.
This super-sampled image was shared by P. C. Schneider (private communication). The X-ray map of T Tau shows appreciable emission to the south of T Tau N, at a position angle that seems consistent with high energy photons near
the position of T Tau Sa+Sb passing through the foreground attenuating material (Schneider et al. 2018).
2.7. Archival HST Ultraviolet Imaging
We re-analyzed archival data from the HST ACS ultraviolet imaging from project 10489 ( PI = A. Brown). The HST is the only available option for characterizing astrophysical emission at far-ultraviolet (FUV) wavelengths. Images of CTTSs acquired through the ACS Solar Blind Channel (SBC) camera using the F140LP filter include stellar continuum and chromospheric flux at the position of young stars, but also within this band-pass is spatially extended emission from the H2electronic transitions of the Lyman bands. The UV H2luminosity correlates directly with central accretion
luminosity (e.g., from CIV emission France et al. (2012)). Images acquired with the ACS SBC F165LP filter span
a bandpass that is longward of the UV H2 emission, only central stellar, chromospheric flux and scattered light is
seen. Hence, the F140LP and F165LP filters effectively provide a UV H2 on and UV H2 off filter combination to
study extended UV H2 emission in the environments of young stars. The photospheres of young ∼K spectral type
CTTSs are intrinsically faint at these FUV wavelengths, but the UV H2 emission can be strong and circumstellar dust
attenuation and scattering is stronger than at longer wavelengths. Models of X-ray and UV heating of H2 in disks
predict that emission should be compact and not extended beyond 10-30AU from the star (Nomura & Millar 2005;
Nomura et al. 2007). The vast majority of the disk H2 arises from the hot gas in the inner 10AU, and the extended
emission traces low density surface layers in the upper disk (France et al. 2012). Here we present the ACS F140LP
image of T Tau in Figure4b, and it is discussed in detail in sections §4 and §6. 2.8. Archival 1.3mm ALMA Continuum Imaging
To reveal and understand the disks in the T Tau triple system, we re-analyzed archival data from the Atacama
Large MM Array (ALMA) from project 2016.1.01164.S (Band 6 at 0.0012 resolution; PI= Herczeg; published inLong
et al.(2019) andManara et al. (2019)). The observations of T Tau were obtained on 18 August 2017 using 47 12-m
antennas on baselines of 21∼3697m. The general program observations are described in Manara et al. (2019). The
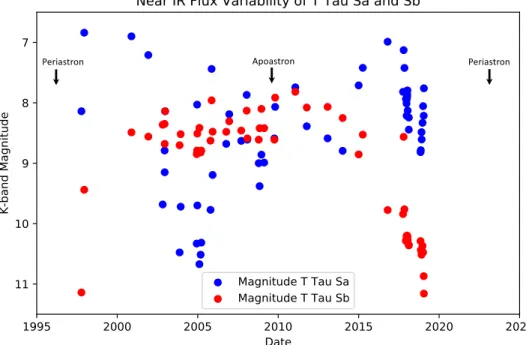
Periastron Apoastron Periastron
Figure 5. The infrared variability of T Tau Sa (blue) and Sb (red) from spatially resolved measurements of the system made from 1997 to 2019. Typical uncertainties on the measurements of T Tau Sa are ∼0.1 - 0.3mag, and Sb are 0.3 - 0.5mag in the absolute photometry (seeSchaefer et al.(2020)).
(1.33mm) data using phase self-calibration techniques. The phase self calibration with 6sec smoothing time improved the dynamic range of the default calibrations from 300 to 1600. An amplitude self calibration with 12sec smoothing time resulted in no further gain. These new processed images show two obvious sources, T Tau N and the combined
S+Sb system. This dust map is included in continuum images of Figure 4f and analyzed in greater detail in the
disk discusion of §4. Unfortunately, the13CO and C18O data included in the ALMA setting was difficult to interpret
because the measured signal traces only the low level fluctuations on an underlying distribution of material that is resolved out; these emission line images seem to lack information from the short interferometric spacings.
3. INFRARED VARIABILITY OF T TAU SOUTH
The combined light from Tau South has been known to vary significantly since the discovery of the system as a young multiple star (Dyck et al. 1982; Ghez et al. 1991; Beck et al. 2004). Schaefer et al. (2020) compiled and presented 24 years of spatially resolved brightness measurements of T Tau Sa and Sb, showing rampant variations in the near
IR (K-band). The compiled light curve of T Tau Sa and Sb is presented in Figure5 and includes data fromKoresko
(2000); Duchˆene et al. (2002); Furlan et al. (2003); Duchˆene et al. (2005, 2006); van Boekel et al. (2010); Schaefer et al.(2014,2020). Highlighted by arrows in Figure5 are the temporal locations of the prior periastron passage date (1996.10) the most recent orbital apastron (2009.69) and the next periastron passage (2023.28) in the 27.2±0.7 year orbital period (Schaefer et al. 2020). T Tau Sb was discovered in late 1997, nearly two years after the last periastron passage. Hence, to-date there are no resolved measurements of the brightness of T Tau Sa and Sb at the time of
periastron. Indeed, these measurements are likely difficult to make, as shown in Figure5and emphasized bySchaefer
et al. (2020). T Tau Sb has declined in brightness by over 3 magnitudes since ∼2015 and it seems to be increasingly faint as it approaches periastron. At the greatest stellar separation during apastron in mid 2009, the brightness of both T Tau Sa and Sb seemed to stabilize. Within ∼2-3 years of apastron, from 2006 to 2012, the IR flux measurements vary by about 1 magnitude rather than the 3+ magnitudes seen outside of this time frame. This indicates that properties that drive the variability, such as rampant stellar accretion or variations in line-of-sight material, are less pronounced.
This might be expected during a more quiescent system state during the time frame around apastron passage (van
Boekel et al. 2010).
Beck et al.(2004) compiled all of the unresolved brightness measurements since the discovery observation of T Tau
S in 1981 (Dyck et al. 1982). When coupled with the summed component fluxes of T Tau Sa+Sb collected bySchaefer
Figure 6. The phase-wrapped light curve of the combined flux of T Tau Sa+Sb from all measurements that resolved T Tau S from N. Blue points show the data from 1996.10 to 2019, and red points are from the prior orbit before the last periastron at passage at epoch 1996.10. Phase 0.5 corresponds to the orbital apastron. The black arrow presents the phase location of the ∼2 magnitude grey flare discovered byGhez et al. (1991). Typical uncertainties on the combined magnitudes of T Tau S are ∼0.2 - 0.3mag.
the phase-wrapped orbital light curve of the T Tau S system, based on this combined dataset. The data points in blue are from T Tau S system magnitudes during the 1996.10 to 2023.28 orbit of the Sa+Sb binary, and the data points in red are from the prior orbit from 1968.93 to 1996.10. T Tau S was fainter in the measurements made in the early 1980s compared to those during the same phase in the current orbit. Interestingly, a brightness increase of the combined system in late 2016 near orbital phase 0.8, driven primarily by the nearly ∼2 magnitude increase of the flux of T Tau
Sa, was contemporaneous in orbital phase with the first gray flare of T Tau S discovered byGhez et al.(1991). This
coincidence suggests that the combined flux variations of T Tau S may be linked to the orbital phase of the binary.
4. DISKS IN THE T TAU SYSTEM
We used the archival Band 6 233GHz ALMA data to reveal and understand the disks in the T Tau triple system
Long et al. (2019); Manara et al. (2019). Figure 4f presents the 1.3mm continuum image that shows two obvious sources; T Tau N and the unresolved Sa+Sb system. A detailed analysis to fit disks in the UV plane suggests that the 1.3mm dust continuum emission from T Tau is best described by four components: resolved CS disks around both T Tau N and Sa, emission from an unresolved CS disk around Sb, and elongated emission to the south of T Tau N, extended around Sa+Sb. We modeled the emission from T Tau N and Sa each by an elliptical Gaussian, and that from T Tau Sb by a point source. A global fit was performed with this overall model to the measured visibilities, keeping the position, intensity and, where relevant, sizes and orientation of the model sources as free parameters. We
used the UV FIT command in the ’IMAGER’ program of the GILDAS software tool (Gildas Team 2013). The fits
optimally found three components, with the northern component resolved, and the southern-most resolved in one axis. The position of the mm fits to the resolved and unresolved southern components correspond with the IR positions
of Sa and Sb, respectively. Table2 summarizes our fit parameters for the 1.3mm continuum circumstellar dust disk
emission around T Tau N, Sa and Sb, and Figure 7 presents a graphical depiction of the results. Numerical model
uncertainties on the disk flux fits are at a level of 0.2mJy or less, disk radii are ∼ ±2AU. After removing the best fit model from the data, the residual image clearly reveals a spatially resolved emission slightly South of T Tau N,
extending around Sa+Sb. Figure7a shows the continuum map and Figure 7b presents the residual after the best-fit
model was subtracted from the measured image. For all three of the stars, the measured disk positions in the 1.3mm dust observations are consistent with the IR continuum positions from AO measurements at the 2017 epoch of the observations (Schaefer et al. 2020). In Figure7the IR continuum positions of the stars are presented using epoch 2006
2016
100%
a) 1.3mm
b ) Model Subtraction Residuals
30 25 % 0. 25 Lo g Li ne ar
Figure 7. The ALMA 1.3mm image of the T Tau system (a) and the residual dust emission after model subtraction (c). Overplotted on the residual image are contours of near IR continuum flux showing the positions of the stars (epoch 2006), with levels of 5, 10, 40, 70 and 90% of the peak flux. The epoch 2006 contours are used to present positions of Sa and Sb here because T Tau Sb had become too faint to easily appear in the contour maps from the contemporaneous epoch 2017 near IR measurement.
observations because in the near contemporaneous epoch 2017 IR measurements T Tau Sb was too faint relative to T Tau Sa to show up in the flux contours.
4.1. The Circumstellar Disks
The circumstellar disk around T Tau N has been previously measured in mm dust and is known to be viewed nearly face-on (Akeson et al. 1998;Long et al. 2019;Manara et al. 2019). In our reanalysis of the ALMA maps, the relatively
bright (∼190 mJy) 1.3mm dust emission around T Tau N is well fit by a uniform disk of 0.0025 (35 AU) diameter.
The disk is slightly elongated in the east-west direction at a position angle of 89 degrees, and the inclination of 28±1
reveals that the disk is nearly coplanar with the orbital plane of T Tau Sb around T Tau Sa (Schaefer et al. 2020).
The results for our disk fit for T Tau N are similar to those derived byManara et al.(2019) from the same dataset.
The measured disk around Sa has a 1.3mm emission level of ∼8.4±0.06 mJy with a >70◦ inclination at a position
angle of ∼4◦. The elliptical Gaussian disk fit is unresolved in the east-west dimension and has a FWHM of ∼50 mas
(7 AU diameter) in the north-south direction. Hence, the fit to the Sa emission is consistent with a highly inclined disk that is not coplanar with either the disk of T Tau N or the Sa-Sb orbital motion. In fact, the orientation and
character of the disk might be consistent with a perpendicular ∼ 90◦ orientation with respect to the T Tau Sa-Sb
orbital motion, as predicted by the dynamical models of Lubow & Martin (2018). The results for our disk fit for T Tau Sa are similar to those derived byManara et al.(2019). Additionally, the size and orientation of the disk around
T Tau Sa that we find in the ALMA maps is similar to the measurements at 10µm from the VLTI (Ratzka et al. 2009).
Manara et al.(2019) fit the 1.3mm ALMA continuum maps of emission from T Tau with a two component model for disks around T Tau N and Sa. Although our respective circumstellar disk position angles and elongations are similar,
Table 2. Summary of Circumstellar Disk Properties Derived from mm Dust Star Integrated 1.3mm Flux (mJy) Disk Radius (AU) Disk Inclination Disk PA
T Tau N 190.0±0.2 18 28±1◦ 89±1◦
T Tau Sa 8.4±0.06 3.5 >70◦ 4±2◦
they find a slightly lower disk emission level for T Tau N (179mJy versus our 190mJy), and a slightly higher 1.3mm continuum disk level for T Tau Sa (9.7mJy versus our 8.4mJy). Our reanalysis finds a best model fit with disk emission from all three of the stars. Incorporating the third component, T Tau Sb, decreases the modeled flux from T Tau Sa and increases the flux from N. Our fit to the 1.3mm emission around T Tau Sb is at a level of 1.17±0.05 mJy and is unresolved, suggesting a small and compact (<2 AU radius) CS disk. The small physical sizes of the CS disks around both the Sa and Sb stars can be naturally explained by tidal truncation effects, as the binary periastron distance is
only ∼5AU (Artymowicz & Lubow 1994). The combined T Tau S system is known to be variable in cm emission of
non-thermal origin at a level of ∼1.3 mJy (Ray et al. 1997); the variable radio emission may also contribute at a low level to the measured flux at 1.3 mm.
4.2. A Circumbinary Ring Around T Tau Sa and Sb
The T Tau S binary is known to have a moderate distribution of material along the line of sight to the central stars from the strong reddening of the stellar flux, and the broad spectral absorption features of solid-state 3µm water ice (Figure2;Beck et al.(2001,2004)) and 10µm silicates (also Figure2;Ghez et al.(1991);Skemer et al.(2008);Ratzka et al.(2009)). Here, we show evidence for direct measurement of weak mm flux from the extended dust along the line of sight to T Tau S. We also present silhouette images of the attenuating circumbinary ring material encircling T Tau Sa and Sb, as seen from multi-wavelength emission line species.
After fitting and subtracting the model of 3 circumstellar disks described in the previous section (with the disk of
Sb compact and spatially unresolved), we detect faint extended emission at ∼100 southwards of T Tau N, over about
∼200 with a northwest to southeast elongation at PA∼60◦ east of north. Figure7b shows this emission in the 1.3mm
residual map after the three component disk model has been subtracted. We interpret this as possible detection of the circumbinary dust around T Tau Sa+Sb. The total integrated flux of this emission across its spatial extent is 17±2 mJy. The summed flux of this feature is more than 10 times greater than the compact disk from T Tau Sb, and is an integrated detection with a moderate level significance. Taken by itself, this direct detection of dust in a circumbinary distribution is unconvincing. However, when viewed side-by-side with multi-wavelength emission line maps, the origin of this residual dust distribution in the circumbinary ring becomes more compelling.
Figure8a presents the 1.3mm dust residual image after the three star disk model has been subtracted. Figures8b,8c
and 8d show images of three emission line species that exhibit a dark silhouette at the approximate position and
orientation traced by the residual mm dust. The Hubble ACS ultraviolet image in the F140LP filter (Figure8b) traces
bright chromospheric flux from the central position of T Tau N, and strong extended emissions from the numerous electronic transitions of H2 that exist within this bandpass (Saucedo et al. 2003; Walter et al. 2003; France et al.
2012). A ”dark lane” of material is seen at the position of the mm dust (traced by red contours) and encompassing
the T Tau S binary (which is shown in blue). Bright lobes of UV H2 are measured to the northwest and southeast
of the position of T Tau S. This UV H2 emission structure showing a lack of line emission at the position of T Tau
S was first noted in the spatially resolved slit maps ofWalter et al.(2003). The position angle of this dark silhouette
seen in UV H2 is also ∼50-60◦ east of north. The spatial extent of the silhouette region in between the bright lobes
of emission is ∼0.004, or nearly 60 AU at the distance of T Tau (Xu et al. 2019). Figure 8c shows the λ6300˚A[O I] image that has been subtracted for continuum emission, and then had a point-source image scaled and subtracted for the bright line emission from T Tau N. The [O I] line emission has two lobes of bright flux to the northwest and southeast of the position of T Tau Sa+Sb, with a dark silhouette of material in between. The dark lane silhouette in
the λ6300˚A[O I] image is at approximately the same position angle as the UV silhouette. Figure8d similarly shows
the map of continuum and T Tau N point-source subtracted line emission from the 1.08µm He I feature, which also exhibits the dark lane and bright emission lobe structure of the circumbinary ring silhouette. The He I image shows detection of T Tau Sb through the foreground attenuating material, T Tau Sa is not seen as a point-source in He I.
The measured extended lobes of UV H2and [O I] emission revealed in Figure8c likely have a component of scattered
line flux from strong central emission from the stars and inner disk region, but this species can also arise from shock excitation of gas in the extended outflows from T Tau S. The He I gas traces hot dense material with an excitation
temp of ∼105 and is believed to primarily from the stellar accretion zone and the innermost regions of a wide angle
wind or outflow (Beristain et al. 2001). Hence, the extended lobes of He I are seen likely in silhouette after being
scattered off of the circumbinary dust from strong emission in the central accretion+outflow region. The symmetry of the dark-lane silhouettes in the UV, [OI] and He I maps suggests that the circumbinary ring is viewed within <10◦
0 0 100% 15% a) b) c) d) Figure 8. A 300×300
view of the ALMA 1.3mm residual dust image after removal of the three component disk model of T Tau (a), the UV H2 emission image (b), the 6300˚A[OI] image (c) and the 1.08µm [He I] image (d). Panels c) and d) have had continuum emission and the point-source line emission from T Tau N removed. Overplotted in blue in each panel are five equally spaced contours from 10 to 90% of the near-IR 2µm continuum showing the positions of the stars. Red contours on b) to d) show the 4σ and 6σ RMS residual 1.3mm dust, tracing the location of the circumbinary dust ring.
side-by-side, the emission line maps clearly reveal the silhouette of the circumbinary ring material and lend credence to the valid direct detection of dust in the 1.3mm residual map.
We interpret the significant residual 1.3mm dust emission presented in Figures7b and 8a as direct signature of the long suspected circumbinary disk around T Tau S. The peak brightness of the dust measured at 1.3mm is of order
60mK, which corresponds to AV ∼40, assuming Tdust = 20 K and κdust = 0.02 cm2/g. This circumbinary ring is
responsible for the foreground attenuation of ∼15-20 AV toward Sa and Sb, as only the front-side of the dust measured
at mm wavelengths is along the line of sight to T Tau Sa+Sb absorbs the stellar flux. Hence, the measured 1.3mm residual dust is in strong agreement with the magnitude of the attenuating line-of-sight circumbinary disk material, and its location and orientation is well matched to the dark silhouette disk seen in emission line maps from UV through near-IR wavelengths. The strongest emission in the 1.3mm residual dust map is offset from the position of T Tau Sa+Sb to the northeast, this may be because of over subtraction of the circumbinary ring material in the circumstellar
disk models for the binary. The extent of the disk is difficult to determine, though the mm residual extents ∼200 or
observations to better constrain inner circumstellar disk extents and orientations for T Tau Sa and Sb would provide the necessary basis to improve the direct measurement of the circumbinary ring material.
Figure9a presents the HST F140LP UV image (blue) which traces extended emission in the electronic transitions of
H2, with the epoch 2006 near IR image of the stars (yellow). We interpret the dark lane seen in the UV image to be
the silhouette of dust emission in the circumbinary ring around T Tau S. The dashed red line shows the approximate central position of this dark lane. T Tau Sa and Sb are offset to the northeast of the central position of the UV-dark lane, however the stars, particularly T Tau Sa, lie close to the observed center of the UV dark silhoutte (red line).
The cyan box is expanded in Figure9b to show the orbit of T Tau Sb around Sa. Plotted in Figure9b are the near IR
brightnesses of T Tau Sa (open circles) and Sb (filled circles) over their respective positions in the orbit. T Tau Sa’s orbit around the system center of mass is of coursenear the asterisk, it is shown here near the position of Sb to clarify the magnitude of the IR variability. The brightnesses are compiled fromSchaefer et al.(2020) and shown in Figure5. T Tau Sb is faint near periastron (filled points to the left in Figure9b) and at its brightest near apastron (filled points to the right). T Tau Sa seems to have an opposite character, though with much more significant variability in brightness over its orbit. Interestingly, T Tau Sb is faintest when it is closest to the UV flux silhouette mid-point as traced by the red line in Figure9a, and it brightens as it reaches apastron at its greatest distance from this line. We interpret this to mean that a substantial measure of the brightness variation of T Tau Sb arises from changes in line-of-sight obscuration as it emerges from behind the densest circumbinary dust during its apastron passage. This interpretation must clearly mean that the orbit of Sa+Sb is non-coplanar with the distribution of circumbinary ring material, and that T Tau Sb will continue to be extremely faint relative to Sa through its upcoming periastron passage in early 2023.
K¨ohler & Kubiak(2020) analyzed IR brightness measurements of T Tau S through late 2016 and also concluded that T Tau Sb emerges from behind the circumstellar or circumsystem material as it goes through its orbital apastron.
From Figure9a we find that the north western UV-bright lobe around T Tau S is offset from the apastron position of
Sb by ∼0.0015 (∼20AU). This means that: (1) low density UV-absorbing material (A
v∼1-2) that causes the shape of
the dark silhouette revealed by the UV image must exist to large distances (∼30-40AU) beyond the circumbinary ring mid-plane and (2) when T Tau Sb ’emerges’ from behind the circumbinary ring at apastron it is not to a line-of-sight at Av=0.
The 4σ lower contour in the residual dust emission map shown in Figures7b-d has an extension to the northwest.
If this structure is real and foreground to the T Tau S system, then it should effectively block the detection of any
UV H2 emission in the northwest emission lobe (Figure 8b). This dust structure might be in the background to the
UV emission, or it might be tracing a time variable change in dust morphology. The ALMA dust maps were acquired
almost 13 years after the UV H2 and [O I] emission images; it is conceivable that the northwestern dust extension is
a time variable feature in the system. Additionally, the 1.3mm wavelength might be affected by non-thermal emission
from the known active magnetic radio outflows from the system (Phillips et al. 1993; Skinner & Brown 1994; Ray
et al. 1997; Johnston et al. 2003; Smith et al. 2003). Measurements of the residual dust emission at additional mm wavelengths can determine the spectral energy to clarify the origin of this extended low level emission.
5. INNER OUTFLOWS IN THE T TAU SYSTEM
The T Tauri system hosts three cataloged Herbig-Haro objects: the north-south HH 255 outflow from T Tau S terminates in the giant HH 355 lobes which are ∼20 arc minutes away, and HH 155 from T Tau N in the east-west direction extends to Hinds variable nebula 20-3000 distant (Solf et al. 1988;B¨ohm & Solf 1994;Reipurth et al. 1997). In the past, five inner knots associated with HH 155 and 255 were located within 300 of the central stars, and longslit mapping spectroscopy kinematically traced the east-west flow to T Tau N and the northwest-southeast flow to T Tau S (Solf et al. 1988;B¨ohm & Solf 1994). Reipurth(2000) first postulated that the T Tauri triple system is in the process of dynamical reorganization from a non-hierarchical to a hierarchical configuration. In collimated jets, subtle changes in direction of the outflow may indicate a change in the orbital motion of an underlying binary, and regular, periodic knots of ejecta have been interpreted simply to reflect an average orbital period (Anglada et al. 2007; Louvet et al. 2018;Hsieh et al. 2016). Although the inner regions of HH 155 and 255 may not be well collimated, structure observed in the innermost knots can provide a record of the kinematics which drive the flows. High spatial resolution adaptive
optics imaging investigations of the morphologies in extended emission features within ∼200 of T Tauri have provided
some conflicting results on the origins of the inner outflows, with postulation that T Tau S drives the strong western flow (Herbst et al. 2007;Yang et al. 2018). However, imaging alone does not provide a complete picture; understanding the gas velocities is especially important to identify the sources of outflows. Spectral imaging measurements of optical
b) a) 50 0 -50 -100 ∆RA (mas) -50 0 50 100 150 ∆ DEC (mas) T Tau Sa-Sb
Figure 9. The F140LP UV image tracing extended H2emission (blue; 2004) with the near IR continuum image (yellow; 2006) showing the circumbinary ring silhouette and stellar positions, respectively. The red line traces the approximate mid-point and angle of the dark lane of material seen in the UV image. The box is expanded to the right showing the best-fit orbit model of the T Tau Sa+Sb binary (solid line). The position of T Tau Sa is marked by an asterisk. The approximate position and orientation of the mid-point in the UV-dark lane is also over plotted as a red dashed line in (b). The near IR (K-band) brightness of T Tau Sa (open circles) and T Tau Sb (filled circles) is shown near the orbital position of Sb. The size of the symbols represents the brightness of each star in linear flux units at a corresponding time relative to the orbital position of Sb around Sa.
and near infrared emission line species of Hα, [O I], [S II], [Fe II] and H2 provide sensitive tracers to disentangle the
inner outflow morphologies and kinematics in T Tau.
5.1. The Optical Outflows: [SII], [OI] and Hα
Figure10shows the 500× 1000 mosaiced IFU maps of the optical emission lines of [O I] (λ6300.304; Figure10a), Hα
(λ6562.83; Figure10b), and [S II] (λ6716.440; Figure10c). The Hα map is saturated in the inner 0.005 and displayed to show some of the lower level structure. Although the optical IFU measurements include other transitions, these three emission lines are the main species we present to focus on high signal-to-noise measures of outflow morphology
and kinematics. The spectrally integrated line maps (Figure10) have been subtracted for the continuum emission, and
the continuum PSF model was scaled to the central line emission from T Tau N and subtracted to enhance detection of low level extended spatial structure. The map of [OI] emission shows a strong bi-lobed structure encompassing the position of T Tau S. As discussed in the previous section, we interpret the dark-lane morphology as indirect detection of the significant circumbinary ring material obscuring the T Tau S binary. The bright [OI] lobes may arise from the line emission from a central photoevaporating disk flow (Rigliaco et al. 2013), which is then scattered off of the circumbinary dust distribution seen in silhouette. The [O I] map also exhibits extended emission to the southeast and north of the strong circumbinary emission lobes, this emission traces extended outflows in the T Tau environment. The Hα map was heavily saturated at the position of T Tau N, and the residual central flux after PSF subtraction is strong. The Hα line emission has multiple bright emission extensions within ∼1 from the position of T Tau N. An obvious arc shaped structure extends to the southeast in Hα emission, with a corresponding arc to the north west. Lobes of emission similar to those seen in [OI] that trace the circumbinary ring from T Tau S might be present in the Hα map, but clear detection is swamped by the strong emission from T Tau N.
[S II] is an efficient tracer of extended shocks in young star outflows. The [S II] emission from jets is not significant near to the star because it is not emitted in the central accretion region, and the gas conditions in the central disk or outflow material are typically too dense (Hirth et al. 1994a,b;Solf & B¨ohm 1999). The [S II] emission in our spatially resolved map of T Tau shows a bi-lobed encompassing the position of the central circumbinary ring, but the relative strength of the [S II] emission lobes is much weaker than the [O I]. The [S II] emission to the northwest of the silhouette in Figure10has a clear collimated linear extension oriented directly to the north of T Tau S. The brightest [S II] line emission is along this linear jet extension, ∼2.400due north of the circumbinary silhouette. The [S II] map also shows
a) [OI] l6300Å
b) Ha
c) [SII] l6716Å
Figure 10. Integrated maps of extended optical emission line species of [OI] (λ6300˚A), Hα (λ6563˚A) and [SII] (λ6716˚A). The three maps have been subtracted for the continuum emission and had a point-source model for T Tau N scaled to its peak emission and subtracted, to enhance the extended structures. Contours trace the ∼10, 40, 70, and 90% emission levels of optical continuum flux, showing the position of T Tau N in these measurements. [OI] and [SII] maps are scaled logarithmically from 0.0 to 1.0 of the peak emission line flux. The Hα map is scaled logarithmically from 0.0 to 8.0 times the peak flux to improve sensitivity to the bright central emission structure.
an arc of emission that starts at the position of T Tau N and extends north and west. The morphology in our spatially resolved [S II] line emission map suggests that multiple outflow components could be superimposed along the line of sight, consistent with the past optical measurements of the outflow kinematics from T Tau (B¨ohm & Solf 1994;Solf & B¨ohm 1999). For these reasons, [S II] is the primary emission species that we analyze in the following section to disentangle the multiple outflow kinematics.
The integrated optical emission line maps of [O I], Hα and[S II] shown in Figure10were made by subtracting the
continuum flux and summing the IFU data cube over the spectral axis to create narrow-band emission line images.
Figure 11 shows the kinematically resolved velocity channel maps of these three emission species, with [O I] at the
top, [S II] middle and Hα at the bottom. Each panel shows velocity integrated segments of the emission, from blue-shifted at left to red-blue-shifted emission in the right panels. The [OI] and [S II] line emission is seen from ∼-250km/s in blueward channels to ∼+80 in the red. The strong Hα emission extends over 700km/s in the spectral dimension. The morphological structures in these emission channel maps differ. In the channel maps of [OI], the line emission shows stronger flux from the position of the bi-lobes of the circumbinary ring silhouette. The integrated centroid velocity of this emission is ∼-50km/s, it is bright with high dispersion so it is seen throughout the velocity channels. Beyond the central lobes of the circumbinary ring, the other extended [OI] emission from the outflows is at a lower flux level but similar in morphology as seen in the extended [S II].
In the blueshifted channels of [S II], the line emission shows strong flux arising from the position of T Tau N and extending to the west. The southern flow material becomes more apparent in the central velocity channels, and the fourth channel (-21 to +23 km s−1) strongly shows the northwestern collimated jet arising directly from the upper lobe of the circumbinary ring silhouette. The redshifted channel of [S II] emission reveals the strongest receding emission toward the northwest. Investigation of the [S II] emission channel maps suggests that multiple outflow components
[OI] l6300Å
[
SII] l6716Å Ha -420 to -280km/s -264 to -124km/s -108 to +31km/s +47 to +187km/s +202 to +343km/s -250 to -185km/s -154 to -89km/s -154 to -89km/s -73 to -8km/s +8 to -73km/s -220 to -159km/s -143 to -98km/s -82 to -37km/s -21 to +23km/s +39 to +85km/sFigure 11. Velocity channel maps of continuum and T Tau N point-source subtracted optical emission line species of [OI] (λ6300˚A; top), [SII] (λ6716˚A; middle) and Hα (λ6563˚A; bottom). The integrated velocity ranges used to construct each channel map are presented at the bottom of each panel. Blue contours trace the 10, 40, 70 and 90% flux contours of the optical continuum emission showing the position of T Tau N. [OI] and [SII] maps are scaled logarithmically from 0.0 to 1.0 of the peak emission line channel flux. The Hα map is scaled logarithmically from 0.0 to 8.0 times the peak channel line flux to improve sensitivity to central emission structure.
S [S II] 6716Å Flux Wavelength (Å) Co un ts (A DU ) Component 1 Component 3 Component 2
Figure 12. The λ6716˚A[S II] line emission profile integrated over the full IFU spatial field. The integrated emission profile is well fit by a blend of three Gaussians, a blue-shifted component (Component 1), a component near the LSR velocity of T Tau (Component 2) and a red shifted component (Component 3).
from the T Tau triple system are overlapping along our line of sight. The Hα channel maps show nearly identical structure through all of the wavelength slices, with a morphology that almost exactly mimics that seen in the integrated
emission image (Figure 10b). As such, it seems that the majority of the Hα emission from the T Tau environment is
from strong central line emission that is scattered off of dust structures in the inner region. Subtraction of a scaled average Hα emission image from each channel (not shown) reveals extended line emission structure similar to the extended [S II].
Figure12 shows the line profile of [S II] (λ6716˚A) emission that has been integrated over every spatial position in the IFU field. This emission profile is well fit by three Gaussian components: Component 1 is somewhat broadened
and blueshifted by -78 km s−1, Component 2 is near the systemic velocity and shifted overall by +12 km s−1, and
Component 3 is narrower and redshifted by +98 km s−1(typical uncertainties are ±8 km/s). Investigation and fitting
of the [S II] line emission profile at several positions within the IFU field revealed that this three component fit was successful at nearly all spatial locations. Hence, to disentangle the line-of-sight outflow components in the T Tau system, the line profile fit shown in Figure12was extended and carried out at all locations that had [S II] line emission of greater than 10% of the peak channel emission line flux.
Figure13shows the three Gaussian component fit intensity and kinematic maps for spatially resolved line fits to the [S II] (6716˚A) emission profile. The intensity map is the sum image across the wavelengths of the Gaussian fit to the [S II] emission component. The velocity and dispersion images present the line centroid velocity and the dispersion
FWHM for the Gaussian fit to the component feature in the line profile, as demonstrated in Figure12. Component 1
traces the most strongly blueshifted emission seen in the environment of T Tau, from the blueshifted western jet. We find that component 1 of the [S II] emission profile arises from the position of T Tau N and extends to the west at profile velocity centroids of -100 to -140km/s. The blue arrow in the component 1 intensity map shows the position and angle of this blueshifted collimated western jet from T Tau N. The inner jet is ∼40% brighter than the wider angle outflow emission. Lower velocity blue-shifted emission with higher dispersion encompasses this fast blueshifted flow, with decreasing velocity with wider outflow opening angle. This component is tracing the inner emission from the long known HH 155 outflow that extends to the west toward Hinds variable nebula and NGC 1555. The brightest [S II] emission seen in the component 1 intensity map is seen near to the inner regions and to the south of T Tau N. This may represent an inner component of lower velocity shocked emission with higher dispersion.
The brightest [S II] emission from the T Tau outflows is seen in Component 2. This mid-velocity emission fills the full spatial field around T Tau (Figure13, middle panels). This emission exhibits slightly blue-shifted velocity to the south (∼-10km/s), and slightly redshifted to the north (∼+7km/s), with a low overall velocity dispersion. The structure of this inner emission is consistent with the maps of extended emission [S II] to the north and south measured bySolf &
v
cs
vv
c(k
m
/s
)
s
v(k
m
/s
)
0
-150
+150
+40
-20
+10
Component 3 Component 2 Component 1Intensity
NW1
NW2
B
Figure 13. The Gaussian emission line profile fits for λ6716˚A[S II] shown in Figure12were applied to every spatial position in the IFU field (with line flux>10% of the profile peak) and the three spatially overlapping emission components were extracted. The emission line intensity, line profile centroid velocity and velocity dispersion for the Gaussian fit to the blueshifted Component 1 is shown in the top panels, Component 2 I, vc and σv is shown at middle, and redshifted Component 3 intensity, velocity and dispersion is in the lower panels. Blue contours trace the ∼10, 40, 70, and 90% emission levels of optical continuum flux, and black contours in the velocity and dispersion maps trace the 10, 30, 55 and 70% contours of the integrated [S II] map from Figure10c.


![Figure 8. A 3 00 ×3 00 view of the ALMA 1.3mm residual dust image after removal of the three component disk model of T Tau (a), the UV H 2 emission image (b), the 6300˚ A[OI] image (c) and the 1.08µm [He I] image (d)](https://thumb-eu.123doks.com/thumbv2/123doknet/14801752.606577/15.918.138.786.97.695/figure-alma-residual-image-removal-component-model-emission.webp)

![Figure 10. Integrated maps of extended optical emission line species of [OI] (λ6300˚ A), Hα (λ6563˚ A) and [SII] (λ6716˚ A)](https://thumb-eu.123doks.com/thumbv2/123doknet/14801752.606577/18.918.144.783.95.530/figure-integrated-maps-extended-optical-emission-line-species.webp)
