HAL Id: hal-02964266
https://hal.archives-ouvertes.fr/hal-02964266
Submitted on 12 Oct 2020HAL is a multi-disciplinary open access
archive for the deposit and dissemination of sci-entific research documents, whether they are pub-lished or not. The documents may come from
L’archive ouverte pluridisciplinaire HAL, est destinée au dépôt et à la diffusion de documents scientifiques de niveau recherche, publiés ou non, émanant des établissements d’enseignement et de
The architecture of intrusions in magmatic mush
Alexandre Carrara, Alain Burgisser, George Bergantz
To cite this version:
Alexandre Carrara, Alain Burgisser, George Bergantz. The architecture of intrusions in magmatic mush. Earth and Planetary Science Letters, Elsevier, 2020, 549, pp.116539. �10.1016/j.epsl.2020.116539�. �hal-02964266�
The architecture of intrusions in magmatic mush
Alexandre Carrara1*, Alain Burgisser1, George W. Bergantz2
1
Univ. Grenoble Alpes, Univ. Savoie Mont Blanc, CNRS, IRD, IFSTTAR, ISTerre, 38000 Grenoble, France.
2
Department of Earth and Space Sciences, Box 351310, University of Washington, Seattle, WA 98195, USA
Abstract: 305 words, Main text: 5239 words, 6 Figures, 3 Tables, 50 references.
Abstract:
Magmatic reservoirs located in the upper crust have been shown to result from the repeated intrusions of new magmas, and spend much of the time as a crystal-rich mush. The geometry of the intrusion of new magmas may greatly affect the thermal and compositional evolution of the reservoir. Despite advances in our understanding of the physical processes that may occur in a magmatic reservoir, the resulting architecture of the composite system remains poorly constrained. Here we performed numerical simulations coupling a computational fluid dynamics and a discrete element method in order to illuminate the geometry and emplacement dynamics of a new intrusion into mush and the relevant physical parameters controlling it. Our results show that the geometry of the intrusion is to first order controlled by the density contrast that exists between the melt phases of the intrusion and resident mush rather than the bulk density contrast as is usually assumed. When the intruded melt is denser than the host melt, the intrusion pounds at the base of the mush and emplaced as a horizontal layer. The occurrence of Rayleigh-Taylor instability leading to the rapid ascent of the intruded material through the mush was observed when the intruded melt was lighter than the host one and was also unrelated to the bulk density contrast. In the absence of density contrasts between the two melt phases, the intrusion may fluidize the host crystal network and slowly ascend through the mush. The effect of the viscosity contrast between the intruded and host materials was found to have a lesser importance on the architecture of intrusions in a mush. Analyzing the eruptive sequence of well documented eruptions involving an intrusion as the trigger shows a good agreement with our modeling results, highlighting the importance of specifically considering granular dynamics when evaluating magmas and mush physical processes.
Introduction:
Evidence for injections of new magmas, also called recharge events, are ubiquitous in magmatic systems (Wiebe, 2016). They are inferred to cause the formation of long-lived, supersolidus magmatic reservoirs located in the upper crust (e.g. Annen et al., 2015, 2006; Dufek and Bergantz, 2005; Karakas et al., 2017). Together with the thermal structure of the upper crust and the frequency of recharge, the geometry and mode of emplacement of the intruded magma was also identified as having a crucial effect on the long-term evolution of igneous bodies (Annen et al., 2015). Diverse evidence supports the view that magmatic reservoirs reside most time in a mush state that is frequently disturbed by injection of new magmas (e.g. Bachmann and Huber, 2016; Cashman et al., 2017, and references therein). A magmatic mush is a crystal-rich magma in which crystals are in close and sometimes frictional contacts, forming a semi-rigid framework where stress is transmitted by force chains (Bergantz et al., 2017). As a result, mushes transition between crystal-rich suspensions to a 'lock-up' state that inhibits the ability of the magma to erupt.
The injection of hotter magma into a cooler host has been suggested as a means to trigger volcanic eruptions (e.g. Caricchi et al., 2014) and the intrusion style plays a fundamental role in the way mush rejuvenates (process of recycling the mush to generate an eruptible magma) prior to eruption (Parmigiani et al., 2014, and references therein). Several scenarios assume that the intruder is emplaced as sills at the base of the mush (underplating), and rejuvenate it by supplying heat but no mass except possibly exsolved volatiles (Bachmann and Bergantz, 2006; Bergantz, 1989; Burgisser and Bergantz, 2011; Couch et al., 2001; Huber et al., 2011). Other scenarios consider that the injected magma may penetrate the mush, producing various degrees of mixing
with the resident mush depending on its buoyant acceleration (e.g. Bergantz and Breidenthal, 2001; Koyaguchi and Kaneko, 2000; Weinberg and Leitch, 1998). Whether an intrusion generates extensive mass transfer, or is limited to thermal exchanges between an underplated intruder and a host mush is thus a key element shaping the outcome of open-system events. A major obstacle to our current understanding of the formation and evolution of igneous bodies is that little is known about the architecture of intrusions and controlling physical parameters.
Traditionally, mush rejuvenation scenarios have been based on the results of experiments performed with pure fluids mimicking the bulk physical properties (density and viscosity) of the magmas (e.g. Huppert et al., 1986; Jellinek and Kerr, 1999; Snyder and Tait, 1995). Mush dynamics, however, differs from that of pure fluids because of the complex rheological feedbacks between melt and crystals. An essential physical process is that melt and crystals may experience relative motions. Numerical simulations explicitly accounting for such decoupled motions as well as the building and destruction of force chains between crystals (Bergantz et al., 2015; Schleicher et al., 2016; Schleicher and Bergantz, 2017) have revealed that the local injection of pure melt of the same density and viscosity as the mush interstitial melt easily fluidizes, penetrates, and partially mixes with the overlying mush if it is sufficiently vigorous. This local unlocking of a mush shows that the conditions for efficient mass transfer and mixing are easier to achieve than previously thought. Conversely, it is adding constraints on rejuvenation scenarios based on the emplacement of an underlying mafic gravity current suggesting that underplating may require contrasts in densities and/or viscosities to hinder fluidization.
Our capacity to interpret the various natural expressions of open-system events, such as eruptive products containing both the intruded magma and the resident mush, is hindered by our
partial understanding of the architectural end-members of these events, such as fluidization or underplating. To characterize the geometry and emplacement styles of intrusion events into a residing mush, we performed numerical simulations using a combination of fluid mechanics and discrete elements (Bergantz et al., 2015; Schleicher et al., 2016; Schleicher and Bergantz, 2017,;; McIntire et al., 2019; Burgisser et al., 2020) . As the dissimilarities between the density and viscosity of the two melts require special attention to better characterize the end-member cases of open-system events, we explored how these parameters condition the dynamics of the intruded material when injected into a mush. We first introduce the numerical model and the dimensionless parameters controlling recharge dynamics that are varied in the simulations. Results of numerical simulations involving magmas of contrasting physical properties are then presented in the framework of the dimensionless parameters. Finally, we relate our results to well-documented cases of eruptions triggered by an intrusion event.
2: Method
In order to characterize the geometry and emplacement mechanism of intrusion in mush accounting for granular dynamics, we performed Computational-Fluid-Dynamic and Discrete-Element-Method (CFD-DEM) numerical simulations by using the MFIX-DEM software (https://mfix.netl.doe.gov/). The coupled melt-crystal flow is computing solving the mass and momentum conservation with a finite volume method for the fluid phase and a discrete model including explicitly of particle’s interactions for the crystal phase. Details about the theory and implementation of the model can be found in Garg et al. (2012), Syamlal (1998), Syamlal et al.
supplementary information 1 for an overview of the numerical model, a discussion about its validity, and a list of the equations we used).
The computational domain is a 3D medium of 1.6 × 0.8 × 0.05 m (length × height × width; 128 × 64 × 4 cells) filled with a resident mush (Fig. 1). This geometry also allowed us to populate the mush with mm-size particles, ensuring that the dimensionless numbers describing the nature of the flow and the contrasts between the physical properties of the two magmas cover the ranges found in nature (see Supplementary information 1). We will show a posteriori that our particle bed behaves identically to a bed twice as thick (Bergantz et al., 2015). Our runs are thus representative of an open system event despite the small size of the domain compared to a natural system. We used such geometry instead of a two dimensional one to ensure that the build-up and breaking of force chains have a sufficient degree of freedom in space to replicate best the mechanics of the granular phase. We created a mush layer of ~0.3 m height with an initial crystal volume fraction of ~0.64 by simulating the settling of the particles in a vacuum and positioning
them at the base of the domain. We used the same density for all particles ( kg m-3) and
three different diameters (4.5, 5, and 5.5 mm, constituting 25, 50, and 25 % of the total number of particles, respectively) to avoid artificial self-organization of the particles in a regular lattice. All simulations use the same initial particle bed. A crystal-free magma is injected at the base of the
mush layer with a superficial vertical velocity, , through an inlet having a width, . The
density and the viscosity of the injected melt are kept constant between all the simulations ( kg m-3; Pa s, see table 2 for the list of the parameters kept constant). We used a conduit of 3.2 cm in height to supply the inlet to ensure that the intruder enters the mush as a Poiseuille flow. At the top of the domain, we used a pressure outflow boundary condition to
ensure the overall mass conservation within the entire domain, which is consistent with an open-system event. The boundary conditions at the front and back of the domain are cyclical, which means that the intruder corresponds to a dyke having one infinite dimension. All the other boundary conditions are non-slip walls (Fig 1). To maintain constant values of melt density and viscosity during the runs (and hence constant density and viscosity contrasts), thermal effects are ignored. This is consistent with the small dimensions of the computational domain that ensure run times shorter than those allowing significant heat exchanges (the characteristic time to diffuse the heat over 1 cell is ~400s and the longest simulations lasts ~500s) In each fluid cell, the local melt density and viscosity depend linearly on the two end-member properties and on their respective concentrations, which are tracked by a transport equation (see Supplementary material 1).
We performed simulations by varying the density and viscosity of the host melt. In order to compare simulations, we used dimensionless quantities to scale the effects of the contrasts in densities and viscosities, and injection velocities. The injection velocity and melt viscosity control the stress applied by the input of new materials to the mush. These parameters enter the
minimum fluidization velocity, (Schleicher et al., 2016, see supplementary information 2 for
derivation of ), which expresses the superficial velocity at which the upward drag force
equals the reduced weight of the particle bed. This threshold is proportional to the density contrast between the particles and the surrounding melt and inversely proportional to melt viscosity. As the injected melt differs from the host melt, two minimum fluidization velocities can be calculated depending on which melt is considered. For all simulations, we used the minimum of these two velocities, which here always corresponds to that using the host melt
. (1)
In simulations having identical , the injection imposes the same stress to the overlying mush.
However, the time needed to inject the same new melt volume changes between simulations
because varies. We thus used a dimensionless time, , to scale the simulation time (Bergantz
et al., 2017):
, (2)
where is the simulation time. In this way, simulations having identical implies that the same
volumes of intruder have been injected until that dimensionless time and simulation results can be compared directly. We use the Atwood number to scale the density contrast between the two
materials. Here, two Atwood numbers may be defined. The first one, , expresses the buoyancy
contrast between the two melts:
, (3)
where is the density of the intruded melt, and is the host melt density. The second one, ,
takes the presence of crystals in the host material into account and scales the bulk densities (the weight of material including crystals and melt per unit of volume):
, (4)
where is the density of the host solids, and is the particle volume fraction. A negative
one indicates a tendency to sink. The viscosity contrast, , between the two melts is expressed as:
, (5)
where is the host dynamic viscosity and is that of the injected melt.
3: Results
We performed 25 numerical simulations to explore the influence of the host melt density and viscosity (See Table 3 for a list of all the simulations and corresponding parameters). For these simulations, the injection velocities are such that the ratio with the respective minimum
fluidization velocity, , remains constant at =21.2. This ratio is chosen to match that used
previously in similar works (Schleicher et al., 2016; Schleicher and Bergantz, 2017) according to the formula presented in the supplementary material 2. We performed an additional 4 simulations
at higher injection velocities to explore the effect of on intrusion dynamics.
Figure 2 plots the simulations at the lowest , 21.2, as functions of the dimensionless
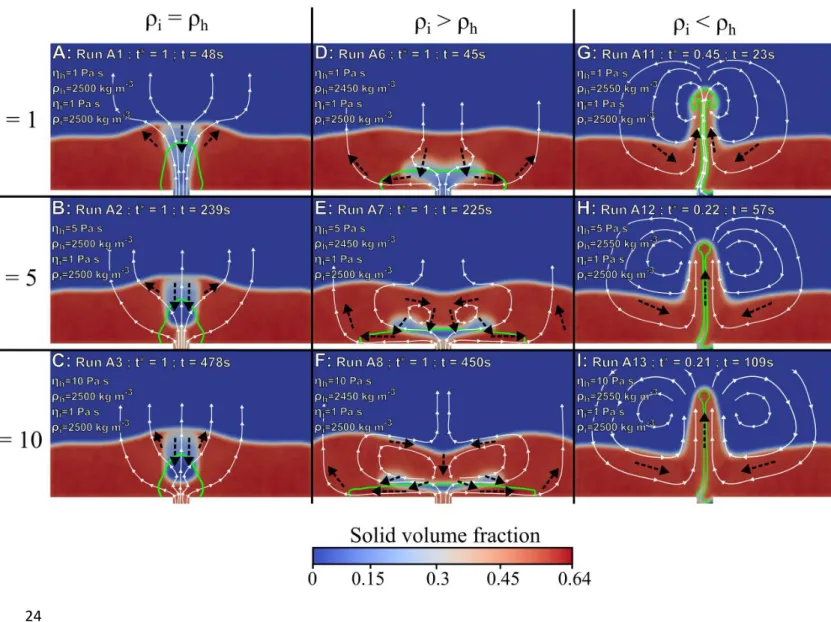
quantities , , and . It shows that the intrusions can be classified in three regimes as a
function of the Atwood number between the two melts, . When , the fluidization regime
is observed. If , the spreading regime occurs, whereas if , the rising regime occurs
(see next paragraph for a detailed description of the regime dynamics). The bulk Atwood number
is always negative and the regime transition occurs at a value (-0.151) of no particular
The fluidization regime was observed in the simulations once , and consists in the development of a fluidized area above the inlet in which the intruded melt rises through the mush (Fig. 3A‒C), as described previously (Bergantz et al., 2015; Schleicher et al., 2016). The fluidization of the mush is initiated by the dilation of the crystal framework to crystal volume fraction below 0.3 above the inlet that locally destabilizes the forces chains network that supports the bed and separates the crystals in contact. The fluidized volume grows vertically above the inlet because of two mechanisms. The first is the upward entrainment of the particles localized above the fluidized cavity, which results in bulging the top surface of the mush layer (Fig. 3A‒C). The second mechanism is the progressive erosion of the crystals jammed at the boundary between the mush and the fluidized volume. Once separated, crystals start settling in the fluidized area because of this process of mush erosion, causing the fluidized area to ascend faster than the intruded melt (green outline in Fig 3A‒C). The intruder flows mainly vertically with a minor lateral porous flow. When the fluidized cavity reaches the top of the particle bed, its width
progressively decreases to stabilize in the shape of a vertical chimney. At steady state, when t*>1,
the crystals located within the chimney show both upward and downward motions whereas the ones located around the chimney flow slowly in the direction of the inlet, forming a ‘mixing bowl’ as a whole, fully recovering the dynamics first described in Bergantz et al. (2015).
The spreading regime, which prevails in simulations once , is characterized by the
lateral spreading of the injected melt similarly to a gravity current hugging the floor of the host reservoir (Fig. 3D‒F). The main difference with a pure fluid gravity current is that the melt is progressively flowing across the mush as permeable flow. At the start of the injection, the crystal framework experienced a dilation, which initiates host crystals settling in the same fashion as in
the fluidization regime. The lateral flow of the intruded melt is able to laterally entrain the host crystals, creating two counter rotating granular vortexes in the residing mush with downward motions above the inlet (Fig. 3D‒F). Such granular vorticity affects the flow pattern of the fluid in the mush. The fluidized volume grows either predominantly laterally or vertically, depending on the relative importance between the lateral entrainment of the host solids by the intruder and the vertical settling of the mush crystals. As the lateral propagation of the intruder progresses, so does the size of the two granular vortexes, making this style of intrusion affect a larger mush volume than the fluidization regime.
The rising regime (Fig. 3G‒I), is characterized by the ascent of the intruded melt within
the mush that occurred in simulations once . Runs start with the initial growth above the
inlet of a cavity filled with the intruded fluid. The cavity becomes gravitationally unstable and ascends within the mush, forming a Rayleigh-Taylor instability. The ascent of the intruder continues above the particle bed, entraining solids from the host. The instability is driven by its head because of the buoyant batch of intruded melt. This driving batch is surrounded by a volume of fluidized host mush (Fig. 3G‒I, better seen in Supplementary Movie 3 as the absence of
particle overlap). The dimensionless time at which the intrusion reaches the mush top (t*~0.3) is
shorter than that of the two other regimes because the Rayleigh-Taylor instability significantly accelerates the transport of the intruder.
Figure 2 suggests that the viscosity contrast does not control the end-member shape of the intruder flow. Larger viscosity contrasts, however, increase the trends of some aspects of mush dynamics. Figure 3 illustrates how viscosity bears on flow patterns.
In the fluidization regime, the increase of the host viscosity enhances the formation of crystal-poor batches at the top of the intruded volume (Fig. 3A‒C). Because the minimum fluidization velocity within the intruded melt is higher than for the host, the crystals are not fluidized and sediment in the intruded melt to accumulate atop the inlet (Fig 3B‒C). Because we
defined t* to scale the dynamics of the mush, the increase of the host melt viscosity decreases the
injection velocity and increases the duration, , required to reach the dimensionless time t*=1. As
a result, increasing melt viscosity decreases the ability for the intruded melt to experience lateral porous flow through the host crystal frameworks (Fig. 3B‒C). It also increases the ratio between crystal terminal velocity in the intruded and host melts, which results in the formation of the crystal poor volume at the top of the intruded volume (Fig. 3B‒C). The increase in the host melt viscosity, however, does not affect the volume of mush inflated by the injection and showing distortion of the force chains.
In the spreading regime, high viscosity contrasts enhance the lateral spreading of the intruder and the entrainment of the host crystals in the two counter rotating vortexes (Fig 3E‒F). Large host melt viscosity causes the lateral entrainment of the solids to be more efficient than particle settling, which results in the elongation of the fluidized volume in the horizontal direction. In the same fashion as in the fluidization regime, the lower superficial injection rate diminishes the ability of the lateral flow to entrain particles, which increases the number of host crystals present in the intruded layer. This effect is expressed by the decrease of the thickness of the intruded layer with the increase of the host viscosity (Fig 3D‒F). It results that reaching the same volume of mush entrained by the intrusion requires less intruded material as the viscosity of the host melt increases.
In the rising regime, increasing the viscosity contrast enlarges the vortexes sizes and the
separation distance between their centers (Fig 3G‒I). The dimensionless time, t*, at which the
intruder instability occurs decreases with the viscosity of the host. The volume of the intruded melt driving the Rayleigh-Taylor instabilities is lower when a viscosity contrast exists. When a viscosity contrast is present, the volume of the intruded melt driving the instability does not vary significantly (Fig 3H‒I). The greater thickness of the intruder when the Rayleigh-Taylor instability significantly accelerates can be explained by considering the ratio between the dimensional injection rate and Rayleigh-Taylor growth rate. In Fig. 3G, this ratio is higher than in Fig 3H‒I, and a significant volume of fluid is injected before the instability accelerates. On the contrary, in Fig 3H‒I, this ratio is small and so is the amount of melt injected before the acceleration of the instability. However, the volume of the mush remobilized by the intruder flow does not significantly vary with the host melt viscosity (Fig. 3G‒I).
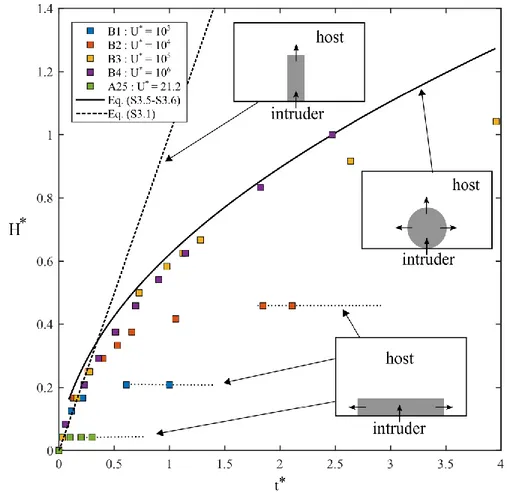
The additional 4 simulations in the spreading regime suggest that buoyancy effects
dominate the intruder flow up to . Figure 4 shows the temporal evolution of the height
reached by the intruded volume, , as a function of injection rate. All injections grow purely
vertically at first ( ). As seen above, at the low injection rate of 21.2, the intrusion stalls
rapidly and spreads laterally (simulation A25, Fig. 4). Increasing the injection rate causes stalling
to occur later and higher. When , injection growth switches from vertical to radial. When
, the behavior of the intruder is dominated by the injection rate, which causes the
radially growing intrusion to reach the top of the bed at . Despite that all simulations have
the same intruder shape before stalling, the size of the region surrounding the intruder that is
strictly follows the theoretical curve for a radial growth and reaches at , as predicted by geometrical arguments (supplementary information 3).
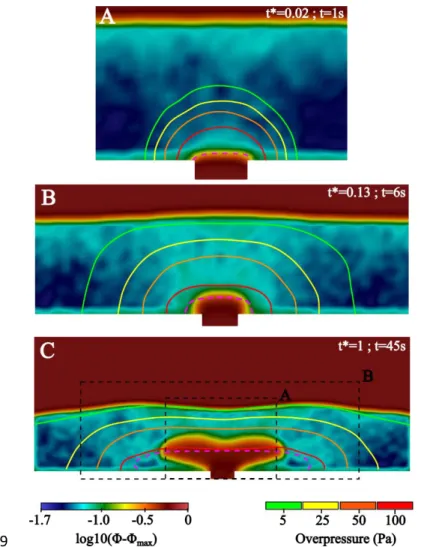
Mush dilation is key for permeable melt flow to occur. The initiation of the intrusion increases the pore pressure in the mush around the inlet (Fig. 5A). This overpressure progressively propagates outwards and decreases the crystal volume fraction in the overlying mush (Fig. 5B). As the intrusion propagates, the effect of the overpressure is supplemented with the Reynolds dilatancy generated by the granular vortexes in the mush (Fig 5C). The dilation of the solid framework increases its permeability of the solid framework and in turn the possibility of relative motion between the crystals and the interstitial melt (Fig. 5C). This phenomenon is particularly clear in the case of the rising regime. The intruder is surrounded by a volume of mush that underwent such dilation that it is in the dilute regime. The contact region between the two magmas is dominated by melt–melt interface interspersed with isolated crystals. As a result, entrainment is ruled by melt vorticity.
4: Comparison with natural systems
To test the applicability of our results to natural cases, we gathered from the literature the physical parameters of 13 eruptions involving the intrusion of new magma (Table S3‒S4 in the supplementary information 5). All host magmas are well-characterized but for a few cases for which there is ambiguity on the respective roles of the intruder and host magmas (Unzen, Minoan, and Katmai–Novarupta). In the studies surveyed, melt viscosity and melt density of host magmas were most often directly determined from eruptive products and pre-eruptive conditions
such as pressure, temperature, and melt water content (details on how parameters were obtained are in Table S3‒S4 (see supplementary information 5)).
Cases are organized into three categories depending on the observed eruptive sequence. In the first category, the intruder was erupted first, followed by the emission of host magma or a mixture of host and intruder. This category implies that the intruder magma was able to efficiently penetrate and pass through the host magma. In the second category, both host and intruder magmas were erupted simultaneously, with the intruder most often forming enclaves or mingling structures. The last category feature cases where the mixing was so thorough that the eruptive products only bear cryptic traces of the intruder, such as isolated intruder crystals floating in the host or crystal disequilibrium textures.
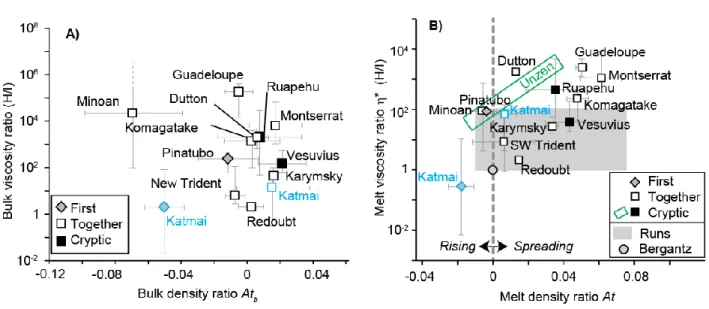
Figure 6A shows the ratios of bulk viscosities and bulk densities between the intruder magma and the host magma(s) for the 13 eruptions. Figure 6A contains two physically meaningful thresholds, that of neutral buoyancy at the bulk density ratio of 0 and that of equal viscosity at the bulk viscosity ratio of one. The three types of eruptive sequence are not sorted following any of these thresholds. Figure 6B shows the same eruptions plotted as functions of melt properties instead of bulk properties. Our numerical runs cover the full range of natural density ratios and a more restricted range of viscosity ratios (from 1 to 102 vs. 10-2 to 104 in nature). Figure 6B also shows the dividing line between rising and spreading dynamics at the level of neutral buoyancy with respect to the melts. With the possible exception of the 1912 Katmai–Novarupta eruption (see Discussion), the rising regime is populated by the eruptions that first ejected intruder material. This divide between cases where at least some of the intruder
magma had the capacity to go unscathed through the host and cases where none of it escaped from host interaction is consistent with our numerical results.
5: Discussion
Our results are helpful to predict the behavior of an intrusion within a mush. The Atwood
number between the two melts, , is the parameter having a first order control on the geometry
of the intrusion. On the contrary, the commonly used level of neutral bulk buoyancy (e.g. Huppert et al., 1986; Snyder and Tait, 1995) does not mark any particular change in dynamic behavior (Fig. 2). This result illustrates that the relative motion between the solids and surrounding melt is of primary importance when studying mush processes. Experiments, or numerical simulations, that account of the presence of the solids or exsolved volatiles as discrete entities (e.g. Barth et al., 2019; Bergantz et al., 2015; Girard and Stix, 2009; Hodge et al., 2012; McIntire et al., 2019; Michioka and Sumita, 2005; Parmigiani et al., 2014; Schleicher et al., 2016; Schleicher and Bergantz, 2017) are the most likely to faithfully reproduce mush dynamics. Neglecting phase decoupling by considering the magma as a single-phase fluid having effective properties such as bulk density or bulk viscosity will not capture the blending of crystal contents between host and intruder and the simultaneous but independent evolution of the melt–melt interface (Fig. 5C).
The decoupling between the motions of the two phases results from processes unique to granular mechanics that our discrete numerical model is able to capture. Mush dilation causes entrainment by melt vorticity alone (Fig. 5). Efficient entrainment of two fluids with a viscosity contrast occurs only when the most viscous fluid bears large levels of vorticity (Jellinek and Kerr,
vorticity is concentrated close to or inside the intrusion (Fig. S4 in the supplementary information 4). This situation yields the weak entrainment observed in the rising regime and the transition from vertical growth to spreading of the intrusion melt as injection velocity decreases (Fig. 4). The concept of bulk density thus fails to predict the intrusion geometry for two reasons. First, it assumes the absence of relative motion and thus ignores the transfer of crystals from host to intrusion. Second, in cases when sufficient mush dilation occurs, entrainment is controlled by the melt–melt interface and the associated density and viscosity contrasts. The interplay between pore pressure, dilation, melt interface dynamics, and permeable flow controls the transport of mass within our modeled magmatic reservoir.
We characterized the parameter ranges of a series of well-documented cases of eruptions that features magma mixing, focusing on the densities and viscosities of the two end-member magmas involved and on the order of the eruptive sequence. One case, Katmai, straddles two eruptive sequence categories because the intruders may have been transported alongside (as opposed to through) the host magmas. Both scenarios are close to the neutral buoyancy level (Fig. 6B) and each individual scenario is consistent with our regimes. The Katmai eruption first emitted rhyolite. The Katmai scenario corresponding to a rhyolite intruding a more mafic host (Eichelberger and Izbekov, 2000) is consistent with it being located in the rising regime. In the other scenario (Singer et al., 2016), the rhyolite is part of the host reservoir, which is consistent with that scenario being in the spreading regime. The overall good agreement between the observed eruptive sequences and our numerical results (Fig. 6B) supports the fact that open-system events are, to first order, controlled by the density contrast between the melt phases of the
intrusion and mush. It also suggests that injection momentum was quickly exhausted, letting buoyancy control the unfolding of the event.
One special natural case can be evaluated against our dynamic regimes. The intruder of the 1991–1995 eruption of Unzen volcano could have been either andesitic (Holtz et al., 2004), or basaltic (Browne et al., 2006). Regardless of its composition, the intrusion caused thorough mixing and the first magma erupted was the product of this mixing. If the intruder was basaltic, it was buoyant with respect to the felsic host and if it was andesitic, it was denser that the host. As a result, Unzen spans the divide between the rising and spreading regime (Fig. 6B). Considering that the intruder input was large (>30 wt% of the eruptive products; Holtz et al., 2005), and if any credit is given to our inferences, the intruder was more likely to be andesitic than basaltic because this latter composition would have been prone to preserve its integrity while going through the host mush, erupting first.
6: Conclusions
This study highlights the importance of granular mechanics in mush processes, which differ significantly from ones expected with purely fluid models. As expected, our simulations
show that when the injection velocity is high ( ), intrusion dynamics is dominated by the
injection momentum and the intruded cavities grow radially. When the injection velocity is below this threshold, however, buoyancy controls the behavior of the intruder in an unexpected way. Bulk buoyancy contrasts appear to play no role in the way the intruder flows. Instead, the density contrast between the host and intruded melts exerts a first-order control on the architecture of an
intrusion event in a mush. When the two melt densities are identical, the intruder fluidizes the mush and creates a mixing bowl, as described in Bergantz et al. (2015). When the intruded melt is lighter than that of the host, it rises through the mush. Mush dilation around the intruder causes the contact region between the two magmas to be dominated by melt–melt interface interspersed with isolated crystals. Entrainment in this rising regime is ruled by the amount of vorticity of the most viscous melt. As in our runs the intruder melt viscosity was equal or lower than that of the host, no entrainment was observed. Intruder melts denser than the host spread laterally partly as permeable flows through the host mush. The lateral spreading of the intruder generates two counter rotating granular vortexes with downward motions above the inlet, which maximizes the volume of the mush entrained by the gravity current. In this spreading regime, the combined effects of the initial pore overpressure at the inlet and the Reynolds dilatancy resulting from the lateral spreading of the intruder are able to fluidize the overlying mush.
We tested whether the first-order effect of melt density contrast was expressed in nature. We tallied 13 well-documented eruptive sequences, classifying them according to the expected outcomes of the three dynamic regimes we defined. We found overall good agreement between eruption sequences and our model predictions, which suggests that pore pressure, dilatancy, and permeable flow play a fundamental role in the unfolding of open-system events. Granular dynamics and the decoupling of melt and crystals are thus key in shaping reservoir and volcanic processes.
All the numerical simulations presented in this paper were performed using the CIMENT
infrastructure (https://ciment.ujf-grenoble.fr), which is supported by the Rhône-Alpes region
(GRANT CPER07_13 CIRA: http://www.ci-ra.org). This work was partially supported by the
Agence Nationale pour la Recherche grant ANR-19-CE31-0007. G.W.B. was supported by National Science Foundation grants DGE-1256068, EAR-1049884 and EAR-1447266. Authors declare no conflicts of interest.
References:
Annen, C., Blundy, J.D., Leuthold, J., Sparks, R.S.J., 2015. Construction and evolution of igneous bodies: Towards an integrated perspective of crustal magmatism. Lithos 230, 206–221.
https://doi.org/10.1016/j.lithos.2015.05.008
Annen, C., Blundy, J.D., Sparks, R.S.J., 2006. The Genesis of Intermediate and Silicic Magmas in Deep Crustal Hot Zones. J Petrology 47, 505–539. https://doi.org/10.1093/petrology/egi084
Bachmann, O., Bergantz, G.W., 2006. Gas percolation in upper-crustal silicic crystal mushes as a
mechanism for upward heat advection and rejuvenation of near-solidus magma bodies. Journal of Volcanology and Geothermal Research 149, 85–102.
https://doi.org/10.1016/j.jvolgeores.2005.06.002
Bachmann, O., Huber, C., 2016. Silicic magma reservoirs in the Earth’s crust. American Mineralogist 101, 2377–2404. https://doi.org/10.2138/am-2016-5675
Barth, A., Edmonds, M., Woods, A., 2019. Valve-like dynamics of gas flow through a packed crystal mush and cyclic strombolian explosions. Sci Rep 9, 1–9. https://doi.org/10.1038/s41598-018-37013-8
Bergantz, G.W., 1989. Underplating and Partial Melting: Implications for Melt Generation and Extraction. Science 245, 1093–1095. https://doi.org/10.1126/science.245.4922.1093
Bergantz, G.W., Breidenthal, R.E., 2001. Non-stationary entrainment and tunneling eruptions: A dynamic link between eruption processes and magma mixing. Geophysical Research Letters 28, 3075– 3078. https://doi.org/10.1029/2001GL013304
Bergantz, G.W., Schleicher, J.M., Burgisser, A., 2017. On the kinematics and dynamics of crystal-rich systems. J. Geophys. Res. Solid Earth 122, 2017JB014218. https://doi.org/10.1002/2017JB014218 Bergantz, G.W., Schleicher, J.M., Burgisser, A., 2015. Open-system dynamics and mixing in magma
mushes. Nature Geosci 8, 793–796. https://doi.org/10.1038/ngeo2534
Browne, B.L., Eichelberger, J.C., Patino, L.C., Vogel, T.A., Uto, K., Hoshizumi, H., 2006. Magma mingling as indicated by texture and Sr/Ba ratios of plagioclase phenocrysts from Unzen volcano, SW Japan. Journal of Volcanology and Geothermal Research, Modern Trends in Petrography: 154, 103–116. https://doi.org/10.1016/j.jvolgeores.2005.09.022
Burgisser, A., Bergantz, G.W., 2011. A rapid mechanism to remobilize and homogenize highly crystalline magma bodies. Nature 471, 212–215. https://doi.org/10.1038/nature09799
Burgisser, A., Carrara, A., Annen, C., in review. Numerical simulations of magmatic enclave deformation. Journal of Volcanology and Geothermal Research (submitted).
Cadoux, A., Scaillet, B., Druitt, T.H., Deloule, E., 2014. Magma Storage Conditions of Large Plinian Eruptions of Santorini Volcano (Greece). J Petrology 55, 1129–1171.
https://doi.org/10.1093/petrology/egu021
Caricchi, L., Annen, C., Blundy, J., Simpson, G., Pinel, V., 2014. Frequency and magnitude of volcanic eruptions controlled by magma injection and buoyancy. Nature Geoscience 7, 126–130.
https://doi.org/10.1038/ngeo2041
Cashman, K.V., Sparks, R.S.J., Blundy, J.D., 2017. Vertically extensive and unstable magmatic systems: A unified view of igneous processes. Science 355, eaag3055.
https://doi.org/10.1126/science.aag3055
Coombs, M.L., Gardner, J.E., 2001. Shallow-storage conditions for the rhyolite of the 1912 eruption at Novarupta, Alaska. Geology 29, 775–778.
https://doi.org/10.1130/0091-7613(2001)029<0775:SSCFTR>2.0.CO;2
Couch, S., Sparks, R.S.J., Carroll, M.R., 2001. Mineral disequilibrium in lavas explained by convective self-mixing in open magma chambers. Nature 411, 1037–1039. https://doi.org/10.1038/35082540 Druitt, T.H., 2014. New insights into the initiation and venting of the Bronze-Age eruption of Santorini
(Greece), from component analysis. Bull Volcanol 76, 794. https://doi.org/10.1007/s00445-014-0794-x
Dufek, J., Bergantz, G.W., 2005. Lower Crustal Magma Genesis and Preservation: a Stochastic Framework for the Evaluation of Basalt–Crust Interaction. J Petrology 46, 2167–2195. https://doi.org/10.1093/petrology/egi049
Eichelberger, J.C., Izbekov, P.E., 2000. Eruption of andesite triggered by dyke injection: contrasting cases at Karymsky Volcano, Kamchatka and Mt Katmai, Alaska. Philosophical Transactions of the Royal Society of London. Series A: Mathematical, Physical and Engineering Sciences 358, 1465– 1485.
Flaherty, T., Druitt, T.H., Tuffen, H., Higgins, M.D., Costa, F., Cadoux, A., 2018. Multiple timescale constraints for high-flux magma chamber assembly prior to the Late Bronze Age eruption of Santorini (Greece). Contrib Mineral Petrol 173, 75. https://doi.org/10.1007/s00410-018-1490-1 Garg, R., Galvin, J., Li, T., Pannala, S., 2012. Open-source MFIX-DEM software for gas–solids flows:
Part I—Verification studies. Powder Technology 220, 122–137.
Girard, G., Stix, J., 2009. Buoyant replenishment in silicic magma reservoirs: Experimental approach and implications for magma dynamics, crystal mush remobilization, and eruption. J. Geophys. Res. 114, B08203. https://doi.org/10.1029/2008JB005791
Hammer, J.E., Rutherford, M.J., Hildreth, W., 2002. Magma storage prior to the 1912 eruption at Novarupta, Alaska. Contributions to Mineralogy and Petrology 144, 144–162.
Hodge, K.F., Carazzo, G., Jellinek, A.M., 2012. Experimental constraints on the deformation and breakup of injected magma. Earth and Planetary Science Letters 325–326, 52–62.
https://doi.org/10.1016/j.epsl.2012.01.031
Holtz, F., Sato, H., Lewis, J., Behrens, H., Nakada, S., 2004. Experimental petrology of the 1991–1995 Unzen dacite, Japan. Part I: phase relations, phase composition and pre-eruptive conditions. Journal of petrology 46, 319–337.
Huber, C., Bachmann, O., Dufek, J., 2011. Thermo-mechanical reactivation of locked crystal mushes: Melting-induced internal fracturing and assimilation processes in magmas. Earth and Planetary Science Letters 304, 443–454. https://doi.org/10.1016/j.epsl.2011.02.022
Huppert, H.E., Sparks, R.S.J., Whitehead, J.A., Hallworth, M.A., 1986. Replenishment of magma chambers by light inputs. Journal of Geophysical Research: Solid Earth 6113–6122. https://doi.org/10.1029/JB091iB06p06113@10.1002/(ISSN)2169-9356.OPENSYS1
Jellinek, A.M., Kerr, R.C., 1999. Mixing and compositional stratification produced by natural convection: 2. Applications to the differentiation of basaltic and silicic magma chambers and komatiite lava
flows. Journal of Geophysical Research: Solid Earth 104, 7203–7218. https://doi.org/10.1029/1998JB900117
Karakas, O., Degruyter, W., Bachmann, O., Dufek, J., 2017. Lifetime and size of shallow magma bodies controlled by crustal-scale magmatism. Nature Geoscience 10, 446–450.
https://doi.org/10.1038/ngeo2959
Koyaguchi, T., Kaneko, K., 2000. Thermal evolution of silicic magma chambers after basalt replenishments. Earth and Environmental Science Transactions of The Royal Society of Edinburgh 91, 47–60. https://doi.org/10.1017/S0263593300007288
Li, T., Garg, R., Galvin, J., Pannala, S., 2012. Open-source MFIX-DEM software for gas-solids flows: Part II—Validation studies. Powder Technology 220, 138–150.
Mandeville, C.W., Carey, S., Sigurdsson, H., 1996. Magma mixing, fractional crystallization and volatile degassing during the 1883 eruption of Krakatau volcano, Indonesia. Journal of Volcanology and Geothermal Research 74, 243–274.
Martin, V.M., Davidson, J., Morgan, D., Jerram, D.A., 2010. Using the Sr isotope compositions of feldspars and glass to distinguish magma system components and dynamics. Geology 38, 539– 542. https://doi.org/10.1130/G30758.1
Mastin, L.G., 2002. Insights into volcanic conduit flow from an open-source numerical model. Geochemistry, Geophysics, Geosystems 3, 1–18. https://doi.org/10.1029/2001GC000192 McIntire, M.Z., Bergantz George W., Schleicher Jillian M., 2019. On the hydrodynamics of crystal
clustering. Philosophical Transactions of the Royal Society A: Mathematical, Physical and Engineering Sciences 377, 20180015. https://doi.org/10.1098/rsta.2018.0015
Michioka, H., Sumita, 2005. Rayleigh‐ Taylor instability of a particle packed viscous fluid: Implications for a solidifying magma. Geophysical Research Letters 32.
https://doi.org/10.1029/2004GL021827
Nakamura, M., 1995. Continuous mixing of crystal mush and replenished magma in the ongoing Unzen eruption. Geology 23, 807–810.
Pallister, J.S., Hoblitt, R.P., Meeker, G.P., Knight, R.J., Siems, D.F., 1996. Magma mixing at Mount Pinatubo: petrographic and chemical evidence from the 1991 deposits. Fire and mud: eruptions and lahars of Mount Pinatubo, Philippines 687–731.
Parmigiani, A., Huber, C., Bachmann, O., 2014. Mush microphysics and the reactivation of crystal-rich magma reservoirs. Journal of Geophysical Research: Solid Earth 119, 6308–6322.
https://doi.org/10.1002/2014JB011124
Schleicher, J.M., Bergantz, G.W., 2017. The Mechanics and Temporal Evolution of an Open-system Magmatic Intrusion into a Crystal-rich Magma. J Petrology 58, 1059–1072.
https://doi.org/10.1093/petrology/egx045
Schleicher, J.M., Bergantz, G.W., Breidenthal, R.E., Burgisser, A., 2016. Time scales of crystal mixing in magma mushes. Geophysical Research Letters 43, 1543–1550.
https://doi.org/10.1002/2015GL067372
Self, S., 1992. Krakatau revisited: The course of events and interpretation of the 1883 eruption. GeoJournal 28, 109–121. https://doi.org/10.1007/BF00177223
Singer, B.S., Costa, F., Herrin, J.S., Hildreth, W., Fierstein, J., 2016. The timing of compositionally-zoned magma reservoirs and mafic ‘priming’ weeks before the 1912 Novarupta-Katmai rhyolite
eruption. Earth and Planetary Science Letters 451, 125–137. https://doi.org/10.1016/j.epsl.2016.07.015
Snyder, D., Tait, S., 1995. Replenishment of magma chambers: comparison of fluid-mechanic experiments with field relations. Contrib Mineral Petrol 122, 230–240.
https://doi.org/10.1007/s004100050123
Syamlal, M., Rogers, W., OBrien, T.J., 1993. MFIX documentation theory guide. USDOE Morgantown Energy Technology Center, WV (United States).
Tomiya, A., Takahashi, E., 1995. Reconstruction of an Evolving Magma Chamber beneath Usu Volcano since the 1663 Eruption. J Petrology 36, 617–636. https://doi.org/10.1093/petrology/36.3.617 Weinberg, R.F., Leitch, A.M., 1998. Mingling in mafic magma chambers replenished by light felsic
inputs: fluid dynamical experiments. Earth and Planetary Science Letters 157, 41–56. https://doi.org/10.1016/S0012-821X(98)00025-9
Wiebe, R.A., 2016. Mafic replenishments into floored silicic magma chambers. American Mineralogist 101, 297–310. https://doi.org/10.2138/am-2016-5429
Tables:
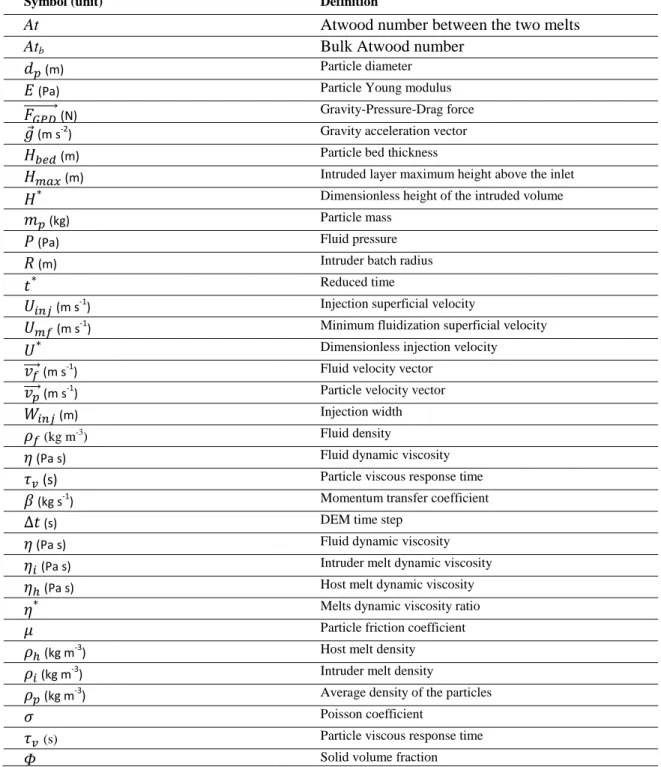
Symbol (unit) Definition
At Atwood number between the two melts
Atb Bulk Atwood number
(m) Particle diameter
(Pa) Particle Young modulus
(N) Gravity-Pressure-Drag force
(m s-2) Gravity acceleration vector
(m) Particle bed thickness
(m) Intruded layer maximum height above the inlet
Dimensionless height of the intruded volume
(kg) Particle mass
(Pa) Fluid pressure
(m) Intruder batch radius
Reduced time
(m s-1) Injection superficial velocity
(m s-1) Minimum fluidization superficial velocity
Dimensionless injection velocity
(m s-1) Fluid velocity vector (m s-1) Particle velocity vector
(m) Injection width
(kg m-3
) Fluid density
(Pa s) Fluid dynamic viscosity
(s) Particle viscous response time
(kg s-1) Momentum transfer coefficient
(s) DEM time step
(Pa s) Fluid dynamic viscosity
(Pa s) Intruder melt dynamic viscosity
(Pa s) Host melt dynamic viscosity
Melts dynamic viscosity ratio
Particle friction coefficient
(kg m-3) Host melt density
(kg m-3) Intruder melt density
(kg m-3) Average density of the particles
Poisson coefficient
(s) Particle viscous response time
Solid volume fraction
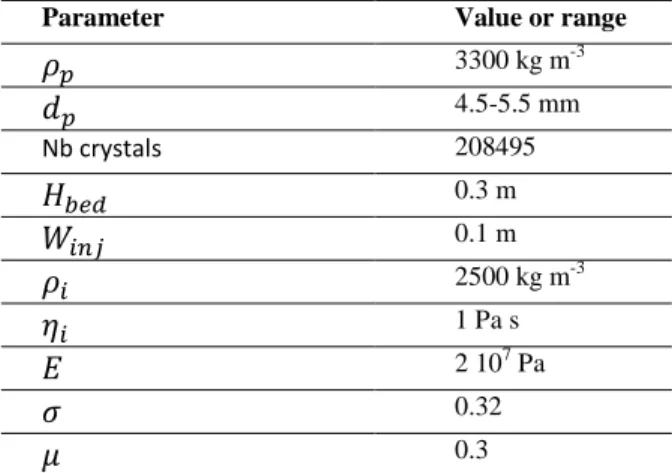
Parameter Value or range 3300 kg m-3 4.5-5.5 mm Nb crystals 208495 0.3 m 0.1 m 2500 kg m-3 1 Pa s 2 107 Pa 0.32 0.3
Table 2: Parameters kept constant during the parametric study
Run nb. (kg m-3) (kg m-3) (Pa s) (m s -1) (m s -1) A1 250 0 3012 0 -0,151 1 2.956 10-4 6.268 10-3 A2 250 0 3012 0 -0,151 5 5.913 10-5 1.254 10-3 A3 250 0 3012 0 -0,151 10 2.957 10-5 6.268 10-4 A4 250 0 3012 0 -0,151 50 5.913 10-6 1.254 10-4 A5 250 0 3012 0 -0,151 100 2.957 10-6 6.268 10-5 A6 245 0 2994 1.0 10-2 -0,146 1 3.141 10-4 6.660 10-3 A7 245 0 2994 1.0 10-2 -0,146 5 6.283 10-5 1.332 10-3 A8 245 0 2994 1.0 10-2 -0,146 10 3.141 10-5 6.660 10-4 A9 245 0 2994 1.0 10-2 1,0 10-2 -0,146 50 6.283 10-6 1.332 10-4 A10 245 0 2994 1.0 10-2 -0,146 100 3.141 10-6 6.660 10-5 A11 255 0 3030 -9.9 10-3 -0,155 1 2.772 10-4 5.876 10-3 A12 255 0 3030 -9.9 10-3 -0,155 5 5.544 10-5 1.175 10-3 A13 255 0 3030 -9.9 10-3 -0,155 10 2.772 10-5 5.876 10-4 A14 255 0 3030 -9.9 10-3 -0,155 50 5.544 10-6 1.175 10-4 A15 255 0 3030 -9.9 10-3 -0,155 100 2.772 10-6 5.876 10-5 A16 220 0 2904 6.4 10-2 -0,123 1 4.065 10-4 8.618 10-3 A17 220 0 2904 6.4 10-2 -0,123 5 8.130 10-5 1.724 10-3 A18 220 0 2904 6.4 10-2 -0,123 10 4.065 10-5 8.618 10-4 A19 220 0 2904 6.4 10-2 -0,123 50 8.130 10-6 1.724 10-4 A20 220 0 2904 6.4 10-2 -0,123 100 4.065 10-6 8.618 10-5 A21 215 0 2886 7.5 10-2 -0,118 1 4.250 10-4 9.010 10-3 A22 215 0 2886 7.5 10-2 -0,118 5 8.500 10-4 1.802 10-3 A23 215 0 2886 7.5 10-2 -0,118 10 4.250 10-5 9.010 10-4 A24 215 0 2886 7.5 10-2 -0,118 50 8.500 10-6 1.802 10-4 A25 215 0 2886 7.5 10-2 -0,118 100 4.250 10-6 9.010 10-5 B1 215 2886 7.5 10-2 - 100 4.250 4.250
Run nb. (kg m-3) (kg m-3) (Pa s) (m s -1) (m s -1) B2 215 0 2886 7.5 10-2 -0,118 100 4.250 10-6 4.250 10-2 B3 215 0 2886 7.5 10-2 -0,118 100 4.250 10-6 4.250 10-1 B4 215 0 2886 7.5 10-2 -0,118 100 4.250 10-6 4.250 100
1
Figure 1: Simulations initial condition. [A] The drawing represents the computational domain
2
viewed from the front. The medium is composed by rectangular box, which is fed by a conduit at
3
its base. Particles are settled to generate a particle bed having a thickness . Background colors
4
indicate which fluid is present initially in the computational domain. Blue corresponds to the host
5
melt and green to the intruded melt. Red arrows below the conduit represent the velocity profile
6
of the injected fluid (Poiseuille flow). Arrows atop the domain indicate that the boundary
7
condition is a fixed pressure outflow. The hatched walls indicate non-slip boundary conditions.
8
[B] Side view of the computational domain. The green dashed lines indicate that cyclical
9
boundary conditions are used for these walls. The dotted circles indicate particles overlapping
10
with one of the two cyclical boundary conditions and that are also considered to be present on the
11
opposite side.
12
13
15
16
Figure 2: Regime diagram of intrusion behavior for U*=21.2. The diagram represents the
17
positions of the simulations A1‒25 as functions of the Atwood numbers (abscissa) and viscosity
18
ratios (ordinate). Each square represents a simulation. Square colors depend on the observed
19
regime (blue=rising; black=fluidization; red=lateral spreading). The vertical dashed line
20
interpolates where the fluidization is expected to prevail.
21
22
24
Figure 3: Comparison of the effects of buoyancy and viscosity contrasts. Each section represents
25
the advancement of the simulation at t*=1 (or when the rising instability is above the particle
26
bed). The injected melt contours are indicated with green curves. The dashed black arrows
27
indicate the presence and direction of granular flows. The thin white curves indicate the fluid
28
streamlines with small arrowheads indicating flow direction.
29
31
Figure 4: Evolution of the height, H*, of the intruded volume as a function of the dimensionless
32
time t*. Each square represents the height of the top of the intruded volume measured in the
33
simulations. Square colors indicate injection rate. Dashed lines indicate the theoretical intruder
34
front height evolution in the case of vertical propagation (supplementary information 3) The
35
black curve is the theoretical front height for a radial growth, and the horizontal dotted lines
36
indicate the front height evolution during lateral spreading. The three insets illustrate intrusion
37
behaviors.
39
Figure 5: Evolution of the pore pressure and crystal volume fraction. On each inset, the color
40
depend on the difference between the local crystal volume fraction, Φ, and the maximum one,
41
Φmax (Φmax=0.64), in a logarithmic scale. The overpressure with respect to the initial hydrostatic
42
pressure field is indicated with contour that corresponds to the isosurfaces where the overpressure
43
are equal to 5, 25, 50, and 100 Pa. The pink dashed curves represent the boundary between the
44
injected and resident melt. Inset [A] and [B] are captured after 1s and 6s. Both only displayed the
45
portion of the mush layer that present overpressure and dilation. Inset [C] is acquired after 45s
46
and cover a slice of the entire computational domain. The two dashed rectangle indicate the
47
extent of insets [A] and [B].
49
50
Figure 6: Ratios of physical properties for the host and intruder magmas involved in 13
51
eruptions. Viscosity ratios are that of the host over that of the intruder and the density ratios are
52
measured by the Atwood numbers. Eruptions are sorted according to whether the intruder magma
53
was erupted first (“First”), at the same time as (or mixed with) the host (“Together”), or fully
54
mixed with the host (“Cryptic”). [A] Ratios of bulk properties. [B] Ratios of melt properties. The
55
gray area covers the runs done in this study and the circle marks the parameters used in the
56
numerical study of Bergantz et al. (2015). See text for details regarding the special case of Unzen.
57 58
![Figure 1: Simulations initial condition. [A] The drawing represents the computational domain 2](https://thumb-eu.123doks.com/thumbv2/123doknet/13707688.434131/29.918.112.583.121.410/figure-simulations-initial-condition-drawing-represents-computational-domain.webp)