HAL Id: hal-01728420
https://hal.archives-ouvertes.fr/hal-01728420
Submitted on 12 Mar 2018
HAL is a multi-disciplinary open access archive for the deposit and dissemination of sci-entific research documents, whether they are pub-lished or not. The documents may come from teaching and research institutions in France or abroad, or from public or private research centers.
L’archive ouverte pluridisciplinaire HAL, est destinée au dépôt et à la diffusion de documents scientifiques de niveau recherche, publiés ou non, émanant des établissements d’enseignement et de recherche français ou étrangers, des laboratoires publics ou privés.
A TEM study of the crystallography of lath-shaped
austenite precipitates in a duplex stainless steel
Juan Du, Frédéric Mompiou, Wen-Zheng Zhang
To cite this version:
Juan Du, Frédéric Mompiou, Wen-Zheng Zhang. A TEM study of the crystallography of lath-shaped austenite precipitates in a duplex stainless steel. Journal of Materials Science, Springer Verlag, 2017, 52 (19), pp.11688-11700. �10.1007/s10853-017-1324-y�. �hal-01728420�
A TEM study of the crystallography of lath-shaped austenite
precipitates in a duplex stainless steel
Juan Dua, Frédéric Mompioub, Wen-Zheng Zhanga, *
aKey Laboratory of Advanced Materials (MOE), School of Materials Science and
Engineering, Tsinghua University, Beijing, 100084, P R China
bCEMES-CNRS and Université de Toulouse, 29 rue J. Marvig, 31055 Toulouse,
France
E-mail addresses of all authors:
Juan Du juandu2008@163.com
Frédéric Mompiou mompiou@cemes.fr
*Corresponding author: Wen-Zheng Zhang, Tel: +86-010-62773795, e-mail:
zhangwz@mail.tsinghua.edu.cn
Manuscript Click here to download Manuscript manuscript.docx
Click here to view linked References
1 2 3 4 5 6 7 8 9 10 11 12 13 14 15 16 17 18 19 20 21 22 23 24 25 26 27 28 29 30 31 32 33 34 35 36 37 38 39 40 41 42 43 44 45 46 47 48 49 50 51 52 53 54 55 56 57 58 59 60 61
Abstract:
The morphology of austenite (fcc) precipitates in a duplex stainless steel (DSS) is dominated by rods distributed in a ferrite (bcc) matrix. Minority of austenite precipitates also exhibits a lath shape, a common morphology in fcc to bcc transformations rather than a bcc to fcc transformation in a DSS. While the rod-shaped austenite precipitates in a DSS have been interpreted in previous investigations, precipitates with a lath shape were not well understood. This study focused on the lath-shaped austenite by using transmission electron microscopy. The habit plane of lath-shaped austenite was observed to be free of dislocations, but one array of dislocations was observed in the major side facet with a spacing of 9.6nm and Burgers vector of [110] /2 | [010] . These observations of crystallographic features f b were interpreted consistently by an O-line and good matching site analysis. Different morphologies in a DSS and similar morphologies in fcc to bcc and bcc to fcc transformations are compared and discussed.
Keywords: Phase transformation crystallography; Precipitate morphology; Habit plane; Interfacial dislocation; Orientation relationship
1. Introduction
Interphase boundaries between fcc and bcc phases have been studied in numerous theoretical and experimental investigations, since they are key features for understanding of precipitation transformations in many important metallic alloys, such as steels and brass. Quantitative experimental characterizations of fcc/bcc interfacial structures have been conducted in Ni-Cr [1-4], Cu-Cr [5-7], Fe-Cu [8-10] and duplex stainless steel (DSS) [11-13]. For interpreting the observed precipitation crystallography, researchers have applied various models, including the structural ledge model [5,14], the O-lattice theory [15-18], the invariant line strain model [1,19-21], the O-line model [22,23] and the near coincidence sites (NCS) model [24]. In most alloys containing fcc and bcc phases, a transformation between two phases usually starts from an fcc matrix to the product phase of bcc as the temperature decreases, such as Cu-Cr alloy, Ni-Cr alloy, and low-carbon steels. There are many
1 2 3 4 5 6 7 8 9 10 11 12 13 14 15 16 17 18 19 20 21 22 23 24 25 26 27 28 29 30 31 32 33 34 35 36 37 38 39 40 41 42 43 44 45 46 47 48 49 50 51 52 53 54 55 56 57 58 59 60 61
crystallographic similarities in fcc → bcc phase transformations in different alloys. The lattice parameter ratios of af/ab all fall between 1.25 and 1.26 in the above
mentioned fcc/bcc alloy systems (af and ab refer to the lattice parameter of the fcc and
bcc lattice, and the subscript f and b represent fcc and bcc lattices, respectively) [1-3,5-7]. The orientation relationship (OR) between fcc and bcc phases is usually within 1° of the Kurdjumov-Sachs (K-S) relationship [25]. The product phase tends to form a lath shape※ with the long axis along irrational directions near the conjugate direction of the K-S OR, i.e., <110> // <111> . Now it is clear that the long axis of f b a lath is usually parallel to the invariant line of transformation strain [1,2,6,13]. The cross-section shape of a lath is often characterized by several facets, usually in irrational orientations, including a major facet called the habit plane and several side facets. The interfacial structures are often found to consist of parallel dislocations along the long axis, and hence the invariant line [1]. The habit plane of Cr-rich
precipitate is near {211} [1] and f {533} [6] in Ni-Cr and Cu-Cr alloy, respectively. f
The habit planes were often experimentally observed to be free of dislocation arrays [1-7], but theoretical calculation showed that there should be a set of closely spaced dislocations in the habit plane of Cr-rich precipitates [22].
In contrast, the transformation in a DSS upon cooling is from ferrite (bcc) to austenite (fcc). Though the lattice parameter ratio of DSS is almost identical to that of Cu-Cr and Ni-Cr alloys, previous studies [12,13] showed that neither facets nor the long axis of rod-shaped austenite precipitate is similar to those in Ni-Cr and Cu-Cr alloys. Systematic crystallographic analysis of austenite precipitation have been carried out by Jiao et al. [12] and Qiu and Zhang [13]. They observed that rod-shaped austenite precipitates are characterized with faceted interfaces in the orientations of
f
(1.2 10 11) , (2 1 1.4) , and f (3 2 1.9) . A set of parallel dislocations were observed f in each facet by transmission electron microscopy (TEM). Ameyama et al. [11] have reported lath-shaped austenite precipitate in a DSS with interfacial features similar to
those in Ni-Cr system. The interface orientations were (1.7 1 1) for the habit plane f
※
The morphology of precipitates in fcc/bcc systems were mainly distinguished by the cross-sectional shape. The aspect ratio (width to thickness) of lath shape is around 2~4, while the aspect ratio for rod shape is around 1.
1 2 3 4 5 6 7 8 9 10 11 12 13 14 15 16 17 18 19 20 21 22 23 24 25 26 27 28 29 30 31 32 33 34 35 36 37 38 39 40 41 42 43 44 45 46 47 48 49 50 51 52 53 54 55 56 57 58 59 60 61
and (1 3.4 2.9) for the side facet. A remarkable difference in the morphology of the f rod-shaped austenite from those in Ni-Cr and Cu-Cr alloy is that the long axis,
f
[9 75 65] , deviates significantly from the conjugate plane of the K-S OR. However, their report is lack of detailed experimental characterizations and a proper interpretation.
In the present study of DSS, both types of previously reported crystallographic features of austenite precipitates were observed, while the rod-shaped austenite has been investigated in details [12,13], this study focused on austenite precipitates with a lath-shaped morphology. Quantitative TEM characterizations were conducted carefully on the OR, the long axis, the orientation of facets and the dislocations in the major side facet. The experimental results were explained by applying the O-line model and good matching site (GMS) model. A comparison was also briefly made between two types of precipitation crystallographic features.
2. Experiment
The alloy used in this work is a commercial DSS with the composition of Fe-24.9Cr-7.0Ni-3.1Mo (wt.%), which is used in a previous study [13]. The alloy blocks of 10mm×10mm×10mm were encapsulated in silica tubes and solution treated at 1300℃ for 30 min and then aged at 900℃ for 5 min, followed by water quenching. Slices with 0.5mm thickness were electric discharge machined from the heat treated blocks. TEM samples were ground and subsequently prepared by twin-jet polishing in a Struers Tenupol-3 using a solution of 8 vol.% perchloric acid in ethanol at 20V at -30℃. The TEM experiments were performed by Philips CM20FEG or a FEI Tecnai G20 electron microscope at 200kV.
3. Results
3.1 Precipitate morphology
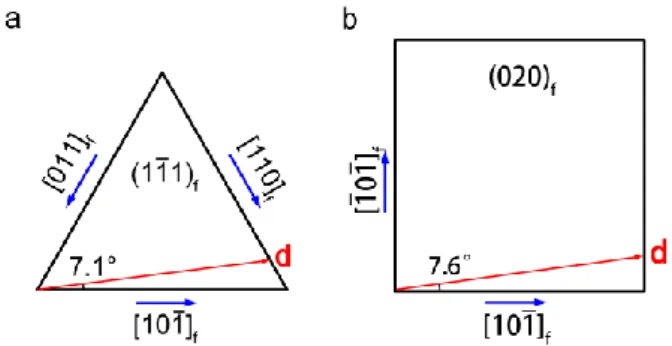
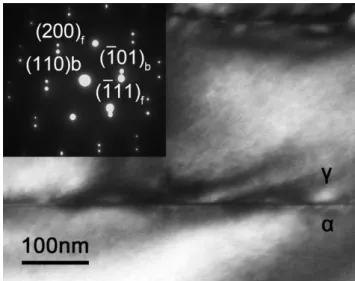
Austenite precipitates under the present investigation exhibit both rod-shaped and lath-shaped morphology, as shown in Fig. 1a and 1b. Rod-shaped austenite precipitates were frequently observed, with crystallographic features identical to the previous results [12,13]. The experimental results associated with lath-shaped austenite precipitates will be described in details below.
1 2 3 4 5 6 7 8 9 10 11 12 13 14 15 16 17 18 19 20 21 22 23 24 25 26 27 28 29 30 31 32 33 34 35 36 37 38 39 40 41 42 43 44 45 46 47 48 49 50 51 52 53 54 55 56 57 58 59 60 61
Fig. 1 Cross-sectional profiles of austenite precipitates (γ) in ferrite matrix (α): (a) rod-shaped austenite and (b) lath-shaped austenite.
3.2 Orientation relationship
Fig. 2a shows an overlapped selected area diffraction (SAD) pattern taken from an
interface region between austenite and ferrite along about [01 1] | [11 1] zone axis. f b
The incident beam is closely parallel to [01 1] , since the intensity of fcc spots f symmetrically distributes in Fig. 2a. However, the intensity distribution of the spots from bcc lattice indicates an obvious deviation from the exact [11 1] zone axis. b This misalignment is reproducible, not caused by a local bending, by checking over ten individual precipitates. It confirms a near K-S OR between precipitates and their matrix. Since SAD carries relatively large uncertainty in the OR measurement, in order to obtain a more precise measurement we have determined the OR between austenite precipitate and ferrite matrix using a Kikuchi line analysis as suggested in [26]. This gives an average error of ±0.2°. The measured result can be expressed by
an orientation matrix bM . In general, two pairs of parallel directions are sufficient f
to construct orientation matrix for fcc/bcc systems. Fig. 2b and 2c show a pair of Kikuchi patterns from austenite and ferrite regions contacted in an interface. The
pattern in Fig. 2b was taken along 112f axis in austenite, and the Kikuchi pattern
from the ferrite matrix in Fig. 2c was recorded at the same foil tilt condition. The patterns in Fig. 2b and 2c allowed the determination of two pairs of parallel directions. One is the beam direction, with the inverse direction of incident beam being defined as the positive direction. This direction pair was determined as
f b [112] || [6.1 1 7.37] . (1a) 1 2 3 4 5 6 7 8 9 10 11 12 13 14 15 16 17 18 19 20 21 22 23 24 25 26 27 28 29 30 31 32 33 34 35 36 37 38 39 40 41 42 43 44 45 46 47 48 49 50 51 52 53 54 55 56 57 58 59 60 61
The other pair of parallel directions was chosen as a pair of diffraction directions in Fig. 2b and 2c, namely,
f b
[110] || [0.3 5.55 1] . (1b)
Based on the above parallel directions, the orientation matrix bM was determined. f
(see Appendix for the value of bM ).f A pair of parallel directions (v and f v ) or b parallel planes (g and f g ) in fcc and bcc lattice are related respectively by the b following formulas, b b f f v M v , (2a) 1 b (b f ') f g M g . (2b)
Accordingly, by replacing the orientation matrix bM in above Eq. 2 with the value f
of bM , the measured OR can be specified as f
f b
(111) || (0 1.22 1.23) with 0.4° away from (011) , (3a) b
f b
[01 1] || [1 1.01 1] with 0.3° away from [11 1] , (3b) b where the angles give the deviations from the K-S OR.
Fig. 2 (a) SAD patterns showing the near K-S OR for lath-shaped austenite, diffraction patterns for constructing the orientation matrix: (b) diffraction pattern of austenite; (c) diffraction pattern of the ferrite along the same direction as in (b).
3.3 Long axis and facet orientation
According to the TEM observation, the lath-shaped austenite precipitates always exhibit a major facet, which is denoted as the habit plane. Though individual precipitate in Fig. 1b appears to show several side facets with different sizes, only one
1 2 3 4 5 6 7 8 9 10 11 12 13 14 15 16 17 18 19 20 21 22 23 24 25 26 27 28 29 30 31 32 33 34 35 36 37 38 39 40 41 42 43 44 45 46 47 48 49 50 51 52 53 54 55 56 57 58 59 60 61
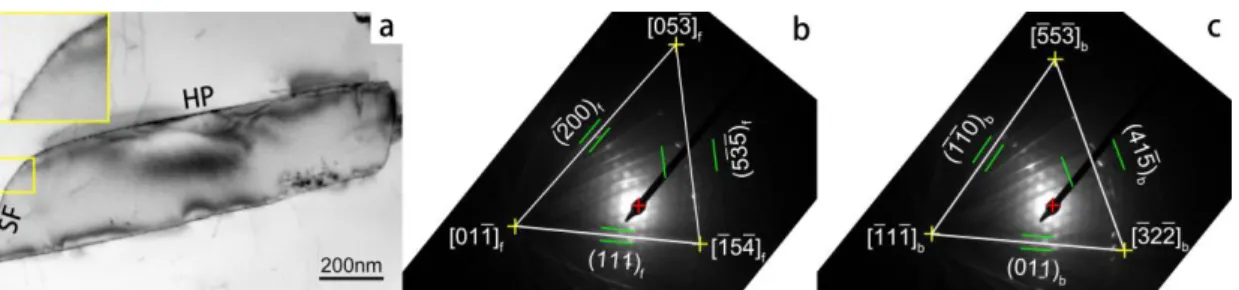
well-defined side facet (major side facet) is shared by all lath-shaped precipitate. In addition, there is always a curved interface between the habit plane and the major side facet. Fig. 3a shows the cross-sectional shape of austenite precipitate, viewed along the long axis. The facets in Fig. 3a are all in an edge-on view, which confirms that the long axis lies in all faceted interfaces. At the same edge-on condition, Kikuchi patterns from fcc and bcc lattice were obtained, as shown in Fig. 3b and 3c, respectively. According to Kikuchi patterns, the long axis of austenite precipitate, parallel to the beam direction, is [0.08 0.77 0.64] || [0.67 0.55 0.5]f b. Due to the slight bending of the foil and the small ambiguity in setting the edge-on orientation, the error is around ±2° in the determination of long axis.
Fig. 3 A lath-shaped austenite precipitate viewed along its long axis: (a) cross-section profile, including habit plane (HP) and major side facet (SF); (b) Kikuchi patterns in the precipitate and (c) Kikuchi patterns in the matrix along the same beam direction as in (b).
For the same reason, the uncertainty of measured orientation of facets is relatively large, when the facet is in the edge-on orientation. Therefore, in addition to the results based on measurements at the edge-on orientation, the interface trace was measured carefully to determine the facet orientation to minimize systematic error of the results suggested by Meng and Zhang [27]. The intersections between the TEM foil surfaces and facets were analyzed by trace analysis. Then, the cross product of a trace and the long axis gives the orientation of a facet. According to the measurements from several precipitates, both habit plane and major side facet are found in irrational orientations, which can be expressed as (2 1.1 1) || (1 3.2 2.2)f b and (1.1 4 5) || (3.1 1 5.7) f b , respectively. 1 2 3 4 5 6 7 8 9 10 11 12 13 14 15 16 17 18 19 20 21 22 23 24 25 26 27 28 29 30 31 32 33 34 35 36 37 38 39 40 41 42 43 44 45 46 47 48 49 50 51 52 53 54 55 56 57 58 59 60 61
The orientation of habit plane can also be identified with the △g method [28]. A △g vector is associated with a pair of lattice planes gf and gb, which are related by the
transformation lattice correspondence. It is shown in Fig. 4 that the habit plane in an
edge-on view is approximately normal to two principal g vectors, i.e.,
(200)f (200)f (110) b
g g g and g(111)f g(111)f g(101)b. This implies that habit plane is
possibly parallel to two sets of Moiré planes, since a g vector is the reciprocal vector representing a set of Moiré planes. However, the zone axes in Fig. 4 are not
exactly parallel to each other, so the parallelism of g requires further confirmation
with a calculation using the true OR.
Fig. 4 The geometry between the edge-on habit plane and g(200)f g(200)f g(110) b&
(111)f (111)f (101)b
g g g .
3.4 Interfacial structure
Various diffraction conditions were employed to investigate possible dislocations in the habit plane. As shown in Fig. 5a, no dislocation was observed in habit plane by tilting the sample in a large angular range. However, there is a set of periodic dislocations in the major side facet. In Fig. 5b, a major side facet was tilted to be inclined to the long axis while the habit plane was kept in the edge-on position. The spacing of the dislocations in the major side facet was measured with a value of 9.6 nm, taking the inclination angle between the habit plane and the side facet into
1 2 3 4 5 6 7 8 9 10 11 12 13 14 15 16 17 18 19 20 21 22 23 24 25 26 27 28 29 30 31 32 33 34 35 36 37 38 39 40 41 42 43 44 45 46 47 48 49 50 51 52 53 54 55 56 57 58 59 60 61
consideration. Since the dislocation projections are parallel to the trace of habit plane, the direction of dislocation line must lie in both the habit plane and major side facet. Consequently, the dislocation line must be parallel to the long axis of austenite lath, which is also the intersection line of these two facets. A Burgers vector analysis of the
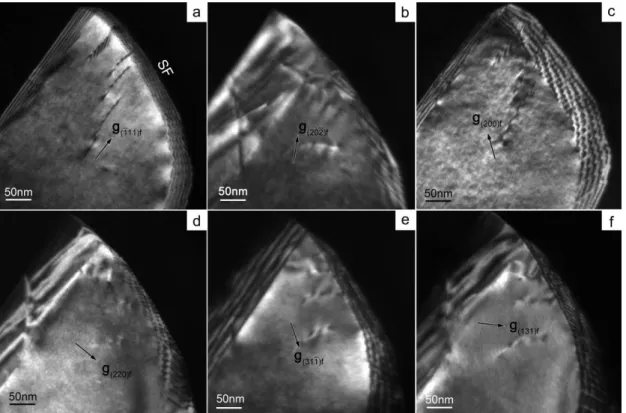
dislocation array in the major side facet has been carried out by a conventional g b
dislocation contrast extinction method. A series of center dark field micrographs of the major side facet were recorded by applying different two-beam conditions, which are shown in Fig. 6a-f. The contrast of these dislocations in the major side facet is strong when g(200) f, g(220) f, g(31 1)f and g(131) f were applied, but it is weak when
(202)f
g was applied. The dislocations are out of contrast when g(111)fwas applied. The
contrast in Fig. 6a-f was listed in Table 1 together with the g b values for all possible lattice Burgers vectors. By comparing the consistency between the diffraction contrast of dislocations with the g b values, the Burgers vector, bf, of dislocations
in the major side facet was characterized as [110] /2 . It corresponds to f [010] /2 in b
bcc lattice according to the specific Bain correspondence in accord with the measured near K-S OR (Eq. 3).
Fig.5 (a) The habit plane (HP) free of dislocations and parallel dislocations in the major side facet (SF); (b) dislocations in SF when HP is edge-on.
1 2 3 4 5 6 7 8 9 10 11 12 13 14 15 16 17 18 19 20 21 22 23 24 25 26 27 28 29 30 31 32 33 34 35 36 37 38 39 40 41 42 43 44 45 46 47 48 49 50 51 52 53 54 55 56 57 58 59 60 61
Fig. 6 Dark-field micrographs of the major side facet (SF) using (a)g(111)f, (b)
(202)f
g
, (c)g( 200) f , (d)g( 220) f , (e)g(31 1)f , (f)g(131) f diffractions from the precipitate.
Table 1 A comparison between observed contrast of the dislocations in the major side facet and the g·b results for different possible Burgers vectors
Fig No. Diffraction spot Diffraction contrast g·b for gf [110] /2 f [110] /2 f [101] /2 f [101] /2 f [011] /2 f [011] /2 f 6a (111)f None 0 1 0 1 1 0 6b (202)f weak 1 1 0 2 1 1 6c (200) f Strong 1 1 1 1 0 0 6d (220) f Strong 2 0 1 1 1 1 6e (31 1)f Strong 2 1 1 2 0 1 6f (131) f Strong 2 1 1 0 2 1
In addition to the dislocations in the major side facet, linear defects were observed in the curved portion of interfaces. By a careful examination, these linear defects are associated steps, as seen in the insert of Fig. 3a. The terrace and riser of steps are
1 2 3 4 5 6 7 8 9 10 11 12 13 14 15 16 17 18 19 20 21 22 23 24 25 26 27 28 29 30 31 32 33 34 35 36 37 38 39 40 41 42 43 44 45 46 47 48 49 50 51 52 53 54 55 56 57 58 59 60 61
observed to be parallel to the habit plane and major side facet, respectively. 4. Calculation with O-line model and GMS model
4.1 OR and habit plane
Precipitations with irrational habit plane can often be explained in terms of the O-line criterion [23], implying that the misfit in the habit plane should be completely compensated by a single set of dislocations. In present work, since the measured habit plane and the OR of lath-shaped austenite both exhibit irrational crystallographic characteristics, we will adopt the O-line model below to interpret the observations.
The lattice parameters of the ferrite and austenite are ab = 0.2881 nm and af = 0.3616
nm, which were determined by the X-ray diffractions of the same sample for TEM observation. The lattice parameter ratio of af/ab is 1.255. Construction of the
transformation matrix A meeting the O-line condition follows the same principle as reported previously [22]. The fcc lattice was chosen as the reference lattice in this work. A key input for the O-line calculation different from the previous one [22] is the Burgers vector. While the previous one is [10 1] /2 | [11 1] /2 , the present Burgers f b vector is [01 1] /2 | [11 1] /2 for the same variant of the K-S OR. The selection of f b the Burgers vector is guided by TEM observation, which shows that the habit plane is
approximately perpendicular to g(200) f ( g(200) f g(110) b ) and g(111)f
( g(111)f g(101) b). According to the property of Moiré planes [23], the misfit
displacement in habit plane should lie in both planes g(200) f and g(111)f or g(110) b
and g(101) b. Therefore, the misfit displacement related to any vectors in the habit
plane must be parallel to the zone axis of these planes, which is [01 1] /2 or f
b
[11 1] /2 . The reciprocal invariant line is required to be normal to the Burgers vector based on the properties of the O-line. Corresponding to this input Burgers vector pair, the direction of reciprocal invariant line can be solved by an analytic method. However, this reciprocal invariant line does not fully fix the transformation matrix A; it leaves one degree of freedom to vary. Numerous possible O-line solutions can be generated by adding small rotations around the determined reciprocal invariant line. The rotation angle is constrained to be less than 15° to ensure the validity of the Bain correspondence [22]. Dai and Zhang [29] have reported the interfacial energies of
1 2 3 4 5 6 7 8 9 10 11 12 13 14 15 16 17 18 19 20 21 22 23 24 25 26 27 28 29 30 31 32 33 34 35 36 37 38 39 40 41 42 43 44 45 46 47 48 49 50 51 52 53 54 55 56 57 58 59 60 61
O-line interfaces that vary with respect to the rotation angle around the reciprocal invariant line. Among all the interfaces calculated, the O-line interface of the
f b
[01 1] /2 | [11 1] /2 type with rotation angle being about 0.45° is associated with the
minimum interfacial energy. The present work has a same lattice parameter ratio af/ab
as that in the work of Dai and Zhang [29]. Therefore, we selected the O-line solution associated with the minimum interfacial energy of O-line interfaces. Accordingly, the transformation matrix A and displacement matrix T can be determined conveniently. (see Appendix for the values of A, T and calculated orientation matrix M).
Based on the determined A, the direction of real invariant line, xin, can be determined
by solving eigen problem [20]. The normal of principal Moiré planes can be
determined by a reciprocal vector g [23]:
f b ' f
g g g T g . (4) To calculate the normal of O-line interface, gf in Eq. 4 should be any reciprocal
vectors that meet the g bf f 0 condition, with bf being the Burgers vector
f
[01 1] /2 of the dislocations between the O-lines. This result also verifies parallelism
of principal g vectors defined by g(200)f g(200)f g(110) b and
(111)f (111)f (101)b
g g g . In Fig. 4, these g vectors are approximately parallel to
each other, since the zone axes containing the corresponding g vectors in different phases are not parallel exactly to each other. The spacing of presumed dislocations in the O-line interface, D, which is same as the spacing of O-lines, should meet the following equation, o n f (D ) T x b , (5) where o n
x is a unit vector normal to real invariant line in O-line interface. From Eq. 5,
the spacing of dislocations in the O-line interface can be calculated as 0.9nm.
The relevant O-line results and experimental measurements were compared in Table 2, where nHP, bHP and DHP represent the orientation of the habit plane, Burgers vector
and the spacing of dislocations in the habit plane, respectively. The angles between
f b
(111) | (011) and [01 1] | [ 11 1] were denoted as θf b p-p and θd-d respectively to
specify the OR. It can be seen from Table 2 that the calculated results are in a good agreement with the observed OR and the long axis, as well as habit plane orientation.
1 2 3 4 5 6 7 8 9 10 11 12 13 14 15 16 17 18 19 20 21 22 23 24 25 26 27 28 29 30 31 32 33 34 35 36 37 38 39 40 41 42 43 44 45 46 47 48 49 50 51 52 53 54 55 56 57 58 59 60 61
One can also see the agreement between the calculated and measured ORs from the similarity in the M matrixes in Appendix. The good agreement between the O-line results and experimental results of lath-shaped austenite indicates that the development of the habit plane and the corresponding OR in this case is very likely governed by minimization of the interfacial energy.
Table 2 A comparison of the results for lath-shaped austenite in the present work with results for rod-shaped austenite from a previous work [13], and with results in Cu-Cr [5-7] and Ni-Cr alloys [1-4]
OR Long axis Habit plane (O-line interface)
θp-p θd-d (invariant line) nHP bHP DHP(nm)
Lath shape, measured 0.4° 0.3° [0.08 0.77 0.64]f (2 1.1 1) f — — Lath shape, calculated 0.45° 0.45° [0.10 0.75 0.65]f (2 1.13 1) f
f b [01 1] /2 [ 11 1] /2 0.9 Discrepancy 0.1° 0.2° 1.8° 1.7° — — Rod shape [13] 1.1° 1.2° [0.09 0.75 0.65]f (1 10 11.4)f f b [10 1] /2 [11 1] /2 1.6 Cu-Cr [5-7] 0.5° 0° [0.13 0.76 0.64]f (2 1.3 1.1) f — — Ni-Cr [1-4] 0° ≤ 0.9° [0.06 0.76 0.65]f (211) f — —
The OR is characterized by the angles between (111) | (011) (θf b p-p) and between [01 1] | [11 1]f b(θd-d), and nHP,
bHP, and DHP represent the normal vector of habit plane, the Burgers vector and the spacing of the misfit
dislocations in habit plane.
According to the O-line analysis, there should be a single set of fine dislocation array in habit plane to compensate the interfacial misfit. However, these calculated dislocations were not observed. The result of missing dislocation agrees with the observations of dislocation free habit planes in Cu-Cr [5-7] and Ni-Cr alloys [1-4]. In Table 2, the measured habit plane orientation and the direction of the long axes of bcc precipitates in Cu-Cr [5-7] and Ni-Cr alloys [1-4] are also listed. One can see from Table 2 that the corresponding results from the current study are close to those results from Cu-Cr and Ni-Cr alloys. The similarity in these crystallographic features suggests similarity in the dislocation structures in the habit plane, since the lattice
1 2 3 4 5 6 7 8 9 10 11 12 13 14 15 16 17 18 19 20 21 22 23 24 25 26 27 28 29 30 31 32 33 34 35 36 37 38 39 40 41 42 43 44 45 46 47 48 49 50 51 52 53 54 55 56 57 58 59 60 61
parameter ratios in these alloys are all around 1.25. The reason for invisibility of the dislocations is probably because the spacing of dislocations is too small for them to be observed with diffraction contrast. In addition, the calculated dislocations in habit plane are nearly screw dislocations, which means it is impossible to identify the dislocations by examining missing planes in a high resolution TEM image at the edge-on orientation, as demonstrated by Furuhara et al. [4] for the habit plane between Cr-rich precipitate and matrix in a Ni-Cr alloy. The agreement between the results of the lath-shaped fcc precipitate in DSS and the bcc precipitates in Cu-Cr and Ni-Cr alloys indicates that the precipitation crystallography associated with the minimum interfacial energy can be realized in an fcc/bcc system, even if the structures of parent and product phases switch with each other.
4.2 Side facet
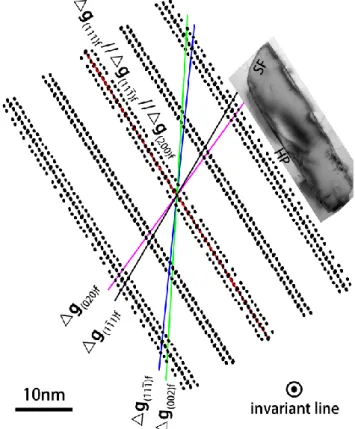
Although no periodic dislocations were observed in the habit plane, a set of dislocations can be identified in the major side facet. As limited by the lattice parameters, only one interface, the habit plane, can contain an O-line structure. While the major side facet is also parallel to the long axis along the invariant line, the misfit in this facet cannot be fully accommodated by a single set of dislocations. The orientation and dislocation structure of the side facet can be rationalized according to the distribution of the good matching site (GMS) clusters [30], or in terms of near coincidence sites [24]. In the O-line condition, any GMS clusters must align endlessly along the invariant line. Thus, the distribution of GMS clusters can be examined with their projections in a plane normal to the invariant line, when the OR corresponding to the ideal O-line condition was taken as the input for the GMS calculation. By following 15% good matching criterion suggested in structural ledge model [5], the GMSs at a selected region were calculated. A two dimensional (2D) distribution of the projected GMS clusters is shown in Fig. 7. Each GMS position is represented by a black solid point (only an fcc lattice point is shown for clarity). Under the O-line condition, all principal Moiré planes must contain the invariant line according to the property of invariant line [23]. The orientations of all principal Moiré planes have been calculated by Eq. 4, and were listed in Table 3 together with the related lattice
1 2 3 4 5 6 7 8 9 10 11 12 13 14 15 16 17 18 19 20 21 22 23 24 25 26 27 28 29 30 31 32 33 34 35 36 37 38 39 40 41 42 43 44 45 46 47 48 49 50 51 52 53 54 55 56 57 58 59 60 61
planes. For the sake of clarity, only one plane passing through the origin from each set of the principal Moiré planes was plotted in Fig. 7. The observed cross-sectional shape of austenite lath was inserted in Fig. 7 for a comparison. It can be seen that all Moiré planes contain periodically spaced GMS clusters in local regions. Three principal Moiré planes, g(111)f , g(111)f and g(200) f in Fig. 7, are parallel to each other and they define the habit plane orientation. The position of overlapped Moiré planes passes a set of periodic GMS clusters, with each cluster centered at an O-line. Though other principal Moiré planes also contain dense GMS clusters, the GMS clusters in these planes distribute with two-order periodicity, including primary (small spacing) and secondary periodicity (large spacing).
Fig. 7 A 2D GMS distribution normal to the invariant line is overlapped by the traces of all principal Moiré planes passing through the origin, and the cross-sectional shape of lath-shaped austenite is inserted in the top-right corner.
1 2 3 4 5 6 7 8 9 10 11 12 13 14 15 16 17 18 19 20 21 22 23 24 25 26 27 28 29 30 31 32 33 34 35 36 37 38 39 40 41 42 43 44 45 46 47 48 49 50 51 52 53 54 55 56 57 58 59 60 61
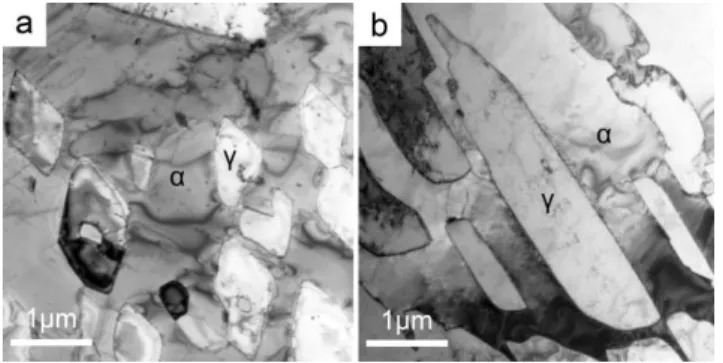
Table 3 The orientations of principal Moiré planes and a comparison with the observed facets
gp-f gp-b Orientation Observed facets Discrepancy
(111) f g (111) f (011) b ( 111) f g (111)f (101)b (2 1.13 1) f habit plane (2 1.1 1) f 1.7° (200) f g (200) f (110) b (1 11) f g (1 11)f (101) b (1.1 4 4.8)f side facet (1.1 4 5)f 1.2° (020) f g (020) f (110)b (1 2.3 2.8)f (11 1 ) f g (11 1)f (01 1)b (1 2.6 2.8) f (002) f g (002) f (002) b (1 2.2 2.4) f
Based on Fig. 7 and Table 3, it can be seen that the Moiré plane defined by g(1 11)f
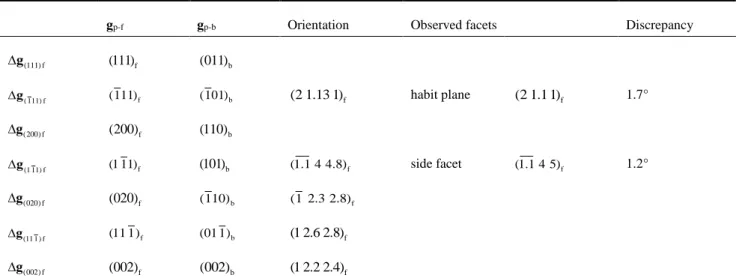
is most close to the observed major side facet. In principle, other principal Moiré planes can also serve as candidates for a side facet. Presumably, these interfaces have similar values of interfacial energy. The habit plane with low energy will have a relatively large area so that the precipitate will have a low overall interfacial energy, if the side facet is inclined to the habit plane with a large angle and hence has a relatively small area. For the above reason, g(1 11)f and g(020) f are favorable candidates, as they incline to the habit plane with relatively large angles. Nature
seems in favor of g(1 11)f. This is probably because of the difference in the available
Burgers vectors for the dislocation structures to accommodate the misfit in the interfaces defined by these Moiré planes, as explained below. As mentioned above, the directions of relative displacements d of any vector in planes normal to g(1 11)f and g(020) f must lie in the planes (1 11)f and (020) respectively, as shown in f
Fig. 8a and 8b. From the figures, one can see that d is close to [10 1]f on both
f
(1 11) or (020) . This suggests that f [10 1] / 2f is possibly the Burgers vector of the
fine dislocations to accommodate the misfit between the primary GMS clusters in a principal Moiré plane normal to either g(1 11)f or g(020) f. The Burgers vector for the coarse dislocations to accommodate the remaining misfit between the secondary
GMS clusters in a selected principal Moiré planes must also lie in the planes (1 11)f
1 2 3 4 5 6 7 8 9 10 11 12 13 14 15 16 17 18 19 20 21 22 23 24 25 26 27 28 29 30 31 32 33 34 35 36 37 38 39 40 41 42 43 44 45 46 47 48 49 50 51 52 53 54 55 56 57 58 59 60 61
or (020) . It can be seen from Fig. 8 that the angle between d and f [110] is much f
smaller than that between d and [10 1]f. Therefore, the Burgers vector of [110] / 2 f
is more efficiently than [10 1] / 2f to accommodate the remaining misfit by the
coarse dislocations in the corresponding Moiré planes. The selection of [110] / 2 as f
the Burgers vector of coarse dislocations will be further elucidated below.
Fig. 8 The schematic diagram showing the displacements (d) related to vectors in Moiré planes normal to (a) g(1 11)f; (b) g(020) f.
Having selected the Moiré plane g(1 11)f for the major side facet, the possible Burgers vectors and the spacing of the two sets of dislocations can be derived in a more rigorous manner according to the association of dislocation structure with the distribution of the GMS clusters in a Moiré plane. The center of each GMS cluster can be approximately treated by an intersection of three sets of linearly independent principal Moiré planes. The intersections of three sets of periodic Moiré planes
(111)f
g
, g(11 1 )f and g(111)f with the selected side facet normal g(1 11)f are
shown in Fig. 9. If a vector x passes n layers of a principal Moiré plane g, the relative displacement d associated with
x
must cross n layers of the related lattice plane g that is related to this selected f g [31]. In Fig. 9, x1 and x2 are two vectorslying in the side facet, with x1 and x2 (in opposite directions for clarity) ending at the
center of a primary and secondary GMS cluster, respectively. The primary GMS cluster at the end of x1 can be defined by the approximate intersections of linearly
independent principal Moiré plane g(1 11)f, g(111)f and g(1 11)f. Namely,
' 1 (1 11)f 0 g x , (6a) 1 2 3 4 5 6 7 8 9 10 11 12 13 14 15 16 17 18 19 20 21 22 23 24 25 26 27 28 29 30 31 32 33 34 35 36 37 38 39 40 41 42 43 44 45 46 47 48 49 50 51 52 53 54 55 56 57 58 59 60 61
' 1 (111)f 1 g x , (6b) ' 1 (1 11)f 1 g x . (6c)
Thus, b1 of the fine dislocations between the primary GMS clusters should satisfy the
following relationship [31]: ' 1 (1 11)f 0 g b , (7a) ' 1 (111)f 1 g b , (7b) ' 1 (1 11)f 1 g b . (7c)
The solution of b1 is [10 1] /2f , consistent with the suggestion based on Fig. 8. It can
be seen from Fig. 9 that there are approximate seven layers of g(111)f between the
secondary GMS clusters. Hence, seven fine dislocations and one coarse dislocation
can compensate the misfit of x2. According to the relationship between the GMS
cluster defined by x2, one obtains
' 2 (1 11)f 0 g x , (8a) ' (111)f 2 1 g x , (8b) ' 2 (111)f 7 g x , (8c) ' 2 (1 11)f 6 g x . (8d)
The Burgers vector b2 of the coarse dislocations is solved as [110]f/2 from any three
equations below: ' 2 (1 11)f 0 g b , (9a) ' (111)f( 2 7 ) 11 g b b , (9b) ' 2 1 (111)f( 7 ) 7 g b b , (9c) ' 2 1 (1 11)f( 7 ) 6 g b b . (9d) 1 2 3 4 5 6 7 8 9 10 11 12 13 14 15 16 17 18 19 20 21 22 23 24 25 26 27 28 29 30 31 32 33 34 35 36 37 38 39 40 41 42 43 44 45 46 47 48 49 50 51 52 53 54 55 56 57 58 59 60 61
Fig. 9 Intersections of traces of principal Moiré plane with the trace of the side facet normal tog(1 11)f (bold black solid line).
According to the lengths of vectors x1 and x2, the dislocation spacing D1 and D2 of
fine and coarse dislocations are determined to be 1.2 nm and 9.0 nm, respectively. The calculated direction, spacing and Burgers vector of coarse dislocations in principal Moiré plane g(1 11)f are all consistent with those of the observed dislocations in major side facet within the experimental uncertainty. However, the calculated fine dislocations were not observed. This is again probably because their spacing is too small for the dislocations to have sufficient diffraction contrast.
5. Discussion
In the present work, both rod-shaped and lath-shaped austenite precipitates were observed with reproducible morphologies, but with different cross-sectional shape and crystallographic features. A comparison between crystallographic features for lath-shaped austenite and those for rod-shaped austenite reported by Qiu and Zhang [13] is given in Table 2. Although both types austenite precipitates hold a near K-S OR with ferrite matrix, deviation angles between the approximately parallel close-packed planes and close-packed directions are larger for rod-shaped austenite than those for lath-shaped austenite. The orientation of the interface is sensitive to the OR, since a slight change in the OR may lead to a significant variation in the
orientation of the g associated with (111) | (011) and hence the normal of habit f b
plane. The major difference lie in the habit plane structures of these two types
1 2 3 4 5 6 7 8 9 10 11 12 13 14 15 16 17 18 19 20 21 22 23 24 25 26 27 28 29 30 31 32 33 34 35 36 37 38 39 40 41 42 43 44 45 46 47 48 49 50 51 52 53 54 55 56 57 58 59 60 61
austenite. As can be seen from Table 2, the Burgers vector of the dislocations in the
habit plane of the lath-shaped austenite is [01 1] | [11 1] , which is the near parallel f b
conjugate directions to denote the K-S OR, whiles the Burgers vector of the dislocations in the habit plane of the rod-shaped austenite is [10 1] | [11 1] , which is f b the other pair of corresponding Burgers vectors also lying in the near parallel planes
f b
(111) | (011) . In addition, the dislocation direction or the long axes are also different for the two types of morphologies. The one for the lath-shaped austenite is almost parallel to the conjugate planes (111) | (011) of the K-S OR, while that for the f b
rod-shaped austenite is closer to another pair of low index planes (111) | (101) . One f b
expects that the different dislocation structures will affect the mobility of the corresponding habit planes during the growth stage of the precipitate, but how the development of the morphology is affected by the mobility of the habit plane needs further investigation.
The following interpretation of the two morphologies is mainly based on the relative interfacial energy of the habit plane compared with that of the side facets. As stated in the calculation section, the habit plane of lath-shaped austenite is associated with minimum interfacial energy among all O-line interfaces. This gives a qualitative account for the relatively large area of the habit plane of the lath-shaped austenite, and comparable sizes of faceted interfaces associated with the rod-shaped austenite. However, it does not explain relative large population of the rod-shaped precipitates. The preference of rod-shaped austenite is rationalized below mainly from the difference in misfit strain in coherent stage. While the semicoherent habit planes are developed from the growing stage of the precipitates, the invariant line and the associated OR are evolved from the nucleation process. It is reasonable to assume that a precipitate at the early stage of precipitation is coherent. As suggested by Dahmen et al. [8], the precipitates tend to have a needle shape with a long axis along an invariant line, which can have various directions. While the direction along an invariant line is free of misfit strain, the misfit distribution in the cross section normal to the invariant line changes with individual ORs. The misfit can be evaluated in terms of Burgers vector content associated with a unit vector normal to the invariant line, as suggested
1 2 3 4 5 6 7 8 9 10 11 12 13 14 15 16 17 18 19 20 21 22 23 24 25 26 27 28 29 30 31 32 33 34 35 36 37 38 39 40 41 42 43 44 45 46 47 48 49 50 51 52 53 54 55 56 57 58 59 60 61
by Knowles and Smith [32]. It is convenient to examine the distribution of Burgers vector content in the invariant line strain condition by employing the singular value decomposition method [33] to the displacement matrix T, proposed by Gu et al. [34]. Namely, the maximum and minimum Burgers vector contents are given by non-zero singular values of T, σ (i=1,2,3, i σ > σ > σ1 2 3 0 ). A small value of σ σ 1 2 indicates that the overall misfit is low. In addition, a small value of σ indicates 2 small misfit in a particular interface. The singular values of T determined
corresponding to the ORs for lath-shaped and rod-shapes austenite are σ = 1 0.3947,
2 0.1394
σ = , σ3 0 and σ = 1 0.3736, σ = 2 0.1183, σ3 0, respectively. It can be seen that the values of both σ and 2 σ σ for the rod-shaped austenite are smaller 1 2 than those for lath-shaped austenite. According to their smaller misfit stain, one will expect that nucleation of precipitates with the OR for rod-shaped austenite is energetically favorable. This reason interprets why the rod-shaped austenite precipitates are more often observed compared to the lath-shaped ones. The interpretation implies an assumption that the invariant line direction that defines the long axis of the rod is mainly fixed at the nucleation stage.
6. Summary
Coexistence of two types of precipitate morphologies (rod-shape and lath-shape) and the associated OR of austenite precipitates were observed in a DSS by using TEM. This study provides precise measured data of crystallographic features and interpretation for lath-shaped austenite. The lath-shaped austenite precipitate holds a near K-S OR with ferrite matrix, which can be described as
f b
(111) || (0 1.22 1.23) with ~ 0.4° away from (011) b
f b
[01 1] || [1 1.01 1] with ~ 0.3° away from [1 11] b
These precipitates are always bounded by two well-defined facets, with the orientation of habit plane being (2 1.1 1.1) || (1 3.2 2.2)f b and that of major side facet being (1.1 4 5) || (3.1 1 5.7) f b. The habit plane is perpendicular to at least two of principal △g vectors (g(200) f and g(111)f). No dislocation was observed in the habit plane, but an array of dislocations was observed in the side facet. The direction of dislocation lines is parallel to the long axis of austenite lath, in the direction of
1 2 3 4 5 6 7 8 9 10 11 12 13 14 15 16 17 18 19 20 21 22 23 24 25 26 27 28 29 30 31 32 33 34 35 36 37 38 39 40 41 42 43 44 45 46 47 48 49 50 51 52 53 54 55 56 57 58 59 60 61
f b
[0.08 0.77 0.64] || [0.67 0.55 0.5] . The Burgers vector of the dislocations is
b f
[010] | [110] /2 and the spacing of the dislocations is around 9.6nm. The crystallographic features of lath-shaped austenite in DSS (bcc → fcc) is similar to those in Cu-Cr and Ni-Cr alloys (fcc → bcc), indicating this type of precipitation crystallography is favored by in an fcc/bcc system, regardless which structure is the matrix phase.
The O-line condition with a geometry constrained by the minimum interfacial energy determined in a previous study has been applied to explain observations, showing excellent agreement in the OR, long axis and the orientation of habit plane. The orientation of major side facet is consistent with a principal Moiré plane normal to
(1 11)f
g
. According to the calculation, the habit plane should contain a set of near
screw dislocations with spacing of 0.9nm, and the major side facet should contain two sets of dislocations. While the fine dislocations in both interfaces were not observed probably due to the small spacing, the coarse dislocations are consistent with the observations in the Burgers vector, direction and the spacing of the dislocations in the major side facet.
Acknowledgements
Supports from National Natural Science Foundation of China (No.51471097 and No.51671111), and helpful discussions from Dr. Dong Qiu are gratefully acknowledged.
Appendix
The experimentally measured orientation matrix bM was determined by the two f
pairs of parallel direction in Eq. 1 as
b f 0.67 0.74 0.07 0.74 0.65 0.17 0.08 0.17 0.98 M (A1)
In the O-line condition with the minimum interfacial energy of O-line interfaces, the transformation matrix A and displacement matrix T were determined as
1 2 3 4 5 6 7 8 9 10 11 12 13 14 15 16 17 18 19 20 21 22 23 24 25 26 27 28 29 30 31 32 33 34 35 36 37 38 39 40 41 42 43 44 45 46 47 48 49 50 51 52 53 54 55 56 57 58 59 60 61
1.12 0.07 0.06 0.08 1.11 0.14 0.07 0.20 0.78 A (A2a) and 1 0.12 0.07 0.06 0.05 0.13 0.16 0.10 0.21 0.23 T I A , (A2b)
where I is a unit matrix. The orientation matrix M is related to A by
1 f b 0.66 0.75 0.08 / (a / a ) 0.75 0.64 0.17 0.08 0.17 0.98 M CA , (A3)
where C is the Bain correspondence matrix. The column vectors of C are given by [110], [110] , and [001]corresponding to the OR in Eq. 3.
References
1. Luo CP, Weatherly GC (1987) The invariant line and precipitation in a Ni-45 wt% Cr alloy. Acta Metallurgica 35 (8):1963-1972
2. Luo CP, Weatherly GC (1988) The interphase boundary structure of precipitates in a Ni-Cr alloy. Philosophical Magazine A 58 (3):445-462
3. Chen JK, Chen G, Reynolds Jr WT (1998) Interfacial structure and growth mechanisms of lath-shaped precipitates in Ni-45 wt% Cr. Philosophical Magazine A 78 (2):405-422
4. Furuhara T, Wada K, Maki T (1995) Atomic structure of interphase boundary enclosing bcc precipitate formed in fcc matrix in a Ni-Cr alloy. Metallurgical and Materials Transactions A 26 (8):1971-1978
5. Hall MG, Aaronson HI, Kinsma KR (1972) The structure of nearly coherent fcc: bcc boundaries in a Cu-Cr alloy. Surface Science 31:257-274
6. Luo CP, Dahmen U, Westmacott KH (1994) Morphology and crystallography of Cr precipitates in a Cu-0.33 wt% Cr alloy. Acta Metallurgica et Materialia 42 (6):1923-1932
7. Luo CP, Dahmen U (1998) Interface structure of faceted lath-shaped Cr precipitates in a Cu–0.33 wt% Cr alloy. Acta Materialia 46 (6):2063-2081
8. Dahmen U, Ferguson P, Westmacott K (1984) Invariant line strain and needle-precipitate growth directions in Fe-Cu. Acta Metallurgica 32 (5):803-810
9. Fujii T, Mori T, Kato M (1992) Crystallography and morphology of needle-like α-Fe precipitate particles in a Cu matrix. Acta Metallurgica et Materialia 40 (12):3413-3420
10. Forwood CT, Clarebrough LM (1989) The dislocation structure of f.c.c-b.c.c. interfaces in a Cu-Fe alloy. Philosophical Magazine B 59 (6):637-665
11. Ameyama K, Weatherly GC, Aust KT (1992) A study of grain boundary nucleated widmanstätten precipitates in a two-phase stainless steel. Acta metallurgica et materialia 40 (8):1835-1846
12. Jiao H, Aindow M, Pond RC (2003) Precipitate orientation relationships and interfacial structures
1 2 3 4 5 6 7 8 9 10 11 12 13 14 15 16 17 18 19 20 21 22 23 24 25 26 27 28 29 30 31 32 33 34 35 36 37 38 39 40 41 42 43 44 45 46 47 48 49 50 51 52 53 54 55 56 57 58 59 60 61
in duplex stainless steel Zeron-100. Philosophical Magazine 83 (16):1867-1887
13. Qiu D, Zhang W-Z (2007) A TEM study of the crystallography of austenite precipitates in a duplex stainless steel. Acta Materialia 55 (20):6754-6764
14. Rigsbee JM, Aaronson HI (1979) A computer modeling study of partially coherent FCC: BCC boundaries. Acta Metallurgica 27 (3):351-363
15. Bollmann W (1974) O‐Lattice calculation of an FCC–BCC interface. Physica status solidi (a) 21 (2):543-550
16. Bollmann W (1970) Crystal defects and crystalline interfaces. Springer Science & Business Media, Berlin
17. Hall MG, Aaronson HI (1986) The fine structure fcc/bcc boundaries in a Cu-0.3% Cr alloy. Acta Metallurgica 34 (7):1409-1418
18. Hall MG, Rigsbee JM, Aaronson HI (1986) Application of the “0” lattice calculation to fcc/bcc interfaces. Acta Metallurgica 34 (7):1419-1431
19. Dahmen U (1981) The role of the invariant line in the search for an optimum interphase boundary by O-lattice theory. Scripta Metallurgica 15 (1):77-81
20. Dahmen U (1982) Orientation relationships in precipitation systems. Acta Metallurgica 30 (1):63-73
21. Xiao SQ, Howe JM (2000) Analysis of a two-dimensional invariant line interface for the case of a general transformation strain and application to thin-film interfaces. Acta Materialia 48 (12):3253-3260 22. Qiu D, Zhang W-Z (2003) A systematic study of irrational precipitation crystallography in fcc–bcc systems with an analytical O-line method. Philosophical Magazine 83 (27):3093-3116
23. Zhang W-Z, Purdy GR (1993) O-lattice analyses of interfacial misfit. II. Systems containing invariant lines. Philosophical Magazine A 68 (2):291-303
24. Liang Q, Reynolds Jr W (1998) Determining interphase boundary orientations from near-coincidence sites. Metallurgical and Materials Transactions A 29 (8):2059-2072
25. Kurdjumow G, Sachs G (1930) Über den mechanismus der stahlhärtung. Zeitschrift für Physik 64 (5-6):325-343
26. Zhang M-X (1997) Crystallography of phase transformations in steels. PhD Dissertation, University of Queensland, Brisbane
27. Meng Y, Gu L, Zhang W-Z (2010) Precise determination of the irrational preferred interface orientation by TEM. Acta Metallurgica Sinica 46 (4):411-417
28. Zhang W-Z, Weatherly GC (2005) On the crystallography of precipitation. Progress in materials science 50 (2):181-292
29. Dai F-Z, Zhang W-Z (2013) A systematic study on the interfacial energy of O-line interfaces in fcc/bcc systems. Modelling and Simulation in Materials Science and Engineering 21 (7):075002 30. Yang X-P, Zhang W-Z (2012) A systematic analysis of good matching sites between two lattices. Science China Technological Sciences 55:1343-1352
31. Qiu D, Zhang W-Z (2008) An extended near-coincidence-sites method and the interfacial structure of austenite precipitates in a duplex stainless steel. Acta Materialia 56 (9):2003-2014
32. Knowles KM, Smith DA (1982) The application of surface dislocation theory to the fcc-bcc interface. Acta Crystallographica Section A 38 (1):34-40
33. Kalman D (1996) A singularly valuable decomposition: the SVD of a matrix. The college mathematics journal 27 (1):2-23
34. Gu X-F, Zhang W-Z, Qiu D (2011) A systematic investigation of the development of the orientation
1 2 3 4 5 6 7 8 9 10 11 12 13 14 15 16 17 18 19 20 21 22 23 24 25 26 27 28 29 30 31 32 33 34 35 36 37 38 39 40 41 42 43 44 45 46 47 48 49 50 51 52 53 54 55 56 57 58 59 60 61
relationship in an fcc/bcc system. Acta Materialia 59:4944-4956 1 2 3 4 5 6 7 8 9 10 11 12 13 14 15 16 17 18 19 20 21 22 23 24 25 26 27 28 29 30 31 32 33 34 35 36 37 38 39 40 41 42 43 44 45 46 47 48 49 50 51 52 53 54 55 56 57 58 59 60 61
![Table 2 A comparison of the results for lath-shaped austenite in the present work with results for rod-shaped austenite from a previous work [13], and with results in Cu-Cr [5-7] and Ni-Cr alloys [1-4]](https://thumb-eu.123doks.com/thumbv2/123doknet/13705770.433903/14.892.87.811.391.690/comparison-results-austenite-present-results-austenite-previous-results.webp)