HAL Id: insu-00666208
https://hal-insu.archives-ouvertes.fr/insu-00666208
Submitted on 6 Jul 2012
HAL is a multi-disciplinary open access
archive for the deposit and dissemination of sci-entific research documents, whether they are pub-lished or not. The documents may come from teaching and research institutions in France or abroad, or from public or private research centers.
L’archive ouverte pluridisciplinaire HAL, est destinée au dépôt et à la diffusion de documents scientifiques de niveau recherche, publiés ou non, émanant des établissements d’enseignement et de recherche français ou étrangers, des laboratoires publics ou privés.
Decadal to monthly timescales of magma transfer and
reservoir growth at a caldera volcano
Timothy H. Druitt, Fidel Costa Rodriguez, M. Dungan, Bruno Scaillet
To cite this version:
Timothy H. Druitt, Fidel Costa Rodriguez, M. Dungan, Bruno Scaillet. Decadal to monthly timescales of magma transfer and reservoir growth at a caldera volcano. Nature, Nature Publishing Group, 2012, 482, pp.77-82. �10.1038/nature10706�. �insu-00666208�
Decadal to monthly timescales of magma transfer and reservoir
growth at a caldera volcano
T.H. Druitt
1,2,3, F. Costa
4, E. Deloule
5, M. Dungan
6& B. Scaillet
71 Clermont Université, Université Blaise Pascal, Laboratoire Magmas et Volcans, BP 10448, F-63000 Clermont-Ferrand, France 2 CNRS, UMR 6524, LMV, F-63038 Clermont-Ferrand, France
3 IRD, R 163, LMV, F-63038, Clermont-Ferrand, France
4 Earth Observatory of Singapore, Nanyang Technological University, Singapore 5 CRPG-CNRS, BP20, 54501 Vandoeuvre les Nancy, France
6 Département de Minéralogie, Université de Genève, Rue des Maraîchers 13 CH-1205 Genève, Switzerland
7 ISTO - UMR 6113 CNRS / Université d'Orléans/Université Francois Rabelais de Tours, 1A rue de la Ferollerie, 45071 Orleans, France
Caldera-forming volcanic eruptions are low-frequency, high-impact events capable of
discharging tens to thousands of cubic kilometres of magma explosively on timescales of hours to
days, with devastating effects at local and global scales
1. Since no such eruptions have been
monitored during the long build-up phase, the precursor phenomena are not well understood.
Interpretations of geophysical signals obtained during recent episodes of caldera unrest are
difficult to interpret, and not all periods of unrest culminate in eruptions
2,3. We have studied
pre-eruptive magmatic processes and their timescales using chemically zoned crystals from the late
17th century BC
‘Minoan’ caldera-forming eruption of Santorini Volcano, Greece
4. The results
provide insights into how rapidly large silicic systems may pass from a quiescent state to one
perched on the edge of eruption
5,6. Despite the large volume of magma erupted (40-60 km
3)
4, and
the 18,000-year gestation period since the last major eruption, most crystals in the Minoan
magma record processes that are <~100 years old. Recharge of the magma reservoir by silicic
magma occurred during the century prior to eruption, with mixing between different silicic
magma batches still taking place during the final months. Large silicic magma reservoirs may
apparently be emplaced on timescales that are geologically very short compared to the preceding
repose period, with major growth phases immediately before eruption. These observations have
implications for monitoring strategies and responses to unrest at long-dormant, but potentially
active, caldera systems such as Yellowstone or Campi Flegrei
2.
Crystals in volcanic rocks provide records of magma-reservoir processes and timescales prior to eruptions7. A crystal growing from a magmatic melt incorporates trace elements in quantities governed by
diffuse sufficiently fast will begin to re-equilibrate with the new host melt, generating intra-crystalline diffusion gradients than can be used to obtain time information10-12 (Supplementary Fig. S1).
A novel technique for extracting multiple timescales from single crystals has been applied to plagioclase crystals in rhyodacitic (71-72 wt% SiO2) pumices from the Minoan eruption. The pumices from all four phases
of the eruption (1. plinian; 2 and 3. phreatomagmetaic; 4. ignimbrite13) contain ~10 vol% crystals set in rhyolitic (73-74 wt% SiO2)13 glass. Plagioclase is the dominant crystalline phase, the others being orthopyroxene,
clinopyroxene, magnetite, ilmenite and apatite. It occurs as zoned crystals, whose compositional variations are dominated by charge-coupled solid solution between the end-members anorthite (An – CaAl2Si2O8) and albite
(NaAlSi3O8).
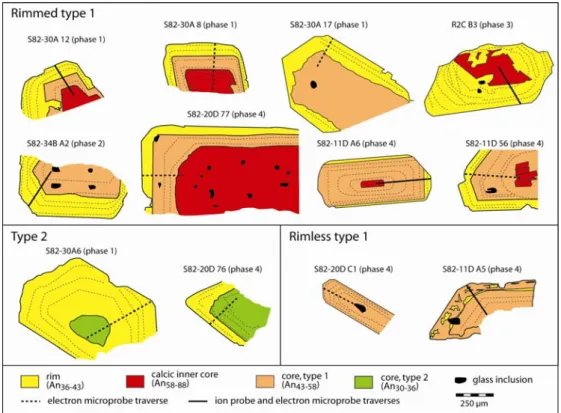
Two types of plagioclase have been recognized from examination of 300 crystals (Fig. 1; Figs. S2 and S3). A dominant type (type 1) has a euhedral to partly resorbed core of An58-43 overgrown by a variably
developed, euhedral rim of An43-36 containing multiple dissolution surfaces (Figs. 1a-d). The cores and rims
form compositionally distinct populations (Fig. 1g). In some crystals, the core also contains a euhedral to anhedral inner core of An88-58 (‘calcic inner core’; Fig 1 a, c). A spectrum of type 1 crystals is observed from
those with thick rims (up to 100 µm), to those with thin rims, to those in which the rim is absent (Fig. 1f). In rimmed type 1 crystals the plagioclase in contact with the host glass is ~ An40, whereas in rimless ones it is ~An50
(i.e., the core composition). Rimmed type-1 crystals occur in pumices from all four eruptive phases, but rimless ones have only been observed in pumices from phase 4. Type 2 crystals are very rare; they are reversely zoned, with cores of An36-30 mantled by rims identical to those of type 1 (Fig. 1e). The broad range of plagioclase
compositions in Minoan pumice shows that the rhyodacite was the product of open-system magmatic processes involving multiple, compositionally diverse magmas.
Trace elements were analysed in four rimmed type-1 crystals, one rimless type-1 crystal, some
interstitial glasses and some inclusions of glass contained within the crystals (Fig. 2; Tables S1 and S2). Mg, Sr and Ti are particularly useful elements for characterizing coexisting melt compositions and mixing time scales because they partition differently between melt and plagioclase8 and diffuse at different rates. Mg diffuses faster
than Sr7; Ti probably diffuses slowly due to its high charge. Published An-dependent partition coefficients8 were
used to invert melt trace element contents to those of equivalent plagioclase (Fig. 2), and vice versa (Fig. 3). Rimmed type-1 crystals have core-to-rim gradients in all the three elements (Fig. 2). Rim compositions record equilibrium with the interstitial glass, but concentrations of Mg, Sr, and Ti in the cores and calcic inner cores are significantly higher than those calculated to be in equilibrium with the glass (green lines, Fig. 2). The rimless type-1 crystal has concentrations of Mg and Sr throughout that are too high to have been in equilibrium with the glass. None of these crystals resided in the host melt long enough for any of these the elements to reach total equilibrium with the host melt.
This observation is reinforced by a comparison of calculated Mg, Ti, and Sr concentrations of melts in equilibrium with the different plagioclase zones (referred to as Mgmelt, Srmelt, and Timelt), with those of Santorini
(Fig. 3a, b). The calculated concentrations of Srmelt and Timelt span the entire range of erupted compositions,
whereas those of Mgmelt fall below the liquid line of descent, especially in the calcic inner cores. The crystals
retain near-primary values of Srand Ti, but Mg appears to have been partially re-equilibrated by diffusion. The Sr contents of the crystals were used to calculate the compositions of melts from which the different zones had crystallized (Fig. 3). The rims of the type-1 and type-2 crystals formed from melts with 60-90 ppm Sr (71-74 % SiO2), which encompasses the range of whole-rock to glass compositions of the host rhyodacite. The
cores of the type-1 crystals formed from melts with 110-170 ppm Sr (dacite with 63-69 % SiO2), and the cores of
the type-2 crystals formed from melts with 40-60 ppm Sr (rhyolite with 74-76 wt % SiO2). We interpret these
observations as recording the mixing of a dacite (carrying plagioclase of the type-1 core composition) with a rhyolite (carrying rare plagioclase of the type-2 core composition) to generate a hybrid rhyodacite (followed by growth of the rim) that was erupted as the Minoan pumice. The rimless type-1 crystals were derived directly from the dacite, and had not resided in the hybrid rhyodacite long enough to grow rims. The calcic inner cores formed from basaltic-andesite melts with >200 ppm Sr and <57 % SiO2 that were mixed into the dacite at an
early stage.
The times elapsed between the different mixing events and eruption have been calculated by modelling the partial relaxation of Mg concentrations in different parts of the crystals12 (Fig. 2; Table 1). We first modelled the entire crystal (‘1-step model’), which assumes that diffusion started only after the crystal had grown. Model results ranged from 1 to 60 years, but good fits could not be obtained. We therefore approximated the more realistic situation of simultaneous crystal growth and diffusion by modelling the crystals incrementally zone by zone (‘2-step model’). In this manner we obtained better overall fits to the data (Fig. 2), from which we infer that: (1) a first magma mixing episode recorded by incorporation of the calcic inner cores of the type-1 crystals into the dacite occurred no more than ~100 years prior to eruption; (2) a second mixing episode, or series of episodes, involving the dacite and the rhyolite occurred less than ~10 years prior to eruption; (3) the rimless type-1 crystals cannot have resided in the Minoan magma more than a few months without some diffusive loss of Mg from the rim. We have no constraints on the ages of the cores of the rare type-2 crystals. The estimates are robust to better than an order of magnitude (Methods section). The Mg-derived times were tested against the diffusive equilibration of Sr using the comprehensive diffusion data for this element (Fig. 2). Taking the measured profiles of Sr as being close to initial values, diffusion times an order of magnitude longer than those obtained from Mg would significantly blur the observed tight correlation between Sr and An contents (Fig. 3c), and are ruled out.
Our interpretation, which is justified more fully in the Supplementary Discussion, is as follows. During the century prior to eruption, dacitic magma containing crystals of calcic plagioclase began to ascend from a deep storage zone beneath Santorini, possibly pushed by injections of mafic magma (Fig. S4). Once at shallow levels, the dacite intersected one or more extant bodies of rhyolite situated at a few km depth14. The cores of the
type-1 crystals grew during ascent of the dacite, and/or ponding of it at the base of the reservoir. Then, starting about a decade prior the eruption, the dacite mixed with the rhyolite, forming rim overgrowths on those crystals.
Mixing caused resorption of most crystals initially present in the rhyolite, and formed the hybrid rhyodacite that was subsequently erupted. Successive waves of dacitic recharge and heating of the reservoir are recorded as multiple dissolution surfaces within the crystal rims. Dacite was still being mixed into the shallow reservoir less than a few months before eruption occurred, supplying the rimless type-1 crystals. Efficient mixing of the two silicic magmas on these timescales is compatible with fluid dynamics principles (Supplementary Discussion). Basaltic andesite was also injected at a late stage, accounting for small quantities of scoria discharged during the first eruptive phase13. The resident rhyolite must have been more radiogenic than the dacite, since Minoan
plagioclase crystals have lower Sr isotopic ratios than their host glass15. The rhyolite had probably been crustally
contaminated during residence at high crustal levels. The dacite may have been a vanguard batch of the magmas that have erupted over the last 2000 years to form the postcaldera Kameni Islands13. This interpretation is based
on similarities in An and Sr contents between the cores of type-1 plagioclases and those of plagioclases in the postcaldera lavas16,17 (Figs. 1 and 3).
Calculations based on chemical mass balance and crystal content show that the dacite accounted for at least 15 % of the hybrid rhyodacite (Supplementary Discussion). We conservatively conclude that the Minoan reservoir increased its volume by at least a few km3 in the last century prior to eruption (corresponding to an
intrusion rate of >0.05 km3/y), accommodated by some combination of roof flexure, lateral intrusion and reservoir-floor subsidence18,19. This timescale is very short compared to the 18,000-y gestation period since the
previous major explosive eruption of Santorini13, suggesting that the Minoan reservoir was a transient feature on geological timescales14,20,21.
Our study has important implications for the recognition and interpretation of precursor signals prior to caldera-forming eruptions. It shows that shallow bodies of silicic magma may be emplaced rapidly beneath caldera systems following long periods of dormancy, with significant growth phases still taking place in the final months before eruption. Even our conservative estimate of magma recharge rate prior to the Minoan eruption exceeds those measured at historically restless caldera systems that have not resulted in eruptions (typically ~0.01 km3/y)2,3, suggesting that particularly high and sustained rates may be necessary to trigger eruptions in
such systems22. Indeed evidence is emerging of large recharge events involving magmas of a wide range of
compositions, in the decades to months leading up to other large explosive eruptions11,23-25. Long-term monitoring of large, dormant caldera systems is essential in order to ensure detection of geophysical and geochemical signals resulting from these processes during the possibly short-lived build-up to caldera-forming eruptions.
METHODS SUMMARY
The zoning textures of about 300 crystals from eight pumices (from all four eruptive phases) were studied using a combination of back-scattered electron microscopy and Normarski differential interference contrast microscopy. Major element compositions of minerals and glasses were analyzed by electron microprobe, and trace elements by secondary ion mass spectrometry. The pre-eruptive temperature of the
Minoan rhyodacite (853+12 °C) was calculated using analyses of touching magnetite-ilmenite pairs in pumices from all eruptive phases, the recalculation procedure of ref. 26, and the thermometer of ref. 27.
Trace element diffusion modelling was carried out in one dimension using a forward modelling
approach in which the diffusion equation12 was solved numerically by a finite difference scheme, and visual
best-fits were made between modelled and observed concentration profiles. The An-dependent diffusion coefficient for Mg was taken from ref. 12, based on the experimental data of ref. 28, and that for Sr was taken from ref. 29. Initial profiles for Mg were calculated using the Sr-An correlation of Fig. 3c, along with the Mg-Sr liquid line of descent (Fig. 3b). The boundary conditions were determined by the measured concentrations at the crystal rims or at other major boundary zones. The calculated times are probably overestimates because some of the cores have re-equilibrated significantly, so that the effect of diffusion in multiple dimensions could have been significant7. However, the main errors associated with the calculations arise from uncertainties of temperature
and diffusion coefficients. The modelling was carried out at either 855 or 900 °C, depending on the melt involved (Table 1), but we considered a nominal uncertainty of +25 oC, which when propagated onto the time
estimates leads to relative errors of 45-75 % (Table 1). Effects of uncertainties in the diffusion parameters for Mg are discussed in the Methods section.
References
1. Miller, C.F. & Wark, D.A. Supervolcanoes and their explosive supereruptions. Elements 4, 11-16 (2008).
2. Newhall, C.G. & Dzurizin, D. Historical unrest at large calderas of the world. U.S. Geol. Surv. Bull.
1855, 1108 pp (1988).
3. Gottsmann, J. & Marti, J. Caldera volcanism: analysis, modelling and response. Developments in Volcanology 10, Elsevier, 492 pp (2008).
4. Sigurdsson H, Carey S & 12 others. Marine investigations of Greece’s Santorini volcanic field. EOS 87: 337-342 (2006).
5. Bachmann, O. & Bergantz, G.W. On the origin of crystal-poor rhyolites: Extracted from batholithic crystal mushes. J. Petrol. 45, 1565-1582 (2004).
6. Burgisser, A. & Bergantz, G.W. A rapid mechanism to remobilize and homogenize highly crystalline magma bodies. Nature 471, 212-215 (2011).
7. Costa, F., Dohmen, R. & Chakraborty S. Timescales of magmatic processes from modeling the zoning patterns of crystals. Rev. Mineral. Geochem. 69, 545-594 (2008).
8. Bindeman, I.N., Davis, A.M. & Drake, M.J. Ion microprobe study of plagioclase-basalt partition
experiments at natural concentration levels of trace elements. Geochim. Cosmochim. Acta 62, 1175-1193 (1998).
9. Blundy, J. & Wood, B. Crystal-chemical control on the partitioning of Sr and Ba between plagioclase feldspar, silicate melts, and hydrothermal solutions. Geochim. Cosmochim. Acta 55, 193-209 (1991). 10. Zellmer, G.F., Blake, S., Vance, D., Hawkesworth, C. & Turner, S. Plagioclase residence times at two
island arc volcanoes (Kameni Islands, Santorini, and Soufriere, St Vincent) determined by Sr diffusion systematics. Contrib. Mineral. Petrol. 136, 345-357 (1999).
11. Morgan, D.J., Blake, S., Rogers, N.W., De Vivo, B., Rolandi, G. & Davidson, J. Magma chamber recharge at Vesuvius in the century prior to the eruption of A.D. 79. Geology 34, 845-848 (2006). 12. Costa, F., Chakraborty, S. & Dohmen, R. Diffusion coupling between trace and major elements and a
model for calculation of magma residence time using plagioclase. Geochim. Cosmochim. Acta, 67, 2189-2200 (2003).
Barreiro, B. Santorini Volcano. J. Geol. Soc. Lond. Memoirs 19, 165pp (1999).
14. Cottrell, E., Gardner, J.E. & Rutherford, M.J. Petrologic and experimental evidence for the movement and heating of the pre-eruptive Minoan rhyodacite (Santorini, Greece). Contrib. Mineral. Petrol. 135, 315-331 (1999).
15. Martin, V., Davidson, J., Morgan, D. & Jerram, D. Using the Sr isotope compositions of feldspars and glass to distinguish magma system components and dynamics Geology, 38, 539-542 (2010).
16. Francalanci, L., Vougioukalakis, G., & 5 others. Petrographic, chemical and isotopic variations in the intra-caldera post-Minoan rocks of the Santorini volcanic field. Proceedings of the second workshop, Santorini, Greece, European Commission pp175-186 (1998).
17. Huijsmans, J. Calc-alkaline lavas from the volcanic complex of Santorini, Aegean Sea, Greece. Geologica Ultraiectina 41, 316 pp (1985).
18. Pitcher, W.S. & Bussell, M.A. Structural control of batholithic emplacement in Peru: a review. J. Geol. Soc. Lond. 133, 249-255 (1977).
19. Grocott, J., Arévalo, C., Welkner, D. & Cruden, A. Fault-assisted vertical pluton growth: Coastal Cordillera, north Chilean Andes. J. Geol. Soc. Lond. 166, 295-301 (2009).
20. Glazner, A.F., Bartley, J.M., Coleman, D.S., Gray, W. & Taylor, R.Z. Are plutons assembled over millions of years by amalgamation from small magma chambers? GSA Today 14, 4-11 (2004). 21. Annen, C. From plutons to magma chambers. Thermal constraints on the accumulation of eruptible
silicic magma in the upper crust. Earth Planet. Sci. Lett. 284, 409-416 (2009).
22. Jellenik, A.M. & DePaulo, D.J. A model for the origin of large silicic magma chambers: precursors of caldera-forming eruptions. Bull. Volcanol. 65, 363-381 (2003).
23. Wark, D.A., Hildreth, W., Spear, F.S., Cherniak, D.J. & Watson, E.B. Pre-eruption recharge of the Bishop magma system. Geology 35, 235-238 (2007).
24. Saunders, K.E., Morgan, D.J., Baker, J.A. & Wysoczanski, R.J. The magmatic evolution of the Whakamaru supereruption, New Zealand, constrained by a microanalytical study of plagioclase and quartz. J. Petrol. 51, 2465-2488 (2010).
25. De Silva, S., Salas, G. & Schubring, S. Triggering explosive eruptions – The case for silicic magma recharge at Huaynaputina, southern Peru. Geology 36, 387-390 (2008).
26. Stormer, Jr. J.C., The effects of recalculation on estimates of temperature and oxygen fugacity from analyses of multicomponent iron-titanium oxides. Amer. Mineral. 68, 586–594 (1983).
27. Andersen, D.J. & Lindsley, D.H., New (and final!) models for the Ti-magnetite/ilmenite
geothermometer and oxygen barometer. Eos Transactions. American Geophysical Union 66, 416 (1985). 28. LaTourette, T. & Wasserbourg, G.J. Mg diffusion in anorthite: implications for the formation of early
solar system planetismals. Earth Planet. Sci. Lett. 158, 91-108 (1998).
29. Giletti, B.J. & Casserly, J.E.D. Strontium diffusion kinetics in plagioclase feldspars. Geochim. Cosmochim. Acta 58: 3785-3797 (1994).
30. Santo, A.P. Magmatic evolution processes as recorded in plagioclase phenocrysts of Nea Kameni rocks (Santorini Volcano, Greece). Developments in Volcanology 7, 139-160 (2005).
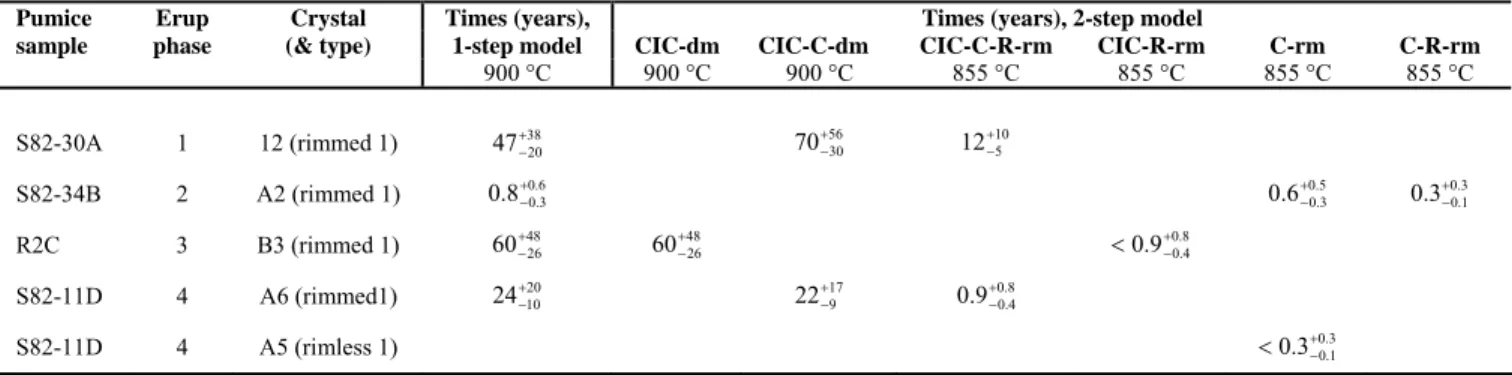
Table 1. Times obtained by diffusion modelling of Mg in Minoan plagioclase
Pumice Erup Crystal Times (years), Times (years), 2-step model
sample phase (& type) 1-step model CIC-dm CIC-C-dm CIC-C-R-rm CIC-R-rm C-rm C-R-rm
900 °C 900 °C 900 °C 855 °C 855 °C 855 °C 855 °C S82-30A 1 12 (rimmed 1) 38 20 47+ − 705630 + − 12105 + − S82-34B 2 A2 (rimmed 1) 0.6 3 . 0 8 . 0 + − 0.6+−00..53 0.3+−00..31 R2C 3 B3 (rimmed 1) 48 26 60+ − 604826 + − 0.900..84 + − < S82-11D 4 A6 (rimmed1) 20 10 24+ − 22+−179 0.9+−00..48 S82-11D 4 A5 (rimless 1) 0.3 1 . 0 3 . 0 + − <
CIC – calcic inner core, C - core, R - rim, dm – dacitic melt, rm – rhyodacitic melt. The calculations were done at the temperatures shown, which correspond to those of dacitic and rhyodacitic melts. The quoted errors correspond to a temperature uncertainty of +25 oC on the calculated time.
FIGURE CAPTIONS
Figure 1 | Images and compositions of plagioclase crystals in Minoan pumice. a-b Back-scattered electron
images of two rimmed type-1 crystals (S82-30A 12 and S82-34B A2). c-f Sketches of representative plagioclase crystals of the different types (c: S82-30A 12; d: S82-34B A2; e: S82-20D 76; f: S82-20D C1). More crystals are shown in Fig. S2 of the Supplementary Information. g Histogram of Minoan plagioclase compositions, based on 922 analyses, showing the different compositional groups. A histogram of plagioclase compositions from the postcaldera lavas16,17 is shown for comparison.
Figure 2 | Concentration-distance profiles of An (red dots) and of Sr, Ti and Mg (black dots) in Minoan plagioclase crystals (error bars +1 σ). Equilibrium profiles for Sr, Ti and Mg (green lines) were calculated
using published partition functions8 at 855 °C. Calculated plagioclase compositions in equilibriumwith
interstitial glass (ig), glass inclusion (gi) and whole-rock (wr) pumice compositions13 are also shown. Initial Mg
profiles are the blue lines (with 1σ range). The red solid lines on the Mg plot are the best-fit 2-step Mg diffusion models (time shown in years). The red dotted lines on the Sr plots are diffusion models (1-step models; 900 °C; time shown in years) assuming that the measured profile is close to the initial condition as suggested by Fig. 3a. They show that times an order of magnitude longer than those derived from Mg would be inconsistent with the observed correlation between Sr and An contents (Fig. 3c).
Figure 3 | Melt compositions calculated by inversion of plagioclase trace element compositions. a-b Ti, Mg
and Sr melt contents calculated using the plagioclase-liquid partition functions of ref. 8. Temperature was obtained from T (°C) = 855 + 200.(%An-40)/(80-40), which assumes that An40 plagioclase crystallized at 855 °C
and An80 crystallized at 1055 °C, the temperature of Santorini basaltic andesite. The values are compared with
the compositional fields of Santorini cycle-2 lavas17, Minoan pumice and Minoan glasses. The range of Mg melt
values calculated in the same way from the Mg contents of calcic (An>80) plagioclase in Santorini basalts and basaltic andesites are much higher (14000-47000 ppm) than those in the calcic inner cores of Minoan crystals, showing that the latter have lost Mg by diffusion. c-d Use of calculated melt Sr contents from plagioclase enables estimation of the SiO2 contents of the melts from which each plagioclase compositional group
crystallized. The compositional field of plagioclases in the postcaldera lavas is taken from ref. 30.
Supplementary Information.
Six additional figures, details of analytical and modelling methods, tables of trace element data for plagioclases and glasses and discussions of data and interpretations.
Acknowledgements
This study was funded partly by the French Agence National de Recherche (ANR STOMIXAN, Contract No ANR-08CEA080 to B. Scaillet). We are grateful to Robin Armstrong, Pierre Crançon and Rachel Girardin for their contributions during the early stages of this study, and to Jon Blundy and Mary Reid for helpful reviews.
Author contributions. T.D. defined the project strategy, analysed the data, and wrote the first draft of the
manuscript, which was then revised by all the authors. E.D., MD. and T.D. made the trace element analyses, F.C. did the diffusion modelling, and BS applied the fluid dynamic principles.
Author information. Correspondence and requests for materials should be addressed to T.D.
(T.Druitt@opgc.univ-bpclermont.fr).
METHODS
Sample preparation and analysis
Plagioclase crystals (250-400 and 400-700 μm size fractions) from eight pumices from all four eruptive phases13 were mounted in epoxy resin, mostly on (010), then polished. The zoning textures of about 300 crystals
were studied using a combination of back-scattered electron microscopy and Normarski differential interference contrast microscopy. Sectioning through the centres of the crystals was maximized by visual observation using a binocular microscope, and by rejection of zoning images that were evidently oblique cuts. Major element compositions of plagioclase were analyzed using a Cameca SX100 electron microprobe at an accelerating voltage of 15-20 kV and beam current of 8-15 nA.
Abundances of a number of isotopes up to 140Ce, including 24Mg, 47Ti and 88Sr, were analysed using two
ion probes: a Cameca IMS 4f instrument at the University of Edinburgh (4.5-5 nA primary O- beam) and a Cameca IMS 1280 instrument at the CRPG, Nancy (14-20 nA primary O- beam) using beam diameters of 10-15
μm and calibrated against glass standards NBS 6104 and ML3B-G. Secondary ions were energy filtered using bandpasses of 100 V and 35 V, offsets of 100 V and 60 V, and mass resolutions of 300 and 5000 on the IMS 4f and the IMS 1280 respectively, following a short pre-sputtering period. Only high-energy ions were measured in order to reduce the matrix effect on relative ion yields31. The calibration line for Sr, including glass standards
StHs, KL2G, TIG BHVO and BCR2G, and CRPG reference albite and plagioclase, display no matrix effect for a large range of glass and mineral compositions. Isotope concentrations were expressed as ratios relative to 30Si,
then corrected using electron microprobe analyses of Si contents adjacent to the ion probe pits. The relative ionisation yields were determined on glass standards. Internal precisions (mean relative deviation) on the ion/30Si
ratios for each spot analysis were typically better than 5% for Mg, 5% for Sr, and 10% for Ti. Values for all elements on the IMS 4f were systematically slightly lower than those on the IMS 1280, and were raised using a small multiplication factor.
Selected profiles were also analysed for Mg using a Cameca SX100 electron microprobe (accelerating voltage 15 kV; beam current 40 nA; total counting time per spot 50 s), and using a LA-ICP-MS system consisting of a 193 nm excimer (ArF) laser-ablation system (M50, Resonetics) coupled to an Agilent 7500CS ICP-MS (10 µm beam size; 6 mJ beam energy; 1Hz repetition rate). Results from the three techniques agreed to within + 25 %.
Crystal-melt trace element partitioning
We used the An-dependent partition functions of ref. 8 for Mg, Sr and Ti. The Sr partition function of ref. 9 gives results within a few percent of that of ref. 8. The partition functions for Mg, Sr and Ti of ref. 8 seem to work quite well for Santorini compositions. There is good agreement between the contents of Sr and Ti in the crystal rims and the plagioclase compositions calculated to be in equilibrium with the interstitial glasses (Fig. 2). Agreement for Mg is not as good, although the disparity is small compared to the overall range of this element in Santorini plagioclases and melts (Figs. 2 and 3b). Sr and Ti contents of the calcic inner cores of Minoan
plagioclase crystals agree with those predicted by ref 8 to be in equilibrium with Santorini basaltic and basaltic andesite melts (Fig. 3a). Mg contents of calcic plagioclase occurring in Santorini basalts and basaltic andesites 32-34 agree with the Mg contents of those rocks (Fig. 3b) using the Mg partition coefficient of ref 8.
Diffusion modelling
Diffusion modelling was carried out using the method of ref. 12 with distance increments of 3.5-5.3 µm. We used the Mg diffusion coefficient in plagioclase of ref. 12, which is based on the experimental data of ref. 28.
⎥⎦
⎤
⎢⎣
⎡
×
=
2.92
10
exp(
-
266000
)
D
(-4.1 -3.1) MgRT
XAn [S1]The diffusion coefficient for Sr was taken from ref. 29.
⎥⎦
⎤
⎢⎣
⎡
×
=
2.92
10
−exp(
-
276000
)
D
(-4.1 4.08) SrRT
XAn [S2]where D is the element diffusion coefficient in m2s-1, XAn is the mol fraction of anorthite, and T is the
temperature in Kelvin. From these equations, DMg>DSr at all temperatures in plagioclase of a given An content.
We used the equation for trace element diffusion in plagioclase derived in ref. 12, which takes into account the effect of An content on equilibrium profile shapes and diffusion coefficients,
∂Ci ∂t = (Di ∂2 Ci ∂x2 + ∂Ci ∂x ∂Di ∂x )− A RT(Di ∂Ci ∂x ∂XAn ∂x + Ci ∂Di ∂x ∂XAn ∂x + DiCi ∂2 XAn ∂x2 ) [S3]
where A is a thermodynamic factor that relates the dependence of the partition coefficient on the An content8, x
is distance, C is concentration, and t is time.
We used two temperatures in the modelling: 900 °C for models in which the host melt was dacitic, and 855 °C for those in which it was rhyodacitic (Table 1). These temperatures are constrained by the 855 °C
temperature of the magma on eruption (from touching pairs of Fe-Ti oxides), and are consistent with the formula used for plagioclase-melt element partitioning (legend of Fig. 3).
The equilibrium distributions of Mg, Sr and Ti within the plagioclase crystals were obtained as follows. We first calculated the plagioclase-melt partition coefficients using the measured An contents and the equations of ref. 8. Using the partition coefficients, and the measured trace element concentrations at the crystal rims, we then calculated a melt composition in equilibrium with the rim. Finally, the composition of the entire plagioclase crystal in equilibrium with the calculated melt (and crystal rim) was calculated using the partition coefficient for each portion of the crystal.
The initial Mg profile was estimated using the Sr-An correlation of Fig. 3c and the Mg-Sr liquid line of descent (Fig. 3b). The relationship between the initial Mg and An contents used in the modelling is: ppmMg = 48.2 exp[2.9 XAn]. This approach is justified because the times involved in the processes are short enough not to have affected Sr concentrations in any significant manner. The uncertainty in the initial Mg content shown in Fig. 2 was estimated by error propagation. For the boundary conditions we used measured concentrations at the rims of the crystals or at the appropriate boundary between two crystal zones in the multiple step models.
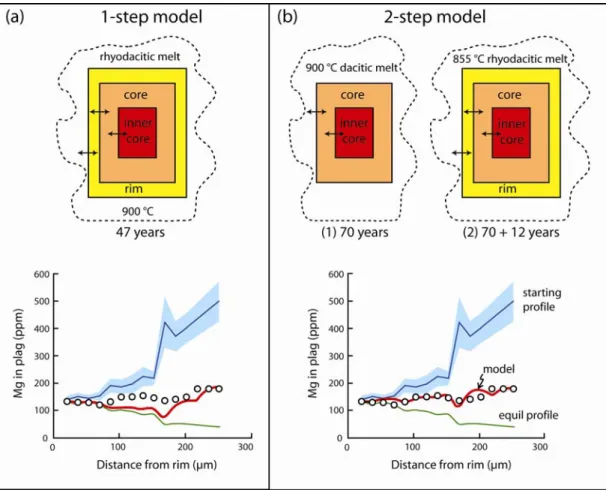
In the modelling we explored two end-member possibilities. (1) Model the entire crystal including the rim, core, and calcic inner core all at once (1-step model) at 900 °C. This is like assuming that diffusion started only after the crystal was fully grown, and is the approach of all previously published models using plagioclase.
This should not be a bad approximation if the diffusion time is relatively long and if growth rates are relatively high. (2) Model the crystal by pieces; for example, first model equilibration of the calcic inner core with either 900 °C dacitic melt or with the crystal core and the dacitic melt, then add the rim and 855 °C rhyodacitic melt and continue diffusing (2-step model). This is a first-order approximation for modelling simultaneous crystal growth and diffusion. We have tried both approaches, and in most cases there are no significant differences in total times, but the fits to the data are better if we use the 2-step approach. This also gives us additional information about the timescales of different processes recorded in different parts of the crystals. To our best knowledge this is the first time that plagioclase zoning has been used to provide chronologies of multiple events from single crystals. It is interesting to see that, in order to successfully model some crystals, we need to use a condition where Mg in the crystal was already equilibrating with the host melt before any subsequent
overgrowth by a new composition.
We illustrate the two approaches using crystal S82-30A 12 (Fig. S5). We were not able to obtain a good fit to the measured Mg profiles using a 1-step model, which gave an approximate time of 47 years. We therefore modelled the diffusion using the 2-step approach. We first did an inner-core/core/melt equilibration at 900 °C, and obtained a time of 70 years (step 1 of Fig. S4b). We then added the rim over the core, continued to diffuse at 855 °C, and obtained a further time of 12 years (step 2 of Fig. S4b). The total time recorded by the crystal is therefore 82 years, with a fit that is clearly better than with a 1-step approach. We also tried more detailed models involving, for example, 3 steps (inner-core/melt, inner-core/core/melt, and inner-core/core/rim/melt, but the results were virtually identical to the 2-step model.
In the case of the rimless type-1 crystal (S82-11D A5), the composition of which is out of equilibrium with the host rhyodacitic melt, we modelled the time necessary for Mg and Sr in the outer 25 µm of the crystal to be significantly modified by diffusive re-equilibration. The times at 855 °C were 0.3 years for Mg (Table 1) and 12 years for Sr. The crystal therefore cannot have resided in the melt for longer than 0.3 years.
The times obtained from Mg diffusion calculations are subject to various types of uncertainties7. First,
the temperatures obtained from geothermometers have errors of about +25 oC, which when propagated onto the
time estimates lead to the relative uncertainties given in Table 1. Second, the diffusion calculations were carried out in 1D, which has been shown to overestimate actual (3D) diffusion time7 when the extent of diffusion is as significant as that shown by some of the inner cores of our crystals. Third, uncertainty arises from experimentally determined diffusion coefficients. Mg diffusion in plagioclase28 was measured on An95 and at
1200-1400 °C, and the measurements are precise to within a factor of two. Following ref 12, equation S1 assumes that the activation energy and pre-exponential factor determined for DMg at higher temperatures applies
at 900 °C. Down-temperature extrapolation of diffusion data is common practice, and a necessity for almost all studies that use experimentally determined diffusion coefficients to model natural processes35,36. This is because
the experimental times required to produce significant profiles to determine Ds are impossibly long (but see ref 37) . The extrapolation is not a significant problem if there is no change of the diffusion mechanism (which would imply a change in the activation energy) at lower temperatures. There have been many determinations of
other cation diffusivities (e.g., Sr, Li, Ca38) in plagioclase feldspars at a wide ranges of temperatures (including 900 °C), and these do not show kinks in activation energy.
There is also uncertainty on the An dependence in equation S1, which assumes that the An dependence of Mg diffusion is the same as that of Sr12. This assumption was usedin ref 12 because only certain dependencies
are possible to obtain good fits to the natural data. In addition to this observation, we have here estimated an uncertainty due to the An dependence term in equation S1 by combining natural data and the well calibrated Sr diffusivities. The data in Table 1 and Fig. 2, as well as that published elsewhere 7,39,40, show that the degree of
equilibration of Mg is always higher than that of Sr, irrespective of An content. This means that DMg > DSr not
only for An95 (ref 28), but for all An contents. Thus, the dependence of DMg on An can not be too low because
otherwise DSr > DMg at low An. Using this constraint, and equation S2 for DSr, the minimum possible dependence
of An has the form of (-2.6XAn -4.53) in equation S1, which is a much lower slope (Fig. S6). The effect that this
has on the times ranges from a factor of two longer for the 1-step fit for crystal R2C B3 (130 years), to a factor of three longer for crystal 34BA2 (2.3 years). We conclude that the uncertainty in this parameter does not increase the times in Table 1 by more than about a factor of three.
We also carried out diffusion modelling of Sr (for which the diffusion parameters are very well constrained29; Fig. 2), in order to gain first-order independent constrains on the timescales inferred from Mg. For this we assumed that the observed profiles were near-primary and carried out 1-step diffusion models at 900 °C to see what times were required for significant perturbation of those profiles. The results (Fig. 2) show that crystal residence times longer than a couple of hundred years would significantly blur the tight relationship between plagioclase Sr and An content (Fig. 3c), and are therefore excluded.
Finally, there is also an uncertainty on the determination of the best fits of the model and measured concentrations, which include the analytical errors. The fits were done visually because, given the complexity of the natural profiles, it doesn't make sense to implement least-squares routines. The uncertainty from this varies from crystal to crystal, and ranges from less than 10% for crystals that have been largely equilibrated (eg., step 1 of most crystals) to up to 40 % for step 2, where concentrations vary by a small amount and may be close to the initial values (e.g., crystal S82-34B A2).
References
31. Hinton, R.W. Ion microprobe trace-element analysis of silicates: Measurement of multi-element glasses, Chemical Geology 83, 11-25 (1990).
32. Vaggelli, G., Pellegrini, M., Vougioukalakis, G., Innocenti, S. & Francalanci, L. Highly Sr radiogenic tholeiitic magmas in the latest inter-plinian activity of Santorini volcano, Greece. J. Geophys. Res. 114, BO6201 (2009).
33. Conticelli, S., Francalanci, L., Santo, A.P. & Petrone C. Petrographic, chemical and isotopic variations in the intra-caldera post-Minoan rocks of the Santorini volcanic field. Proceedings of the second workshop, Santorini, Greece, European Commission pp157-174 (1998).
34. Gertisser, R., Preece, K. & Keller, J. The Plinian Lower Pumice 2 eruption, Santorini, Greece: Magma evolution and volatile behaviour. J. Volcanol. Geotherm. Res. 186, 387-406 (2009).
36. Zhang, Y. Diffusion in minerals and melts: Theoretical background. Rev. Mineral. Geochem. 72, 5-59 (2010).
37. Chakraborty, S., Dohmen, R., Becker, H.W., Meissner, E. & Etzel, T. Production of silicate thin films using pulsed laser deposition (PLD) and applications to studies in mineral kinetics. Eur J Mineral 14, 1155-1168 (2002).
38. Cherniak, D. Cation diffusion in feldspars. Rev. Mineral. Geochem. 72, 691-733 (2010).
39. Costa, F., Coogan, L. & Chakraborty S. The time scales of magma mixing and mingling involving primitive melts and melt–mush interaction at mid-ocean ridges. Contrib. Mineral. Petrol. 159, 371–387 (2010).
40. Costa, F. & Morgan D. Time constraints from chemical equilibration in magmatic crystals. In Timescales of magmatic processes: from core to atmosphere (eds Dosseto, A., Turner, S.P. & Van Orman, J.A), 125-159 (Wiley-Blackwell, 2010).
250 μm
(d) Rimmed type 1
(e) Type 2
(c) Rimmed type 1
with inner core
(f) Rimless
type 1
100
80
60
40
20
30
40
50
60
70
80
90
0
20
0
Rim Core, type 1
Core, type 2
Calcic inner cores
Minoan
Postcaldera
Number of analyses
% Anorthite
core, type 2 (An30-36) rim (An36-43) core, type 1 (An43-58)calcic inner core (An58-88)
glass inclusion
(g)
(a)
0 100 200 300
0 100 200 300 0 100 200 300 400 500
Mg in plag (ppm)
Distance from rim (μm) Distance from rim (μm) Distance from rim (μm) Distance from rim (μm)
500 400 300 200 100 0 0 100 200 300 ig gi wr Sr in plag (ppm) 600 500 400 300 200 100 0 Ti Ti Ti Ti S82-30A 12 (rimmed type 1) S82-34B A2 (rimmed type 1) R2C B3 (rimmed type 1) S82-11D A6 (rimmed type 1N) S82-11D A5 (rimless type 1)
rim core inner core rim core rim inner core r core inner core
76 y 400 y 40 y 4 y 70 y at 900 °C plus 12 y at 855 °C 0.6 y at 900 °C plus 0.3 y at 855 °C 60 y at 900 °C plus 0.9 y at 855 °C 22 y at 900 °C plus 0.9 y at 855 °C 22 y 220 y 2200 y 600 y 60 y 760 y An An An An Ti in plag (ppm) 300 200 100 0 An in plag (mol %) 90 80 70 60 50 40 30 An
0 2000 4000 6000 8000 10000 Ti (ppm) in melts
Calculated melts from plag
1 σ Santorini lava, pumice, glass
30 50 70 90 An (%) 0 20000 40000 Mg (ppm) in melts 50 60 70 80 SiO 2 (wt %) in melts rim core type 1 core ty 2
calcic inner core
Sr (ppm) in melts 0 100 200 300 0 100 200 300 0 100 200 300 0 100 200 300 postcaldera lavas plagioclase in postcaldera lavas Range of Mgmelt values
given by Mg contents of calcic plag in Santorini basalts and basaltic andesites 1 σ (a) (b) (c) (d)
SUPPLEMENTARY INFORMATION
1. Supplementary Figures
Figure S1 : Schematic figure showing a crystal growing from a melt with a given set of variables (P: pressure, T: temperature, X: composition). The arrows show traverses corresponding to the compositional profiles in each case. (a) A plagioclase crystal of composition plag 1 grows from melt 1 under one particular set of conditions. (b) The crystal is transferred by magma mixing to another melt, melt 2, and is overgrown by plagioclase of composition plag 2 in equilibrium with melt 2. (c) If the crystal then sits in melt 2 for long enough, diffusion will tend to smooth out the compositional step between the two crystal zones. Major element diffusion in plagioclase (the exchange CaAl – NaSi) occurs very slowly on geological timescales, so that primary zoning of An content is nearly always preserved40. However, some trace elements diffuse fast enough in plagioclase to generate measurable intracrystalline diffusion gradients7. Slow-moving trace elements preserve primary values, and can be used to calculate the compositions of melts 1 and 2. Diffusion gradients generated by relatively fast-diffusing elements can be used to estimate the time between stages b and c in the diagram. Both approaches are exploited in this study.
Figure S3 : Core-to-rim profiles of An content in the twelve representative plagioclase crystals shown in Fig. S2. The profiles were analysed by electron microprobe.
Figure S4 . Summary of magmatic processes and their time scales prior to the Minoan eruption, as determined from crystal zoning data, models, and other geological observations.
Figure S5: Explanation of the two modelling approaches taken in the study, using as example crystal S82-30A 12. (a) One-step diffusion model for Mg at 900 °C using a distance increment of 4.1 µm. The circles are the measured profile. The blue line is the estimated initial profile (with 1 σ error range), the green line is the equilibrium profile, and the red line is the model. A 1-step model at 900 °C gives a poor fit at about 47 years for the whole crystal. (b) The 2-step model, involving exchange between the calcic inner-core and the core at 900 °C (70 years) followed by exchange between the inner-core, core and rim at 855 °C (12 years), gives a much better fit. We also tried with three steps, but the fit did not improve and the time did not change.
Figure S6. Plagioclase zoning patterns of natural crystals7,39,40 show that Mg is more equilibrated than Sr at all anorthite contents. This requires that DMg>DSr for all An. In the above plot we show that the minimum slope that
characterises the dependence of the DMg with An is bounded by the experimental data for Mg of ref. 28 and that for
Sr of ref. 29. Using this minimum slope we obtain times that are only about a factor of 2 to 3 longer than those we report in Table 1.
2. Supplementary Tables
Table S1. Trace element contents of Minoan plagioclase phenocrysts
Pumice Crystal Distance An Mg K Ti Sr Ba La Ce
from rim (µm) (mol %) (ppm) (ppm) (ppm) (ppm) (ppm) (ppm) (ppm)
S82-11D A6 9 40.2 155 2293 108 435 224 9.03 8.86 31 41.3 158 2181 123 450 198 8.02 7.94 47 46.3 170 1917 135 470 163 7.28 6.46 71 46.6 183 1780 144 473 141 6.44 6.16 94 46.7 193 1774 149 491 136 6.13 5.84 111 47.1 206 1767 154 497 128 5.97 5.87 137 45.8 213 1892 161 499 131 6.02 5.97 158 47.9 202 1719 159 489 129 5.91 5.91 163 48.3 197 1655 151 499 126 6.13 5.65 182 51.8 187 1582 147 491 116 5.35 5.23 220 47.6 191 1647 147 501 119 5.54 5.09 246 51.2 186 1542 171 503 107 5.04 5.08 260 52.7 181 1446 183 491 102 4.80 4.43 340 63.9 158 1503 187 474 71 2.59 2.66 404 69.0 179 1208 170 470 69 2.91 2.90 416 65.0 165 1411 156 454 89 3.95 3.46 S82-11D A5 5 49.9 233 1406 119 522 152 8.28 7.94 48 50.7 226 1453 115 519 162 8.29 7.71 117 47.9 212 1577 119 507 150 6.91 6.87 194 50.8 212 1429 129 482 147 6.47 7.45 231 41.5 204 2049 105 480 201 8.50 8.65 291 50.3 221 1735 111 509 152 7.76 7.92 377 50.1 214 1522 118 520 157 8.35 8.27 S82-34B A2 12 34.8 133 2987 100 431 344 9.63 8.24 27 34.7 134 3066 106 442 349 9.95 8.65 51 35.8 142 2954 112 456 383 9.60 8.52 77 38.0 141 2923 111 451 379 9.50 8.43 92 37.7 148 2711 113 445 305 9.95 8.75 111 39.8 155 2427 111 444 254 9.60 8.30 128 39.4 150 2484 129 499 342 10.48 9.08 142 46.1 162 1819 140 542 179 7.76 7.04 154 47.8 181 1685 151 555 167 7.17 6.88 171 52.5 197 1549 148 540 126 6.51 6.07 176 50.1 182 1827 128 531 185 8.88 8.82 229 52.8 230 1470 176 587 143 5.80 5.80 275 52.8 217 1226 182 577 105 5.44 4.58 S82-30A B5 5 37.3 130 2691 105 431 268 9.80 9.87 16 37.3 137 2563 106 431 263 8.93 8.84 24 37.5 142 2441 104 425 248 8.43 8.98 41 38.9 146 2429 105 428 245 9.77 9.39 59 39.3 149 2360 102 428 241 9.03 9.01 78 38.6 145 2481 104 430 246 8.71 8.55 97 38.9 149 2355 104 416 230 8.59 8.49 122 39.6 149 2361 105 422 235 8.96 8.21 157 36.2 144 2737 108 412 251 8.57 8.20 211 38.1 149 2565 130 422 243 8.65 8.37 230 39.0 153 2311 105 413 230 8.52 8.90 246 39.8 158 2322 108 403 244 9.32 9.48 273 29.4 155 3746 114 393 322 11.15 10.64 302 32.1 161 2854 118 430 272 10.05 9.77 359 43.2 165 2063 116 485 198 8.10 7.33 S82-30A 12 21 36,6 133 2741 117 416 285 8,33 12,02 38 39,3 130 2418 107 400 257 7,70 7,55 54 37,7 129 2420 99 401 249 6,12 9,69 71 39,7 120 2362 136 483 256 8,51 6,58 87 47,4 131 1997 136 548 255 5,69 8,16 103 46,4 149 1737 155 592 194 5,99 7,25 120 48,4 150 1860 139 626 194 4,35 7,09 136 52,9 154 1567 150 575 167 3,77 6,06 153 51,9 146 1340 185 521 117 2,22 4,85 169 74,6 136 718 168 465 48 2,11 3,07 185 70,2 141 804 181 446 72 2,18 3,45 202 72,9 149 816 142 416 59 4,12 5,84 218 81,7 118 360 74 1,83 3,33 235 80,1 320 49 3,44 5,22 251 80,3 179 655 112 375 42 1,19 2,85 267 76,2 98 560 105 374 28 1,40 1,50 R2C B3 21 39,4 148 2380 122 434 242 7,23 10,53 35 40,3 143 2583 96 415 225 6,71 10,52 49 39,0 137 2489 102 402 232 7,11 64 40,3 135 2654 105 419 246 8,36 8,73 78 39,9 147 2442 102 410 261 5,85 9,78 92 39,4 155 2554 113 418 233 5,48 9,00 106 39,4 158 2599 95 412 248 7,52 8,88 120 35,6 130 2865 120 406 245 5,53 7,80 134 63,1 112 1351 140 358 121 3,68 4,24 148 71,5 106 872 195 380 76 2,02 1,83 163 73,8 100 649 174 360 35 0,00 0,53 177 73,7 114 793 161 366 36 0,55 0,60 191 76,7 120 757 148 363 26 0,52 1,13 205 70,5 123 827 212 388 21 0,57 1,24 219 75,9 127 780 144 344 23 0,58 1,27 233 75,2 106 762 174 340 39 0,40 0,44 247 73,1 116 841 150 354 39 0,77 0,28
Table S2. Trace element contents of Minoan glasses
* from electron microprobe analysis
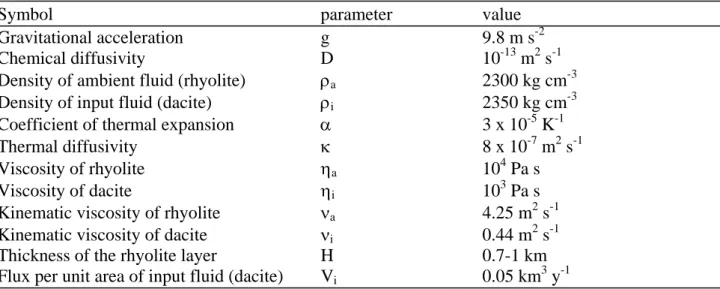
Table S3. Parameters used in the calculations of mixing time and efficiency
Symbol
parameter
value
Gravitational
acceleration
g
9.8
m
s
-2Chemical
diffusivity
D
10
-13m
2s
-1Density of ambient fluid (rhyolite)
ρ
a2300 kg cm
-3Density of input fluid (dacite)
ρ
i2350 kg cm
-3Coefficient of thermal expansion
α
3 x 10
-5K
-1Thermal
diffusivity
κ
8 x 10
-7m
2s
-1Viscosity
of
rhyolite
η
a10
4Pa s
Viscosity of dacite
η
i10
3Pa s
Kinematic viscosity of rhyolite
ν
a4.25 m
2s
-1Kinematic viscosity of dacite
ν
i0.44 m
2s
-1Thickness of the rhyolite layer
H
0.7-1 km
Flux per unit area of input fluid (dacite)
V
i0.05
km
3y
-1Pumice Crystal SiO2 Mg K Ti Sr Ba La Ce
(wt %)* (ppm) (ppm) (ppm) (ppm) (ppm) (ppm) (ppm) Interstitial glasses S82-30A A4 73.9 1876 28153 1802 74 679 28.5 48.3 S82-30A A4 73.6 1858 28317 1807 72 616 27.0 44.4 S82-30A 12 74.5 2786 22627 2070 84 566 38.4 57.2 S82-34B A8 74.2 1308 26992 1528 85 606 30.8 53.3 S82-34B A9 73.9 1624 29522 1737 69 678 32.4 59.0 R1C 4 74.8 1633 32002 1879 76 656 30.5 55.7 R1C 4 74.3 1713 27953 1086 65 596 29.6 48.6 R1C 27 74.3 1747 26205 1567 54 524 28.8 53.0 R1C 27 74.3 2169 26100 1100 62 521 27.7 54.4 R2C B3 74.3 1712 30888 1906 65 654 25.1 47.6 S82-11D D1 74.3 2809 32132 1944 84 657 31.0 60.1 Glass inclusions S82-30A 3 72.7 2029 29510 2024 61 594 29.2 53.3 R1C 3 73.0 2003 34822 1228 75 712 33.1 67.3 R1C 3 75.6 1688 32135 1226 71 640 29.6 56.0 R1C 17 73.4 2050 29243 859 70 642 32.8 64.0 R1C 17 75.3 1736 27865 1871 62 642 25.5 74.5 R1C 27 75.6 1892 26597 702 58 521 32.2 50.2 R1C 27 75.0 1826 27950 1640 61 533 33.3 43.4 S82-34B 11 71.2 2141 30500 1998 80 615 40.3 55.8 S82-34B 11 71.2 2220 30500 2042 81 620 40.9 57.9 S82-34B 11 72.4 2263 32183 2073 80 626 41.5 57.0 S82-34B 11 72.4 2320 31098 2487 79 635 40.1 55.8 S82-11D A5 72.7 4202 26205 2686 51 596 37.0 55.8 S82-11D A5 72.7 4091 30050 2808 57 816 52.6 68.7 S82-11D A5 72.7 4246 30643 2745 62 847 52.8 70.9 S82-11D A5 71.4 4250 31320 2656 85 840 52.8 68.5 S82-11D A5 71.4 4341 31320 2656 86 864 55.2 68.9
3. Supplementary Discussion
Evidence for the dacitic magma component
A key feature of our interpretation is that the cores of the type-1 plagioclase crystals crystallized from dacitic magma on the timescales given by our diffusion modelling. An alternative possibility is that they (and the included calcic inner cores) were recycled from old plutonic mush in which they had been stored for long times at temperatures sufficiently low to prevent re-equilibration of trace elements. Defrosting of pre-existing bodies of plutonic mush by intrusion of hotter magma has been postulated as an important process for generating eruptions of crystal-rich intermediate to silicic magmas41-43. In this hypothesis our decadal timescales would record the duration of defrosting of the mush6,44,45 prior to eruption. However, we do not favour this hypothesis, for the following reasons. First, crystals in the Minoan magma occur individually, and crystal clusters expected to form by disaggregation of low-temperature mush are rare. Second, the presence of euhedral, rimless type 1 crystals (with the same An contents as the cores of the rimmed type-1 crystals) strongly suggests that dacitic magma was present in the Minoan plumbing system at a late stage prior to eruption. Third, the Minoan magma contains only ~10 vol% crystals, so a very large degree of remelting would be required to generate it by reactivation of a low-temperature mush. Fourth, discharge of dacitic immediately followed the Minoan eruption in the form of the postcaldera lavas13,16,46.
Identities of the dacitic and rhyolitic magmatic components
The dacite is inferred to have been a vanguard batch of the magma discharged during the postcaldera eruptions16,46, for the following reasons. First, plagioclase phenocrysts in the postcaldera lavas have the same ranges of An and Sr contents as the cores of the Minoan type-1 crystals (Fig. 1g). Second, the 87Sr/86Sr ratios of the interiors of the Minoan plagioclases are lower than those of Minoan glass15, but are overlap with those of the postcaldera lavas16. Third, the postcaldera magma was erupted immediately following the Minoan eruption, showing that it was available at depth in the plumbing system. We interpret the postcaldera activity as the continuation of an event of magma transfer from depth that preceded, and perhaps initiated, the Minoan eruption.
The identity of the rhyolitic component is less tangible. No lavas, and no layers of silicic pumice, are preserved between the Minoan products and those of the preceding large explosive eruption of Santorini (22 ka)13. The only pyroclastic unit is a small scoria fall deposit32. Despite detailed sampling, we have not found any blocks of lava in the Minoan deposits that could be samples of extruded pre-Minoan rhyolite. We believe the rhyolite to be possibly related to a suite of crystal-rich pumices and plutonic nodules that are a volumetrically minor (typically a few %) component of the Minoan deposits13. They are concentrated in the Plinian fall deposit of the first eruptive phase, but were also discharged in trace quantities in the other three phases. They have whole-rock silica contents ranging from 53 to 63 wt %, crystal contents from 55 to >95 vol%, and rhyolitic (72-77 % SiO2) interstitial glass. The mineral assemblage is plagioclase, orthopyroxene,
clinopyroxene, magnetite, and some samples also contain ilmenite and hornblende. Touching pairs of Fe-Ti oxides yield26,27 temperatures of 770-830 °C and fO2 ~NNO. The high Ba contents and
87
crystal-rich pumices and plutonic nodules rule out that they formed by crystal accumulation from Minoan rhyodacite13,15. They are interpreted as samples of the crystalline carapaces of one or more bodies of cool, oxidized, and crustally contaminated rhyolite that were present in the upper crust beneath Santorini prior to the Minoan eruption. We speculate that intrusion and mixing of dacite into these rhyolitic bodies on the timescales described in this paper led to the formation of the large, shallow14 reservoir of hybrid rhyodacite that was then discharged during the Minoan eruption. The dacitic magma could have been derived by rapid draining from a plexus of long-lived storage zones in a mushy pluton deeper in the crust.
Mixing proportions of the silicic magmas
The mixing proportions of dacite and rhyolite in the Minoan magma can be estimated approximately using the Srmelt values of Fig. 3d for the three different components (dacite 110-170 ppm, rhyolite 40-60
ppm, hybrid rhyodacite 60-90 ppm). Taking extreme values, simple mass balance yields a proportion of dacite ranging from 15 to 40 %, which, for a total rhyodacite volume of 40-60 km3 (ref 4), corresponds to a volume of the dacitic mixing component of 5-25 km3.
This estimate is broadly consistent with the abundance of dacite-derived plagioclase (cores of the type-1 crystals) observed in the hybrid rhyodacite. The rhyodacite contains ~10 % crystals, of which ~7 % are plagioclase. Of this plagioclase, the dacite-derived cores account for very roughly half (Fig. 1g). Assuming that the intruding dacite contained between 10 % (plagioclase content of the postcaldera lavas16,17) and 50 % (roughly the maximum crystal content permitting flow), then simple crystal conservation places the percentage of the dacitic mixing endmember as 7-35 %, which is similar to range estimated above.
We conclude conservatively that perhaps a few km3 of dacite was injected into the Minoan reservoir during the ~100 years prior to eruption.
Fluid dynamic constraints on mixing timescales
The 40-60 km3 of Minoan magma is homogeneous in whole-rock composition (71-72 % SiO2), glass
composition (73-74 % SiO2), and Fe-Ti oxide temperature (853+12 °C), irrespective of eruptive phase. The
only heterogeneity we have found is a concentration of rimless type-1 crystals in pumices of eruptive phase 4. Clearly the mixing of dacitic and rhyolitic magmas inferred to have taken place on timescales ranging from ~10 years to a few months must have been very efficient to result in such homogeneity. We have therefore tested whether efficient mixing on these timescales is compatible with the physics of magma mixing, using the results of ref 47 to evaluate under what fluid dynamical conditions mixing is efficient between two fluids of different viscosities and densities. The two relevant non-dimensional variables in such a context are the Reynolds number (Re) and the ratio of the kinematic viscosities of input (νi) and ambient
(νa) magmas, U :
U = νa / νI [S1]
The relevant Reynolds number47 is: Re = B1/3 H 4/3/νa
viscosity. The buoyancy flux is calculated as:
B = gVi ( ρa-ρi) / ρa [S2]
where g is the gravitational acceleration, Vi is the flux per unit area of input fluid (dacite), ρa is the density of
the ambient fluid, and ρi the density of the input fluid. Values used for the calculations are listed in Table S3.
As with any mixing phenomenon, the viscosity contrast between the two fluids plays a key role. In our case, the viscosity of both fluids can be evaluated using petrological constraints on T-H2Omelt coupled to
viscosity models48. Mineral thermobarometry46 and phase equilibrium constraints available for similar compositions49,50 show that the intruding dacite was at 900-950°C and contained ~4 wt% dissolved H2O.
Application of viscosity models yields a dacite melt viscosity (ηi) around 10 3
Pa s. For the rhyolite end-member we lack precise melt compositions, but we assume a melt with 71-72 wt% SiO2 and 5-6 wt% water.
The crystal-poor character of the resulting hybrid rhyodacite dictates that both mixing components were also crystal-poor, which implies a temperature of ~830°C for the rhyolite. This in turn yields a viscosity of about 104 Pa s for the rhyolite (ηa), in agreement with previous work for other silicic arc magmas51. Thus, the ratio
of kinematic viscosities U was less than 10. Calculation of the convective Reynolds number gives a value of 750. Note that we use a magma flux of 0.05 km3/year, which is a conservative estimate; increasing the flux by 1-2 order of magnitude will increase the Re well beyond 1600. These two parameters indicate a mixing efficiency higher than 0.95, following the results of ref 52 (perfectly mixed systems having a value of unity), which shows that the system was thoroughly stirred, in agreement with the homogeneous character of the rhyodacitic magma ultimately erupted.
The mixing timescale can be inferred from published numerical simulations53,54. The relationships between strain rate ε, the layer thickness H across which convective motions occur, and the mixing timescale, Tm, are:
Tm = (1/2ε) log (εH 2
/D) [S3]
where D is the chemical diffusivity of interest (taken here to be that of Si, one of the slowest diffusing species in silicate melts). The strain rate is given by:
ε = (0.023 κ/H2
) Ra 0.685 [S4]
where κ is the thermal diffusivity, and Ra the thermal Rayleigh number defined as :
Ra = (ρa α ΔT g H3 )/ (κ ηa) [S5]
where α is the coefficient of thermal expansion of the fluid, ΔT the temperature gradient across the fluid layer of thickness H, and ηa the viscosity of the ambient fluid.
The effective thickness of the rhyolite can be estimated from the caldera area (~60 km2) and magma volume (40-60 km3)4, which imply a thickness in the range 0.7-1 km. Using standard values for the input parameters (Table S3), such a range in thickness yields Rayleigh numbers in the range 1011–1012 for a temperature drop ΔT of 10°C across the layer. This implies stirring times of less than 1 year, and possibly as short as 1 month (see also ref 54). Hence it appears that the physical estimate of the timescale of mixing is compatible with those inferred on petrological grounds. The efficiency of mixing at Santorini was greatly
facilitated by the near-liquidus nature of both magmas, as well as by the small difference in their respective viscosities.
Accommodation of the recharge volume
The intrusion of a few km3 of magma into a shallow subvolcanic reservoir over about 100 years raises the question of how the volume was accommodated and what the surface manifestations and geophysical signals would have been. If accommodation took place purely through uplift, then huge surface deformations would be predicted. Assuming that the reservoir underlay the entire ~60 km2 caldera, injection of a few km3 of magma in a century would require surface uplift of several tens of metres, at rates approaching 1 m per year sustained for several decades, which is very large compared to historical rates of uplift at restless calderas2,3. For example, the uplift rate at Campi Flegrei between July 1982 and January 1985 reached 0.5 m/y, but was sustained for only two and a half years. Vertical uplift has been sustained for 700 years at Iwa Jima caldera, but at a mean rate of only 0.15-0.2 m/y2. Another possibility is that some, or most, of the volume increase was accommodated by subsidence of the magma reservoir floor. Many granite plutons exhibit evidence for vertical growth by floor subsidence, either on faults or by downsagging18,19,55. Floor subsidence would compensate for rapid transfer of large volumes of magma from deeper in the crust, and could be essentially aseismic if faulting occurs beneath the brittle-ductile crustal transition or in plutonic mush19. Whether large surface uplifts and strong seismicity would necessarily have accompanied the pre-Minoan recharge events postulated at Santorini is in our opinion an open question. Archaeological evidence on Santorini has shown that seismic activity preceded the Minoan eruption by a few years to a few months56,57, but it is not possible to say whether this had any causal relationship to the recharge events documented in this paper.
References
40. Grove T.L., Baker, M.B. & Kinzler R.J. (1984) Coupled CaAl-NaSi diffusion in plagioclase feldspar: experiments and applications to cooling rate speedometry. Geochim. Cosmochim. Acta. 48, 2113-2121 (1984).
41. Nakamura, M. Continuous mixing of crystal mush and replenished magma in the ongoing Unzen eruption. Geology 23, 807-810 (1995).
42. Murphy, M.D., Sparks, R.S.J., Barclay, J., Carroll, M.R. & Brewer, T.S. Remobilization of andesite magma by intrusion of mafic magma at the Soufriere Hills Volcano, Montserrat, West Indies. J. Petrol.
41, 21-42 (2000).
43. Bachmann, O, Dungan, M.A. & Lipman, P.W. The Fish Canyon magma body, San Juan volcanic field, Colorado: Rejuvenation and eruption of an upper crustal batholith. J. Petrol. 43, 1469-1503 (2002). 44. Bachmann, O. & Bergantz, G.W. Gas percolation in upper-crustal silicic crystal mushes as a mechanism
for upward heat advection and rejuvenation of near-solidus magma bodies. J. Volcanol. Geotherm. Res.
149, 85-102 (2006).
45. Huber, C., Bachmann, O. & Dufek, J. The limitations of melting on the reactivation of silicic mushes. J. Volcanol. Geotherm. Res. 195, 97-105 (2010).
46. Barton, M. & Huijsmans, J. Post-caldera dacites from the Santorini volcanic complex, Aegean Sea, Greece: an example of the eruption of lavas of near-constant composition over a 2,200 year period. Contrib. Mineral. Petrol. 94, 472-495 (1986).
47. Jellinek, A.M., Kerr, R.C. & Griffiths, R.W. Mixing and compositional stratification produced by natural convection. 1. Experiments and their applications to Earth’s core and mantle. J. Geophys. Res.
48. Giordano D., Russell J.K. & Dingwell D.B. Viscosity of magmatic liquids: a model. Earth Planet. Sci. Lett. 271, 123–134 (2008).
49. Scaillet, B. & Evans, B.W. The 15 June 1991 eruption of Mount Pinatubo. I. Phase equilibria and pre-eruption P-T-ƒO2-aH2O. J. Petrol. 40, 381-411 (1999).
50. Costa, F., Scaillet, B. & Pichavant, M. Petrological and experimental constraints on the pre-eruption conditions of Holocene dacite from Volcán San Pedro (36ºS, Chilean Andes) and the importance of sulphur in silicic subduction-related magmas. J. Petrol. 45, 855-881 (2004).
51. Scaillet, B., Holtz, F. & Pichavant, M. Phase equilibrium constraints on the viscosity of silicic magmas 1. Volcanic-plutonic comparison. J. Geophys. Res. 103, 27,257-27,266 (1998).
52. Jellinek, A.M. & Kerr, R.C. Mixing and compositional stratification produced by natural convection. 2. Applications to the differentiation of basaltic and silicic magma chambers and komatiite lava flows, J. Geophys. Res. 104, 7203-7218 (1999).
53. Coltice, N. & Schmalzl, J. Mixing times in the mantle of the Earth derived from 2-D and 3-D numerical simulations of convection. Geophys. Res. Lett. 33, doi : 10.1029/2006GL027707 (2006).
54. Huber, C., Bachmann, O. & Manga, M. Homogenization processes in silicic magma chambres by stirring and mushification (latent heat buffering). Earth Planet. Sci. Lett. 283, 38-47 (2009).
55. Cruden, A.R. On the emplacement of tabular granites. J. Geol. Soc Lond. 155, 853-862 (1998). 56. Doumas, C. Thera. Pompeii of the ancient Aegean. Thames and Hudson, 168pp (1983).
57. Marthari, M. The Destruction of the Town at Akrotiri, Thera, at the Beginning of LC I: Definition and Chronology. In The Prehistoric Cyclades (eds McGillivray, J.A & Barber, R.L.N), 119-133 (Dept. Classical Archaeology, Edinburgh, 1984).