HAL Id: hal-00959102
https://hal.archives-ouvertes.fr/hal-00959102
Submitted on 17 Mar 2014
HAL is a multi-disciplinary open access archive for the deposit and dissemination of sci-entific research documents, whether they are pub-lished or not. The documents may come from teaching and research institutions in France or abroad, or from public or private research centers.
L’archive ouverte pluridisciplinaire HAL, est destinée au dépôt et à la diffusion de documents scientifiques de niveau recherche, publiés ou non, émanant des établissements d’enseignement et de recherche français ou étrangers, des laboratoires publics ou privés.
Cole-Cole distribution of relaxation times
André Revil, Paul Leroy, Ahmad Ghorbani, Nicolas Florsch, A.R. Niemeijer
To cite this version:
André Revil, Paul Leroy, Ahmad Ghorbani, Nicolas Florsch, A.R. Niemeijer. Compaction of quartz sands by pressure solution using a Cole-Cole distribution of relaxation times. Journal of Geophysical Research, American Geophysical Union, 2006, VOL. 111, pp.Issue B9. �10.1029/2005JB004151�. �hal-00959102�
Compaction of quartz sands by pressure solution
using a Cole-Cole distribution of relaxation times
A. Revil,1 P. Leroy,1 A. Ghorbani,2 N. Florsch,2 and A. R. Niemeijer3 Received 7 November 2005; revised 6 May 2006; accepted 5 June 2006; published 19 September 2006.
[1] Stressed water-infiltrated silica rocks may deform by pervasive pressure solution
transfer (PPST), which involves dissolution of the grain-to-grain contacts, transport by diffusion of the solute, and precipitation on the free surfaces of the grains. A fundamental question regarding this process is how to model rheological behavior at stresses and temperatures typical of the crust of the Earth. A Voigt-type poroviscoplastic model is modified by using a Cole-Cole distribution of relaxation times rather than a Dirac distribution used previously. The motivation of this choice is to account for
the distribution of the grain size in the compaction of the porous aggregate assuming that this distribution obeys approximately a log normal distribution. This grain size distribution depends upon the initial grain size distribution and cataclasis in the early stage of compaction. We compared this modified viscoplastic model with the full set of
experimental data obtained in various conditions of mean grain size, effective stress, and temperature by Niemeijer et al. (2002). These data provide tests of all aspects of the model, which can be considered to have no free parameters. We show the experiments of Niemeijer et al. (2002) on PPST are primarily diffusion-limited. The grain size
distributions observed for three samples imply that the distribution of the relaxation time covers 5 orders of magnitude in grain size.
Citation: Revil, A., P. Leroy, A. Ghorbani, N. Florsch, and A. R. Niemeijer (2006), Compaction of quartz sands by pressure solution using a Cole-Cole distribution of relaxation times, J. Geophys. Res., 111, B09205, doi:10.1029/2005JB004151.
1. Introduction
[2] Pervasive pressure solution transfer (PPST) describes
the irreversible compactional process of mass transfer in rocks in response to stress and temperature fluctuations [e.g., Rutter, 1976, 1983; Niemeijer and Spiers, 2002;
Skvortsova, 2004, and references therein]. Other mechanism
of deformation are possible like those associated with micro-cracking [Karner et al., 2003]. PPST is associated with stress concentration at grain-to-grain contacts increasing solubility of the solid in the pore fluid, diffusion of the solute along grain-to-grain contacts, and precipitation on free faces of the grains. The understanding of PPST can lead to the under-standing of locking/unlocking processes that affect granular gouge of active faults during the tectonic cycle (see recent papers by Monte´si [2004] and Yasuhara et al. [2005]) and compaction of quartz sands in sedimentary basins [e.g.,
Wahab, 1998]. In addition, PPST could explain soft creep
rheology observed in the brittle-ductile transition zone of the crust and within the seismogenic crust itself [Ivins, 1996].
[3] For quartz sands, several research scientists have
modeled pressure solution using a Newtonian viscous law [e.g., Rutter, 1976, 1983; Dewers and Hajash, 1995;
Renard et al., 1997; Yang, 2000; He et al., 2002, 2003].
In contrast, Stephenson et al. [1992] described the occur-rence of PPST of quartz sands in sedimentary basins, over long periods of time, as being a purely plastic compaction.
Revil [1999] proposed a unified model, which takes the
form of a poroviscoplastic (Voigt-type) linear model with a single relaxation time associated with the mean grain size of the porous medium (Figure 1). The microscopic reasons for this behavior were explored by Revil [2001], who proposed the existence of a stress threshold at the grain-to-grain contact below which PPST stops. Additional evidences in favor of this model were recently presented by Yasuhara et al. [2003, 2004, 2005] and Alcantar et al. [2003]. Implications of this model for travelling solitary waves were explored by Yang [2002]. However, there is the need to test further the validity of the model for a wide range of mean grain sizes, temper-ature, and effective stresses and to incorporate in this model a wider grain size distribution than just using a single value for the grain size.
[4] In section 2, the model of Revil [1999] is modified to
account for the distribution of grain size in the rheological model. To reach this goal, we use a Cole-Cole distribution of relaxation times (rather than a single value) in the viscoplastic response of the porous aggregate. This is equivalent to assuming that the grain size distribution obeys a log normal distribution. The model of Revil [1999] is also modified to
Here
for
Full Article
1Department of Hydrogeophysics and Porous Media, CNRS-CEREGE,
University Paul Ce´zanne-Aix-Marseille III, Aix-en-Provence, France.
2Department of Applied Geophysics, University Paris VI, Paris, France. 3
High Pressure and Temperature Laboratory, Faculty of Geosciences, Utrecht University, Utrecht, Netherlands.
Copyright 2006 by the American Geophysical Union. 0148-0227/06/2005JB004151$09.00
account for the nonlinear behavior of the deformation/ effective stress constitutive law observed at high effective stresses (section 3). Despite the fact that this modification changes the results little at effective stress conditions pre-vailing in the upper crust of the Earth, it seems to us important to extend our model to a wide range of T-P conditions. In section 4, a nonlinear optimization scheme based on the Simplex algorithm is used to compare the compactional model to all the experimental data of Niemeijer et al. [2002]. Niemeijer et al. [2002] presented a unique series of experimental data in which they investigated the influence of temperature (in the range 400 – 600!C), effective stress (in the range 50 – 150 MPa), and mean grain size (10 – 86!m) upon the compactional response of several quartz aggregates. In addition, the grain size distributions resulting from the compaction process and cataclasis was measured by
Niemeijer et al. [2002] for three samples, spanning over
2 orders of magnitude in grain size. Consequently, these data offer a unique opportunity to test our compaction model. [5] Five predictions made by our model are tested for the
first time in this paper: (1) The plastic limit of the compac-tional response of the porous aggregate is independent of the mean grain size of the aggregate. (2) The temperature dependence of the (long-term or plastic) compaction coef-ficient can be determined using an Arrhenius law. (3) The mean relaxation time of the viscoplastic model can be
described (within a factor 2) using the mean grain diameter of the aggregate and temperature. (4) The relaxation time distribution (RTD) can be directly related to the particle size distribution (PSD) assuming a log normal distribution for the latter; the model should be flexible enough to incorporate other PSDs. (5) The same compactional model can be used to explain the full range of data obtained by Niemeijer et al. [2002] including the short-term viscous behavior and the long-term plastic limit.
2. Theoretical Background
2.1. Debye Distribution of Relaxation Times
[6] We make the following assumptions: (1) the rock is
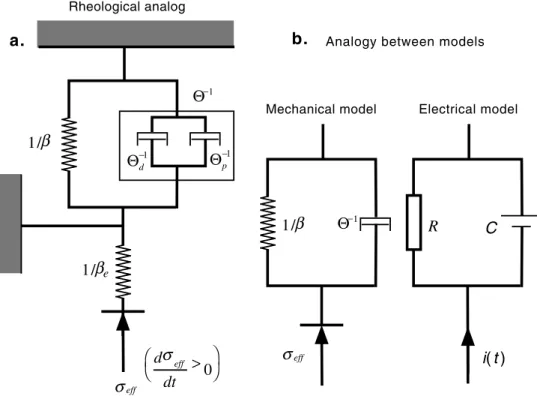
an isotropic granular material, (2) the mineral of the granular aggregate is silica, and (3) in this section the grain size Figure 1. Sketch of the compactional model. (a) The deformation of a representative elementary volume
of quartz sand follows a linear poroviscoplastic (Voigt-type) rheological behavior. The springs in parallel with the dashpot represent the plastic (thermostatic) equilibrium state, whereas the dashpots represent the kinetics of PPST at the grain-to-grain contacts (the dashpots ‘‘p’’ and ‘‘d’’ correspond to dissolution/ precipitation chemistry and diffusion-limited processes, respectively) (modified from Revil [2001]). An additional spring models the poroelastic response of the medium. (b) Analogy between a Voigt-type viscoplastic model (a dashpot in parallel with an anelastic spring) and an electrical circuit in which a resistor (R is the resistance) is in parallel with a capacitor (C is the capacitance). Such an electrical model is classically used to model the induced polarization response of water-saturated porous rocks.
Table 1. Temperature Dependence of Model Parametersa
Parameter Temperature Dependence}=}0exp(!E}/RT)
Solubility C0= 67.6 kg m!3(1) EC= 21.7 kJ mol!1(1) Diffusivity D0= 5.2" 10!8m2s!1(2) ED= 13.5 kJ mol!1(2) Rate constant k+ 0 = 31.3 mol m!2s!1(3) Ek= 71.3 kJ mol!1(3) Compressibility "0= 2.6" 10!8Pa!1(4) E"= 17 kJ mol!1(4) aNotes: 1, Iler [1979]; 2, Revil [2001]; note for comparison, Dewers and
Ortoleva [1990] used D0# 1 " 10!8m2s!1and ED= 40 kJ mol!1while Nakashima [1995] used ED= 15 kJ mol!1; 3, Dove and Crerar [1990]; 4
distribution obeys a delta (Dirac) distribution with d0 the
mean grain size. Under these assumptions and neglecting mechanical deformation (grain rearrangement [e.g., Revil et
al., 2002]), the compactional response of the porous
aggre-gate is described by the following linear constitutive law [Revil, 1999]: ~ # tð Þ ¼ " tð Þ 'd$effð Þt dt þ $effð Þ 't d" tð Þ dt ; ð1Þ ~ # tð Þ ) #ð 0! # tð ÞÞ=#0; ð2Þ " tð Þ ) " 1 ! exp !t=%½ ð 0Þ+; ð3Þ
where circled cross stands for the Stieltjes convolution product. In equations (1) – (3), t is time, "(t) is the time-dependent compressibility of the porous aggregate," is its long-term plastic compressibility (compaction coefficient), %0is the relaxation time,$eff=$! p is the effective stress,
$ is the confining pressure, p the pore fluid pressure, #(t) is porosity at time t, and #0 is the initial porosity at the
beginning of the PPST process. The origin of time coincides with the instant at which the material, in a relaxed reference state, is subjected to the application of effective stress. The
porosity#0is the porosity following the application of the
stress. So that the initial poroelastic compaction represents the starting reference state; initial poroelastic compaction is investigated in Appendix A. This elastic compaction process follows instantaneously the stress variations and is reversible. [7] The rock behavior is modeled to have memory of the
highest effective stress experienced by the grain-to-grain contact during its history because of the increase of the grain-to-grain contiguity associated with the compaction. The previous compactional response holds as long as
d$eff=dt, 0: ð4Þ
When the effective stress decreases, the deformation response follows essentially a poroelastic behavior corre-sponding to the relaxation of the elastic energy stored in the sample.
[8] The relaxation time in equation (3) is given by
(Figure 1a), %0¼ "=Q; ð5Þ Q!1¼ Q!1d þ Q !1 p ; ð6Þ Qd¼ 32W kbT ! " C!D &gd03 ; ð7Þ Qp¼ 3W2 kbTN ! " k þ d0 ; ð8Þ
where T is the temperature (in K), C (in kg m!3) is the solubility of the grain surface in the pore water solution in equilibrium with quartz at fluid pressure and temperature,! is the effective thickness of the diffusion pathways at the grain-to-grain contacts (#2 nm, see discussions by Revil [2001]), D (in m2s!1) is the diffusivity of silica at the grain-to-grain contacts, d0(in m) is the grain diameter, W is the
molecular volume of silica (3.77 " 10!29 m3), k+ is the
dissolution rate constant, kb is the Boltzmann constant
(1.381" 10!23J K!1),&gis the density of the grains, and N
is Avogadro’s number (6.02" 1023
mol!1). The numerical constants entering equations (7) and (8) and the temperature dependence of the various parameters involved in these equations are reported in Table 1.
[9] Revil [2001] showed that diffusion of the solute at the
grain-to-grain contacts is one or 2 orders of magnitude smaller than that in the bulk pore water. This was recently confirmed by laboratory experiments [e.g., Alcantar et al., 2003; Yasuhara et al., 2003, 2004]. In low-porosity shales and in compacted bentonites (both having small pore sizes),
Revil et al. [2005] and Leroy et al. [2006] reached similar
conclusions based on modeling of coupling phenomena that affects diffusion of ionic species in charged media.
[10] The model of Revil [1999] corresponds to a
Voigt-type linear viscoplastic model represented by a dashpot in parallel with an anelastic spring. From the perspective of the differential equation governing the system, the behavior is analogous to an electrical circuit formed by a resistor in Figure 2. Distribution of relaxation times P(s) where s)
ln(%/%0) for various values of the Cole-Cole exponent c. Note
that smaller values of the exponent corresponds to broader distributions of relaxation times. The case c = 1 yields a Dirac distribution. The case 0.5 - c - 1 is very similar to a Gaussian distribution. For c < 0.5, the Cole-Cole distribution has a longer tail than the Gaussian distribution.
parallel with a capacitor (Figure 1b). In this case, the relaxation time is given by a Dirac (delta) distribution and takes the discrete value %0. In the study of the induced
polarization of porous materials, this is known as a Debye relaxation or distribution.
2.2. Cole-Cole Distribution of the Relaxation Times [11] When the grain size distribution cannot be described
by a unique value, the relaxation time distribution (RTD) exhibited by the compactional response of a porous aggregate cannot be described by a single value of the relaxation time, hence by a Dirac distribution. If the effective stress variation follows a Heaviside (step) distribution, grain crushing asso-ciated with cataclasis in the first stage of deformation, increases the distribution of the grain size [e.g., Gratier et
al., 1999]. This distribution needs to be accounted for, at least
in a simple fashion, in the compactional law. Indeed, because relaxation times entering the compaction law are directly associated with the grain size distribution (equations (5) to (8)), a wide distribution of grain sizes implies a wide distribution of relaxation times. The inclusion of a realistic
RTD is especially important if the process is diffusion-limited because of the power law relationship relating the grain sizes and the relaxation times in that case (equations (5) and (7)). [12] In the study of the electrical properties of saturated
porous rocks, it is customary to represent broad distributions of relaxation times in the induced polarization of saturated rocks and soils with the so-called ‘‘Cole-Cole’’ distribution [see Cole and Cole, 1941; Taherian et al., 1990]. The Cole-Cole distribution is characterized by a single coefficient, c, that accounts for the broadness of the distribution of relax-ation times and therefore of the broadness of the distribution of the grain sizes [see Chelidze et al., 1977; Pelton et al., 1978; Chelidze and Gueguen, 1999; Kemna, 2000].
[13] Under the assumption that the distribution of
relax-ation times is represented by a Cole-Cole distribution, the compressibility of our rheological model becomes
" tð Þ ) "F t=%ð 0; cÞ; ð9Þ F tð=%0; cÞ ) 1 ! X1 n¼0 !1 ð Þn t %0 # $nc G 1ð þ ncÞ ; ð10Þ F tð=%0; cÞ ) X1 n¼1 !1 ð Þnþ1 t %0 # $nc G 1ð þ ncÞ ; ð11Þ
where G( ) is the gamma function defined by
G xð Þ ¼ Z1
0
ux!1e!udu ð12Þ
(x > 0). Note that the series development involved in equation (11) converges very slowly for t/%0> 10 and c < 1;
thus a significant number of terms is required for a good convergence of the series. In the case c = 1, we recover the Debye distribution F tð=%0;1Þ ) X1 n¼1 !1 ð Þnþ1 t %0 # $n G 1ð þ nÞ ; ð13Þ F tð=%0;1Þ ) 1 ! X 1 n¼0 !1 ð Þn t %0 # $n G 1ð þ nÞ ; ð14Þ F t %0 ;1 ! " ) 1 !X 1 n¼0 !t %0 # $n n! ¼ 1 ! exp ! t %0 ! " ; ð15Þ
as required for the internal consistency of the model. The RTD is given with the probability [Cole and Cole, 1941]
P sð Þ ¼ 1 2' ! "
sin 1½ð ! cÞ'+
cosh csð Þ ! cos 1 ! c½ð Þ'+; ð16Þ
Figure 3. Long-term compaction coefficient " is deter-mined using the plastic equilibrium compactional response of the aggregates and optimization of the model parameters. The solid circles correspond to the data from Niemeijer et
al. [2002] (all runs). (a) The temperature dependence of the
compaction coefficient can be described using an Arrhenius’s law. (b) The compaction coefficient does not depend on the mean grain size. The thickness of the grey band represents the uncertainty in the determination of the compaction coefficient.
where s) ln(%/%0),% describes the distribution of relaxation
times and%0describes the peak of relaxation times given in
section 2.1. The peak of the RTD is associated with the peak
d0 of the grain size distribution and c characterizes the
broadness of the distribution. The probability distribution
P(s) has the property
Zþ1
!1
P sð Þds ¼ 1: ð17Þ
The Cole-Cole equation produces a very broad distribution of relaxation times when c is small (see Figure 2). For example for c = 0.25, 72 percent of the relaxation times are included in the range 10!3<%/%0< 103. When c is in the range 0.5 – 1, the
Cole-Cole distribution is quite similar to a log normal distribution. However, the Cole-Cole distribution has a longer tail than the log normal distribution when c is less than 0.5. The parameter c introduced in our model is not just a curve fitting parameter. It corresponds directly to the standard deviation of the logarithm of the grain size distribution assuming a log normal distribution. According to the dependence between relaxation times and the grain size (equations (5), (7), and (8)), the RTD can be compared directly with the particle size distribution (PSD).
[14] Some granular aggregates may exhibit RTDs that are
not described by the Cole-Cole distribution. In these cases, other types of distribution can be considered in our model. For example, the Cole-Davidson distribution [Davidson and
Cole, 1951] can account for nonsymmetrical PSD
distribu-tions of sediments or fault gouge. Using the properties of the convolution product, any distribution can be considered corresponding to a given grain size distribution. However, the mathematics are likely to become complex, and we will treat this elsewhere. In the present model, we show that the log normal PSD is a good approximation and therefore justifies the use of the Cole-Cole distribution.
3. Deviation From the Linear Model
[15] We now adapt the model of Revil [1999] to a wide
range of effective stresses. At high effective stresses (typi-cally, 100 MPa), the experimental data by Niemeijer et al. [2002] show a clear departure from the linear model proposed in section 2. In the case of these experimental data, the effective stress history is simply
$effð Þ ¼ $t effH tð Þ; ð18Þ
where H (t) is the Heaviside or step function (H (t) = 0 for
t < 0 and H (t) = 1 for t , 0) and $eff is the imposed
(constant) effective stress. Under this situation, the convolu-tion integral in equaconvolu-tion (1) yields the following linear compactional response # tð Þ ¼ #0 1! " tð Þ$effH tð Þ % & ð19Þ # tð Þ ¼ #0 1! " F t=%ð 0; cÞ$effH tð Þ % &: ð20Þ
Figure 4. Comparison of the model predictions and laboratory experiments for the long-term compactional response#1/#0of porous aggregates. (a) Test of the linear
relationship is shown. Note the discrepancy between the data and the model at high effective stresses. (b) Test of the exponential relationship is shown. The experiments cover a broad range of temperatures (400 to 700!C) and effective stresses (50 to 344 MPa) (solid circles, Niemeijer et al. [2002]; solid squares, Lockner and Evans [1995]). The final porosity is independent of the mean grain size. Indeed, the samples cover a broad mean grain size spectrum (from 5 to 85!m). The gray bands represent uncertainty in determina-tion of the porosity ratio.
Table 2. Conditions of the Experiments of Niemeijer et al. [2002]a
Run T, !C d,!m $eff, MPa #i
b #f c Cpf3 500 47.1 100 0.2731 0.1271 Cpf4 500 42.9 150 0.2350 0.1051 Cpf5 500 40.5 50 0.2612 0.1660 Cpf6 400 40.9 100 0.2514 0.1536 Cpf7 600 43.2 100 0.3138 0.0970 Cpf8 500 11.7 100 0.3108 0.1465 Cpf9 500 85.9 100 0.2451 0.1032 a
These experiments cover a wide range of effective stresses, temper-atures, and mean grain size.
b
Porosity at the beginning of the compaction process.
We show now that the previous equations can be modified to account for the observed nonlinear behavior of the compactional response at high effective stresses.
3.1. Long-Term Plastic Limit
[16] The long-term limit of the compactional response of
the porous aggregate corresponds to timescales for which the duration of the experiment is much larger than the peak of the distribution of the relaxation times. When t. %0, the
compactional response reaches a linear ‘‘plastic’’ limit [Stephenson et al., 1992]
#1=#0¼ 1 ! "$eff: ð21Þ
The term ‘‘plastic’’ means that the compactional response is irreversible and that time does not appear explicitly in the constitutive rheological law. Equation (21) is valid under the assumption that"$eff/ 1 [Revil, 2001] and a linearization of
the compaction law can be performed. However, experiments performed at high effective stresses show unambiguously that
there is a deviation from linearity [see, e.g., Niemeijer et al., 2002, Figure 2b]. We propose to correct this nonlinearity by replacing equation (21) with the plastic limit
#1¼ #0exp !"$eff
'
(; ð22Þ
which admits equation (21) as a limit when"$eff/ 1, so for
low effective stress levels (/100 MPa). Our choice of an exponential law is related to the exponential relationship between the solubility and the effective stress at the microscopic level.
[17] The first prediction of our model (prediction 1) is
that the poroplastic limit is independent of the grain size distribution of the quartz sand. This prediction is in agree-ment with the experiagree-mental data of Niemeijer et al. [2002, Figure 2d]. Indeed for experiments performed with a wide range of mean grain sizes, in the range 12 – 86!m (not to be misled with the grain size distribution of each sample), the compactional response#1/#0was observed for the narrow
range 0.40 – 0.48. Figure 3b shows that the compaction coefficient is independent on the mean grain size of the porous aggregates.
[18] The dependence of the compaction coefficient on
temperature is determined using an Arrhenius’s law for " (Table 1) (prediction 2). Note that" is inversely proportional to the critical stress $c, which defines the limiting stress
that grain-to-grain contacts can support without creeping [Stephenson et al., 1992; Revil, 2001]. A similar behavior could exist for tectonic faults. We expect that the critical stress scis temperature-dependent. Revil [1999] used a linear
dependence between this critical stress and the temperature. The dependence of the compaction coefficient" on temper-ature can be also fitted with an Arrhenius law. This Arrhe-nius law is calibrated against the data of Niemeijer et al. [2002]. The final result is shown in Figure 3a and is reported in Table 1.
[19] A comparison between the long-term linear
compac-tion law (equacompac-tion (21)) and the exponential law (equation (22)) (Figure 4) shows that the exponential law provides a better description of the experimental data in the plastic limit of compaction. As these experimental data cover a broad range of temperatures (400 to 700!C) and effective stresses (50 to 344 MPa), the exponential model is likely to be more appropriate than the linear model.
3.2. Short-Term Compaction
[20] As for the long-term limit of compaction, we have to
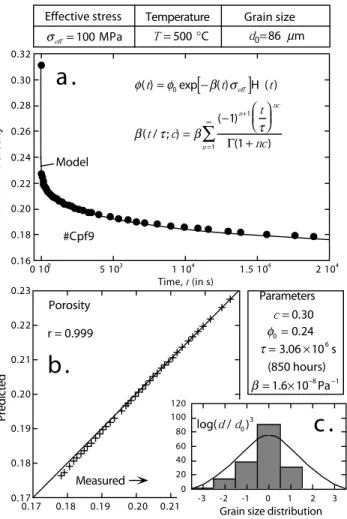
account for the nonlinear behavior discussed above for the Figure 5. (a) Compaction curve of a quartz aggregate in
the initial stage of deformation. Data are from Niemeijer et al. [2002] (run Cpf8, effective pressure: 100 MPa, mean grain diameter: 12 !m, effective stress 100 MPa, temperature 500!C, #i = 0.311). (b) Comparison between the predicted
porosity and the measured porosity is shown. (c) Comparison between the measured grain size distribution and that predicted using the Cole-Cole distribution (plain line) is shown.
Table 3. Model Prediction of Experiments of Niemeijer et al. [2002] Run Qp,aPa s!1 Qd,aPa s!1 Qd,aPa s!1 Limited Processb %0, c hours Cpf3 6.70" 10!14 1.20" 10!14 1.02" 10!14 DL 145 Cpf4 7.36" 10!14 1.59" 10!14 1.31" 10!14 DL 113 Cpf5 7.79" 10!14 1.89" 10!14 1.52" 10!14 DL 97 Cpf6 17.0" 10!14 9.32" 10!15 6.02" 10!15 DL 174 Cpf7 2.31" 10!13 2.58" 10!14 2.32" 10!14 DL 83 Cpf8 2.70" 10!13 7.83" 10!13 2.01" 10!13 DPL 7.4 Cpf9 3.67" 10!14 1.98" 10!15 1.88" 10!15 DL 788
aDetermined from equations (6), (7), and (8). b
DL, diffusion limited; DPL, dissolution/precipitation kinetics limited.
full compactional response following the application of the stress. Indeed, very high values for the effective stresses were used in the experiments described by Lockner and Evans [1995] and Niemeijer et al. [2002]. Therefore we replace equation (19) by
# tð Þ ¼ #0exp !" tð Þ$eff
%
&H tð Þ; ð23Þ
for t > 0. equation (23) admits equation (19) in the limit "$eff/ 1.
4. Comparison With Experimental Results
[21] We use all the experimental data by Niemeijer et al.
[2002] to test the compaction model developed above. Seven experiments were reported by Niemeijer et al. [2002] at various conditions of temperature, mean grain size, and effective pressure typical of the crust of the Earth. These conditions are reported in Table 2. Niemeijer et al. [2002] point out that an abrupt change in strain rate occurred, in all runs, after a few hours to#12 hours. They argue that this could be due to the fact that dissolved copper strongly hinders the dissolution rate of quartz and infiltration of dissolved copper from the cell into the samples during these experi-ments may have slow down compaction. However, such contamination is difficult to explain because the flux of water is outward from the samples during their compac-tion. Diffusion is a too slow process at this timescale
Table 4. Results of Inversion for Experimental Data of Niemeijer et al. [2002]a Run #0 c ","10!8Pa!1 Cpf3 0.276 ± 0.002 0.35 ± 0.01 1.80 ± 0.02 Cpf4 0.245 ± 0.002 0.31 ± 0.01 2.45 ± 0.01 Cpf5 0.266 ± 0.002 0.34 ± 0.01 1.95 ± 0.03 Cpf6 0.262 ± 0.002 0.28 ± 0.01 1.17 ± 0.03 Cpf7 0.313 ± 0.002 0.31 ± 0.01 2.45 ± 0.13 Cpf8 0.308 ± 0.004 0.29 ± 0.01 1.07 ± 0.04 Cpf9 0.256 ± 0.002 0.30 ± 0.01 2.53 ± 0.04
aThe reported values are the mean and twice the standard deviation of the
a posteriori distributions of the model parameters.
Figure 6. (a) Compaction curve of a quartz aggregate in the initial stage of deformation. Data are from Niemeijer et al. [2002] (run Cpf3, effective pressure 100 MPa, mean grain diameter 47 !m, effective stress 100 MPa, temperature 500!C,#i = 0.273). (b) Comparison between the predicted
and measured porosities is shown. (c) Comparison between the measured grain size distribution and that predicted using the Cole-Cole distribution (plain line) is shown.
Figure 7. (a) Compaction curve of a quartz aggregate in the initial stage of deformation. Data are from Niemeijer et al. [2002] (run Cpf9, effective pressure 100 MPa, mean grain diameter 86 !m, effective stress 100 MPa, temperature 500!C,#i= 0.24). (b) Comparison between the predicted and
measured porosities is shown. (c) Comparison between the measured grain size distribution and that predicted using the Cole-Cole distribution (plain line) is shown.
over the length of the sample to allow copper to infiltrate through its pore network. As shown below, there is no need of such an hypothesis to explain the shape of the compaction curves.
[22] There are also some controversies regarding the
relative roles of pressure solution versus cracking at grain-to-grain contacts. Cataclastic compaction by cracking that is fluid-assisted through reaction at the crack tip (and therefore thermally activated) can also be an important process of compaction, and the samples of Niemeijer et al. [2002] show abundant evidence of cracking. However, the high temper-atures of the Niemeijer et al. [2002] experiments would tend to favor pressure solution as the dominant mechanism of deformation.
[23] For t > 0, the nonlinear compactional law is written
explicitly as # tð Þ ¼ #0exp !"$eff X1 n¼1 !1 ð Þnþ1 t %0 # $nc G 1ð þ ncÞ 2 4 3 5: ð24Þ
[24] We first compare the prediction of this equation with
the experimental data in the early stage of compaction (see Figures 5 to 8) using the fitting algorithm described in Appendix B. In Figure 9, we plot the mean relaxation times %0determined by fitting equation (24) to the experimental
data as a function of the relaxation times derived indepen-dently, in Table 3, using equations (6), (7), and (8). There is Figure 8. Compaction curves of quartz aggregates in the initial stage of deformation. Data are from
Niemeijer et al. [2002]. The parameters given are fitted parameters, but their values are very close to
good agreement between the two estimates, so it follows that prediction 3 of the model is fine (the mean relaxation time of the viscoplastic model can be described (within a factor 2) using the mean grain diameter of the aggregate and temperature). Therefore, to diminish the number of fitting parameters when we consider all the experimental data, we use the value of the relaxation time%0directly inferred from
equations (6), (7), and (8).
[25] From the considerations given above, the parameters
to invert are {#0, ", c}. We use the inversion algorithm
described in Appendix B. The results of the inversion, for the full set of the experimental data, are reported in Table 4. The fitted porosity #0is very close to the initial porosity.
This is expected from the small contribution of the poroe-lastic contribution (see demonstration in Appendix A). The compaction coefficient increases with temperature accord-ing to the Arrhenius law (Figure 3a) and the range of values of the compaction coefficient is consistent with that reported by Revil [2001]. The value of c implies a broad relaxation time distribution in agreement with the observed PSD (Figures 5, 6, 7, and 8) and the fact that the process is diffusion-limited. Indeed, as shown in Table 3, the kinetics of the compaction experiments are limited by the diffusion of the solute species at the grain-to-grain contacts. This implies that the relaxation time is an function of the grain size with a power law exponent equal to three, in agreement with available data (see Figures 5c, 6c, and 7c). So prediction 4 of the model, stated at the end of section 1, is also checked.
[26] All the parameters involved in our compaction model
can be obtained independently. It follows that the only
factor that must be adjusted in our model is the Cole-Cole exponent. From the experiments made by Niemeijer et al. [2002], the Cole-Cole exponent falls in a narrow range
c = 0.30 ± 0.05. It follows that this range of values is
recommended to model pervasive pressure solution transfer in such materials. Additional experiments would be useful to test whether the parameter value c = 0.30 is universal. If so, our model has no free parameters. The compaction model with c = 0.30 and experimental data are compared in Figure 9 and Figure 10. The agreement between the model and the experimental data provides a test of prediction 5: the same compactional model can be used to explain the full range of data obtained by Niemeijer et al. [2002] including the short-term viscous behavior and the long-short-term plastic limit.
[27] If the grain size distribution evolves during
compac-tion, this implies that the value of c (that reflects the standard deviation of the lognormal distribution of the PSD) changes during the compaction. For example, if the grain size distri-bution appears more restricted at the end of the experiments than at the start of a run, this implies that the value of c increases during the experiment. Inversion for c, at different time steps, during compaction may be used to monitor the evolution of particle size distribution with time. This could be important for permeability modeling, for example, during fault zone healing (T. Dewers, personal communication, 2005).
5. Concluding Statements
[28] The model of Revil [1999] is modified using a
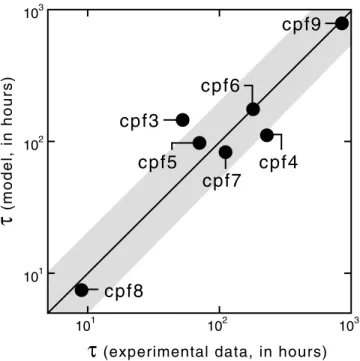
Cole-Cole distribution of relaxation times and nonlinear com-pactional law at high effective stresses. The Cole-Cole Figure 9. Comparison between the mean time%0constant
obtained by fitting the data to equation (24) (values reported in Figures 5 to 8) and the time constant determined independently from equations (5) to (8) and the values of parameters in the last column of Table 3. Cpfi corresponds to the experimental run ‘‘i’’. The grey band represents the uncertainty in determination of the mean relaxation time.
Figure 10. Test of the model for the effective stress. The compaction model is compared to compaction curves of three quartz aggregates, at the same temperature, but at different effective stresses (c = 0.30 and all the other parameters are determined from the equations developed in the main text and Table 1). Experimental data are from Niemeijer et al. [2002].
distribution is characterized by a single exponent c, which accounts for the distribution of the relaxation times. The case
c = 1 corresponds to a Dirac distribution, which is in turn
associated with a very sharp distribution of grain size (e.g., a Gaussian distribution with a very small variance). The use of a Cole-Cole response is intended to account for large grain size distributions in the compactional response of the porous aggregates. This modified model is compared to the exper-imental data obtained by Niemeijer et al. [2002] for which the grain size distributions cover more than 2 orders of magni-tude, resulting in part from cataclasis in the early stage of deformation. We find a good agreement between the predic-tion of the model and the experimental data with c = 0.30 ± 0.05. Because the kinetics of compaction are limited by diffusion (see Table 3), we expect that the RTD covers 5 – 6 orders of magnitude. This is in agreement with the previous value for the Cole-Cole exponent. Broad distribu-tions of grain size likely exist during natural compaction and deformation of fault gouge.
[29] This new model has important implications for the
dynamics of faults, the compactional response of sandstones in sedimentary basins, and subsidence related to changes of the effective stress in clastic oil/gas reservoirs. The model yields different predictions for the compactional response of porous aggregates from those using other rheologies (e.g., viscous or poroelastic). This model has also some applica-tions to the study of solitary waves in the crust of the Earth [see Revil and Cathles, 2002; Revil et al., 2003].
Appendix A: Poroelastic Contribution
[30] The total porosity change of the porous aggregate is
written as @# tð Þ @t ¼ @# @t ! " e þ @# @t ! " i ; ðA1Þ
where the first term of the right-hand side of equation (A1) (subscript e) corresponds to the poroelastic contribution and the second term of the right-hand side of equation (A1) (subscript i) corresponds to the (irreversible) compactional response associated with pressure solution. In Biot’s theory, the poroelastic contribution to deformation is given by
@# tð Þ @t ! " e ¼ !"e @$ @t! ( @p @t ! " ; ðA2Þ
where# is the porosity, $ is the confining pressure, and p is the pore fluid pressure. The elastic porosity compressibility "eand the porosity effective stress coefficient( are defined
by "e¼ 1 B 1 K! 1 Ku ! " !# K ðA3Þ (¼#=Kfþ # ! 1=Bð Þ 1=K ! 1=Kð uÞ=B #=K! 1=K ! 1=Kð uÞ=B ; ðA4Þ
where B is the Skempton’s coefficient, K is the drained bulk modulus, Kuis the undrained bulk modulus, and Kfis the
bulk modulus of the pore water. A simple analysis of the poroelastic compactional response indicates that it is much smaller than the PPST response in the experiments by
Niemeijer et al. [2002]. Typically, ()#/#)e< 5%.
Appendix B: Fitting Procedure
[31] Equation (24) can be expressed as a nonlinear
functional relationship of the form d = G(m) between the vector of model parameters m and the vector of porosity data d:
d¼ #½ 1; #2; . . . ; #3+T ðB1Þ
m¼ #½ 0; "; c+T; ðB2Þ
where T signifies transpose. We use an a priori density probability corresponding to the null information in the range of possible values of the model parameters, which are #02 [0.20; 0.35], b 2 [0.5 " 10!8/Pa; 3.0" 10!8/Pa], and c2 [0; 1]. The Simplex algorithm [Caceci and Cacheris, 1984] is used to minimize the least squares objective function
min R¼k G mð Þ ! d0k2; ðB3Þ
wherekvk = (vTv)1/2
denotes the Euclidian (L2) norm and do
is the vector of the observed porosity data.
[32] We use an a priori model chosen randomly in the a
priori set of values of the model parameters given above. Then, we determine the mean and the standard deviation of the optimized model parameters resulting from the use of the optimization process. Five hundred terms were consid-ered in the series development involved in equation (24). The results are reported in Table 4.
[33] Acknowledgments. A.R. is grateful to L. M. Cathles for fruitful discussions when he was at Cornell University and the American Rock Mechanic Association (ARMA) for the 2004 Rock Mechanics Research Award he received and which has stimulated the present work. ANDRA is thanked for a grant given to P. Leroy during his Ph.D. thesis. This paper is the GDR-FORPRO Contribution 2005/11A.D and is also a contribution from the project POLARIS (ANR-ECCO-PNRH). D. Coelho, S. Altmann, and J. Lancelot are thanked for their supports. We thank J. Weertman, Andreas Kronenberg, E. H. Rutter, T. Dewers, and two anonymous referees for their constructive comments regarding this work.
References
Alcantar, N., J. Israelashvili, and J. Boles (2003), Forces and ionic transport between mica surfaces: implications for pressure solution, Geochim. Cosmochim. Acta, 67, 1289 – 1304.
Caceci, M. S., and W. P. Cacheris (1984), Fitting curves to data, the Sim-plex algorithm is the answer, Byte, 9, 340 – 362.
Chelidze, T. L., and Y. Gueguen (1999), Electrical spectroscopy of por-ous rocks: A review – I. Theoretical models, Geophys. J. Int., 137, 1 – 15.
Chelidze, T. L., A. I. Derevjanko, and O. D. Kurilenko (1977), Electrical Spectroscopy of Heterogeneous Systems, Naukova Dumka, Kiev, Russia. Cole, K. S., and R. H. Cole (1941), Dispersion and adsorption in dielectrics.
I. Alternating current characteristics, J. Chem. Phys., 9, 341 – 351. Davidson, D. W., and R. H. Cole (1951), Dielectric relaxation in glycerol,
propylene glycol, and n-propanol, J. Chem. Phys., 29, 1484 – 1490. Dewers, T., and A. Hajash (1995), Rate laws for water assisted compaction
and stress-induced water-rock interaction in sandstones, J. Geophys. Res., 100, 13,093 – 13,112.
Dewers, T., and P. Ortoleva (1990), A coupled reaction/transport/mechan-ical model for intergranular pressure solution stylolites, and differential
compaction and cementation in clean sandstones, Geochim. Cosmochim. Acta, 54, 1609 – 1625.
Dove, P. M., and D. A. Crerar (1990), Kinetics of quartz dissolution in electrolyte solutions using a hydrothermal mixed flow reactor, Geochim. Cosmochim Acta, 54, 955 – 969.
Gratier, J.-P., F. Renard, and P. Labaume (1999), How pressure solution creep and fracturing processes interact in the upper crust to make it behave in both a brittle and viscous manner, J. Struct. Geol., 21, 1189 – 1197.
He, W., A. Hajash, and D. Sparks (2002), A model for porosity evolution during compaction of sediments, Earth Planet. Sci. Lett., 197, 237 – 244. He, W., A. Hajash, and D. Sparks (2003), Creep compaction of quartz aggregates: Effect of pore fluid flow rates: A combined experimental and theoretical study, Am. J. Sci., 303, 73 – 93.
Iler, R. K. (1979), The Chemistry of Silica, John Wiley, Hoboken, N. J. Ivins, E. R. (1996), Transient creep of a composite lower crust: 2. A
poly-mineralic basis for rapidly evolving postseismic deformation modes, J. Geophys. Res., 101, 28,005 – 28,028.
Karner, S. L., F. M. Chester, A. K. Kronenberg, and J. S. Chester (2003), Subcritical compaction and yielding of granular quartz sand, Tectonophy-sics, 377(3 – 4), 357 – 381.
Kemna, A. (2000), Tomographic inversion of complex resistivity: Theory and application, Ph.D. thesis, Bochum Univ., Osnabru¨ck, Germany. Leroy, P., A. Revil, and D. Coelho (2006), Diffusion of ionic species in
bentonite, J. Colloid Interface Sci., 296, 248 – 255.
Lockner, D., and B. Evans (1995), Densification of quartz powder and reduction of conductivity at 700!C, J. Geophys. Res., 100, 13,081 – 13,092.
Monte´si, L. G. J. (2004), Controls of shear zone rheology and tectonic loading on postseismic creep, J. Geophys. Res., 109, B10404, doi:10.1029/2003JB002925.
Nakashima, S. (1995), Diffusivity of ions in pore water as a quantitative basis for rock deformation rate estimates, Tectonophysics, 245, 185 – 203. Niemeijer, A. R., and C. J. Spiers (2002), Compaction creep of quartz-muscovite mixtures at 500!C: Preliminary results on the influence of muscovite on pressure solution, in Deformation Mechanisms, Rheology and Tectonics: Current Status and Future Perspectives, edited by S. De Meer et al., London, Geol. Soc. Spec. Publ., 200, 61 – 71.
Niemeijer, A. R., C. J. Spiers, and B. Bos (2002), Compaction creep of quartz sand at 400 – 600!C: experimental evidence for dissolution-controlled pressure solution, Earth Planet. Sci. Lett., 195, 261 – 275. Pelton, W. H., S. H. Ward, P. G. Hallof, W. R. Sill, and P. H. Nelson (1978),
Mineral discrimination and removal of inductive coupling with multi-frequency IP, Geophysics, 43, 588 – 609.
Renard, F., P. Ortoleva, and J. P. Gratier (1997), Pressure solution in sand-stones: influence of clays and dependence on temperature and stress, Tectonophysics, 280, 257 – 266.
Revil, A. (1999), Pervasive pressure-solution transfer: A poro-visco-plastic model, Geophys. Res. Lett., 26, 255 – 258.
Revil, A. (2001), Pervasive pressure solution transfer in a quartz sand, J. Geophys. Res., 106, 8665 – 8690.
Revil, A., and L. M. Cathles (2002), Fluid transport by solitary waves along growing faults: A field example from the South Eugene Island Basin, Gulf of Mexico, Earth Planet. Sci. Lett., 202, 321 – 335, (Erratum, Earth Planet. Sci. Lett., 204, 321 – 322, 2002).
Revil, A., D. Grauls, and O. Bre´vart (2002), Bulk mechanical compaction of sand shale mixtures, J. Geophys. Res., 107(B11), 2293, doi:10.1029/ 2001JB000318.
Revil, A., G. Saracco, and P. Labazuy (2003), The volcano-electric effect, J. Geophys. Res., 108(B5), 2251, doi:10.1029/2002JB001835. Revil, A., P. Leroy, and K. Titov (2005), Characterization of transport
properties of argillaceous sediments. Application to the Callovo-Oxfordian Argillite, J. Geophys. Res., 110, B06202, doi:10.1029/ 2004JB003442.
Rutter, E. H. (1976), The kinetics of rock deformation by pressure solution, Philos. Trans., R. Soc. London, Ser. A, 283, 203 – 219.
Rutter, E. H. (1983), Pressure solution in nature, theory and experiment, J. Geol. Soc. London, 140, 725 – 740.
Skvortsova, Z. N. (2004), Deformation by the mechanism of dissolution-reprecipitation as a form of adsorption plasticization of natural salts, Colloid J., 66(1), 1 – 10.
Stephenson, L. P., W. J. Plumley, and V. V. Palciauskas (1992), A model for sandstone compaction by grain interpenetration, J. Sediment. Petrol., 62, 11 – 22.
Taherian, M. R., W. E. Kenyon, and K. A. Safinya (1990), Measurement of dielectric response of water-saturated rocks, Geophysics, 55(12), 1530 – 1541.
Wahab, A. A. (1998), Diagenetic history of Cambrian quartarenites, Ras Dib-Zeit bay area, Gulf of Suez, eastern desert, Egypt, Sediment. Geol., 121, 121 – 140.
Yang, X. S. (2000), Pressure solution in sedimentary basins: effect of temperature gradient, Earth Planet. Sci. Lett., 176, 233 – 243.
Yang, X. (2002), A mathematical model for voigt poro-visco-plastic defor-mation, Geophys. Res. Lett., 29(5), 1066, doi:10.1029/2001GL014014. Yasuhara, H., D. Elsworth, and A. Polak (2003), A mechanistic model
for compaction of granular aggregates moderated by pressure solu-tion, J. Geophys. Res., 108(B11), 2530, doi:10.1029/2003JB002536. Yasuhara, H., D. Elsworth, and A. Polak (2004), Evolution of permeability
in a natural fracture: significant role of pressure solution, J. Geophys. Res., 109, B03204, doi:10.1029/2003JB002663.
Yasuhara, H., C. Marone, and D. Elsworth (2005), Fault zone restrengthen-ing and frictional healrestrengthen-ing: The role of pressure solution, J. Geophys. Res., 110, B06310, doi:10.1029/2004JB003327.
!!!!!!!!!!!!!!!!!!!!!!!
A. Ghorbani and N. Florsch, University Paris VI, UMR 7619 ‘‘Sisyphe’’ Universite´ Pierre et Marie Curie, Paris 6, Tour 56, 4 place Jussieu, F-75252 Paris Cedex 05, France.
P. Leroy and A. Revil, CNRS-CEREGE, BP 80, F-13545 Aix-en-Provence, Cedex 4, France. (leroy@cerege.fr; revil@cerege.fr)
A. R. Niemeijer, HPT Laboratory, Faculty of Geosciences, Utrech University, P.O. Box 80.021, NL-3508 TA Utrech, Netherlands. (niemeyer@ geo.uu.nl)