HAL Id: hal-03015725
https://hal.archives-ouvertes.fr/hal-03015725
Submitted on 20 Nov 2020HAL is a multi-disciplinary open access archive for the deposit and dissemination of sci-entific research documents, whether they are pub-lished or not. The documents may come from teaching and research institutions in France or abroad, or from public or private research centers.
L’archive ouverte pluridisciplinaire HAL, est destinée au dépôt et à la diffusion de documents scientifiques de niveau recherche, publiés ou non, émanant des établissements d’enseignement et de recherche français ou étrangers, des laboratoires publics ou privés.
Plains zebras bring evidence that dilution and detection
effects may not always matter behaviorally and
demographically
Camille Vitet, Patrick Duncan, Olivier Gimenez, Cheryl Mabika, Simon
Chamaillé-Jammes
To cite this version:
Camille Vitet, Patrick Duncan, Olivier Gimenez, Cheryl Mabika, Simon Chamaillé-Jammes. Plains zebras bring evidence that dilution and detection effects may not always matter behaviorally and demo-graphically. Ecosphere, Ecological Society of America, 2020, 11 (11), pp.e03288. �10.1002/ecs2.3288�. �hal-03015725�
Plains zebras bring evidence that dilution and detection effects may not always matter behaviorally and demographically
Camille Vitet 1, 2 *, Patrick Duncan 2, 3, Olivier Gimenez 1, Cheryl Mabika 4 & Simon
Chamaillé-Jammes 1, 2, 5
1
CEFE, Univ. Montpellier, CNRS, EPHE, IRD, Univ. Paul Valéry Montpellier 3, Montpellier, France
2 LTSER France, Zone Atelier “Hwange”, Hwange National Park, Bag 62 Dete, Zimbabwe -
CNRS HERD (Hwange Environmental Research Development) program
3
Centre d’Etudes Biologiques de Chizé, CNRS-UMR 7372, Villiers-en-Bois, France
4
Zimbabwe Parks and Wildlife Management Authority, Scientific Services, P.O. Box CY140, Causeway, Harare, Zimbabwe
5
Mammal Research Institute, Department of Zoology & Entomology, University of Pretoria, Pretoria, South Africa
ABSTRACT
Group living is assumed to benefit prey by reducing predation risk due to dilution and detection effects. This increased safety could be exchanged against a reduced individual vigilance leading to increased foraging and fitness until costs of intra-group competition offset this benefit. However, very few studies have been able to directly test the relationship between individual fitness and group size in non-cooperative breeding species. Therefore, evidence that dilution and detection effects do indeed translate into increased fitness under predation risk remains mostly theoretical. Here we aimed at empirically testing whether group size influences beneficial and costly behaviors, and ultimately the survival of individuals, in a prey species facing heavy predation pressure. We focused on plains zebra Equus quagga of Hwange National Park in Zimbabwe, a high lion density area. We collected behavioral data (i.e. individual vigilance and foraging, collective vigilance, and agonistic interactions) that we used as proxies to investigate the costs and benefits of grouping in this species. We then fitted multistate
capture-mark-recapture and Cox proportional-hazards models to estimate apparent survival of adults and young zebras respectively, and assess whether a demographic signal of group size could be found. Our results show that collective vigilance increases with group size, a prerequisite of the detection effect, but individual vigilance does not consistently decrease with group size, which suggests that there is no group size effect on individual vigilance. Agonistic interactions were rare. These results suggest that there is no foraging costs of grouping here, and even some benefits such as a better collective vigilance. However, any benefits of being in larger groups did not translate into increased survival, as we found no effect of group size on the apparent survival of individuals. Since dilution and detection effects do not matter behaviorally and demographically in these
plains zebras living under high predation risk, these results challenge our understanding of how predation shapes animal sociality: fitness benefits of dilution or detection should not be assumed.
KEYWORDS: demography, grouping behavior, predation risk, sociality, ungulate
INTRODUCTION
Grouping strategies vary between- and within species, ranging from solitary life, fusion-fission systems where group size changes regularly, to stable groups (Clutton-Brock 2016, Ward and Webster 2016). It is assumed that this diversity was favored by natural selection on individuals, and that group sizes reflect the trade-offs between benefits and costs of grouping (Krause and Ruxton 2002). In prey species, one of the main assumed benefits of living in groups is reduced predation risk. Two, non-mutually exclusive, reasons are usually brought forward. First, as group size increases, the presence of additional group members could dilute the risk for each individual of being predated during an attack, under the assumption that the predator can only take one prey at a time and that attack rate does not increase with prey group sizes (the dilution effect ; Bertram 1978, Turner and Pitcher 1986, Lehtonen and Jaatinen 2016). Second, with increasing group size, the probability of detecting an approaching predator could increase as more individuals monitor the environment (the detection effect; Lima 1995, Pulliam 1973). Several studies have given support to these two effects (see Beauchamp (2015) chapters 2 & 5 for a review).
Increased safety in larger groups may allow individual to reduce their vigilance level, leading to increased foraging (the so-called group size effect on vigilance; Beauchamp 2008, Elgar 1989, Lima 1995, Roberts 1996). However, living in groups also incurs costs such as increased
intra-group competition for resources, due to either interference between intra-group members or depletion of resources (Amano et al. 2006, Blanchard et al. 2008).
These assumed costs and benefits of group living have been widely studied, but with mixed conclusions. For instance, the reduction of individual vigilance with group size, likely leading to increased foraging, has often been observed (Elgar 1989, Lima and Dill 1990). Studies failing to detect such relationship are also common however (Treves 2000, Beauchamp 2008), which could potentially be explained by the existence of alternative antipredator strategies other than vigilance such as grouping (Creel et al. 2014) and adjusting space use in response to predation risk (Creel et al. 2005, Patin et al. 2019). Mixed results have also been obtained when directly investigating the relationship between group size and foraging rates. In the specific case of ungulates, this relationship has been found to be either positive (Isvaran 2007, Barnier et al. 2016), negative (Molvar and Bowyer 1994, Focardi and Pecchioli 2005) or absent (Périquet et al. 2017). Similarly, in ungulates, frequency of agonistic interactions between group members was found to be either positively (Molvar and Bowyer 1994), negatively (Risenhoover and Bailey 1985) or not correlated to group size (Fortin et al. 2004).
If costs and benefits of group living exist and are significant, these ultimately affect the fitness of individuals. As costs and benefits of group living should vary between species and environments, it is unclear what shape the relationship between group size and fitness should take in specific cases (Sibly 1983, Krause and Ruxton 2002). Generally, fitness is expected to increase with group size up to an optimal size, when the costs of increased intra-group
competition offset these benefits at larger group sizes (Sibly 1983, Markham et al. 2015). Few studies have tested the relationship between group size and individual fitness under predation risk directly. There are several explanations for this. First, most empirical studies come mainly
from research focused on species that do not live in stable groups, for which group size is unlikely to translate into long-term effects on fitness as it often fluctuates (Cheney and Seyfarth 1987, Brown and Brown 2004, Serrano et al. 2005, Watson et al. 2007, Brown et al. 2016). Second, some of these studies do not provide information on predation pressure or are conducted in predator-free environments in which grouping behavior of prey species might not necessarily reflect an antipredator strategy (Waterman 2002, Altmann and Alberts 2003, Savage et al. 2009, Gager et al. 2016, Pillay and Rymer 2017). Finally, numerous studies focus on cooperative breeding species for which the effect of the number of helpers is more likely to affect individual fitness than the number of individuals in the group (Brown et al. 2003, Brouwer et al. 2006, 2020, Canestrari et al. 2008, Creel and Creel 2015, Guindre-Parker and Rubenstein 2020).
It is also noteworthy that empirical results on the relationship between group size and survival, a key component of fitness, are inconsistent. In mammals for instance, juvenile survival has been found to be positively (Cheney and Seyfarth 1987, Rasa 1989), negatively (van
Noordwijk and van Schaik 1999, Waterman 2002) or not correlated (Majolo et al. 2008, Savage et al. 2009) with group size. Similarly, adult survival has been found to be positively (Rood 1990, Clutton-Brock et al. 1999), negatively (Creel & Creel, 2015) or not correlated (Waterman 2002, McGuire et al. 2002, Gager et al. 2016) with group size. Taken together, these studies therefore suggest that the existence of dilution and detection effects that would have large effects on survival should not be taken for granted.
Here, we tested whether group size affects foraging and vigilance, and ultimately the survival of individuals in a prey population facing heavy predation pressure. We did so by studying a gregarious species, plains zebra Equus quagga, in Hwange National Park (HNP) in Zimbabwe, a system characterized by a high predator pressure (Loveridge et al. 2016). We first
tested whether individuals adjust their behavior (i.e. individual vigilance and foraging, collective vigilance, and agonistic interactions) with group size. This would offer a basis to explain any relationship between group size and survival, which we also investigated (see below). With increasing group size, we expected (1) reduced individual vigilance, (2) increases in time spent foraging, and (3) increased collective vigilance, defined as having at least one individual vigilant (Lima 1995). However, as we also expected increased levels of agonistic interactions between group members in larger groups, we expected that these predictions might not be valid for the largest groups. We then investigated whether harem size affects the survival of individuals, using long-term individual-based monitoring data. We used Cox proportional-hazards and multistate capture-mark-recapture (CMR) models to assess the effect of group size on apparent survival of foals and adults. Since individuals in smaller groups are expected to experience greater
predation, we predicted increased survival probabilities of both age-classes with increasing group size, but only up to a point, where increased intra-group competition might induce costs of being in larger groups. Overall, by combining behavioral observation and long-term demographic data, we offer a rare opportunity for a comprehensive test of the demographic consequences of
dilution and detection effects under a high level of predation.
MATERIAL AND METHODS
Study site and species
The study was conducted in the eastern section of HNP in western Zimbabwe over an area covering c. 2000 km² (19°00’S, 26°30’E). The vegetation is dominantly bushy but interspersed with patches of open grasslands. The annual rainfall averages 600 mm, with most rain falling between November and April. In the hot dry season (September-October), water is only available
in a limited number of pans were groundwater is pumped. In the study area, these pans allow water-dependent species to have access to water year-around.
We used plains zebra as model species. In HNP, plains zebra density varies around 1 individual km-² (Chamaillé-Jammes et al. 2009). Plains zebra populations are made of two basic
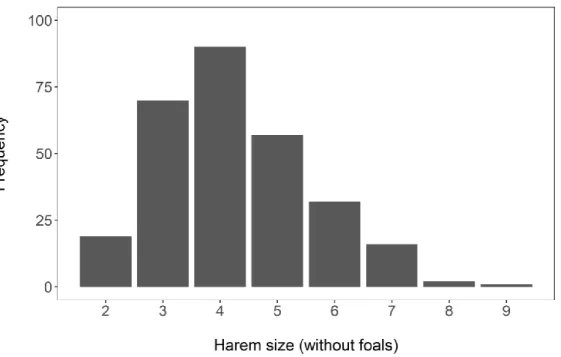
social units: harem and bachelor groups (Klingel 1969). Non-territorial, the harems are composed of a stallion (i.e. harem-male) and most often several adult females (unrelated, as female disperse from natal groups when they are around 2 years old), subadults of both sexes, and dependent offspring. In the study area, harem sizes (without foals) range between 2 and 9 individuals (Fig. 1). Non-harem males form all-male bachelor groups, of 1-19 individuals (median: 3 individuals). All individuals used in this study were identified, using the stripes patterns that are unique to each individual, in the context of an ongoing long-term demographic study. We categorized individuals across four age-classes: foal, from birth to 1 year-old (y.o.); yearling, between 1 and 2 y.o.; subadult, between 2 and 4 y.o.; and adults, 4 y.o. and older. Young males and females disperse when they are around 2 y.o.: natally dispersing females join existing harems and males join bachelor groups. For reasons linked to sample size, in subsequent analyses subadults and adults were grouped in the same age-class termed ‘adult’.
Harems and/or bachelor groups regularly aggregate with others in larger groups (referred to as ‘herds’ hereafter), defining a multi-layered social system (Klingel 1969). Stability of herds is low, likely a few hours or less (pers. obs. and unpublished data from GPS collars). Stability of lower social layers, i.e. bachelor groups or harems, is greater. Some bachelors appear to spent months, if not years, together (unpublished data). Size and composition of bachelor groups had however not been consistently recorded during the historical demographic monitoring we based our analysis on, and we therefore focused our study on harems. Harem size is highly stable over
time. A stallion is always present, and although subadult and adult females may change group, this is rare: in this study, after one year 92% of mares (n=453) and after two years 86% of mares (n=342) were still in the same harem. Therefore, we studied the relationship between behaviors and harem or herd size (as both harem size and herd size can be defined at the time t when behavior is observed), but studied the relationship between survival and harem size only (as, due to instability, herd size cannot be defined over the time interval over which survival is estimated, and an average herd size cannot be estimated unless near-continuous long-term observation is possible, which was not the case here).
Collection and analysis of behavioral data
We collected data on the behavior of zebras during 2 wet and 2 dry seasons (in 2018 and 2019). We conducted direct observations, videotaped for later analysis, during daytime using a car as a hide. We considered individuals to be part of the same group when the distance between them was below 50 m: in the field, this distance threshold (also used by Barnier et al. 2016) is adequate to separate isolated harems or groups that are in close contact from other groups of individuals located further away, and is thus relevant to study group-level dilution and detection effects. WErreur ! Signet non défini.e focused on vigilance, foraging, and agonistic behaviors.
We studied individual vigilance and foraging using a focal-sampling approach (Altmann 1974). An individual was considered to be vigilant when it was stationary with the head raised above the shoulder and scanning the surroundings, and to be foraging when it was grazing. Based on the scanning direction of individuals, we focused on anti-predator vigilance and avoided conducting a focal observation if the animal was vigilant towards conspecifics. We studied only individuals in groups whose main activity was foraging to prevent movement or
change in group size or composition during focal samples. To obtain a large sample size within the limited time available, we only recorded, for each focal harem, data on the stallion and on one female, whose reproductive status (lactating or not) was recorded. A female was considered to be lactating if she had a foal (i.e. from birth to 1 y.o.). If a least one non-lactating and one lactating female were present in the group, we recorded data on one female of each status. As we conducted our research in the same study area during the whole study period, we could not avoid to occasionally repeating observations on the same individuals (number of focal per individual: min=1, max=11, median=1, mean=2.6). For each studied individual, we measured the duration of one bout of vigilance and the duration of the foraging bouts that immediately preceded and followed this vigilance bout. We only focused on active vigilance (i.e. head above shoulder), differentiating between free (i.e. while chewing) and costly vigilance (i.e. scanning exclusively). We recorded whether vigilance shifted from free to costly vigilance or whether foraging shifted to vigilance in response to a sudden external stimulus or to agonistic interactions (i.e. threat, push, chase or attack behaviors). This allowed us to (1) remove from the data the variability linked to external stimuli, by removing the affected bouts from the analyses (4 of the 992 bouts recorded), and (2) get an estimate of the proportion of foraging bouts interrupted by agonistic interactions, which partially reflects the strength of intragroup interference in the access to food resources. As costly vigilance bouts were rare (35 of the 352 bouts of vigilance recorded), we choose to analyze only focals during which the individual was in free vigilance. We collected data to control for the multiple factors that could influence antipredator vigilance and could either mask or reinforce the group size effect (Elgar 1989, Beauchamp 2015). We systematically recorded individual variables (i.e. age class, sex and reproductive status), type of group (i.e. ‘harem’ or ‘herd’, when the focal harem is isolated or surrounded by other zebra groups within
50 m, respectively), zebra group size (i.e. number of zebras in a 50-m radius, without considering foals but including any other zebras from the focal harem or from other harems or bachelor groups), number of foals in the group, and the presence of others prey species in a 50-m radius. We also estimated distance to cover as cover can provide ambush opportunities for lions. The distance between zebras and our vehicle (distance to observer) was also estimated, but these zebras are habituated to vehicles and tolerated vehicles at 5-50 m. As proxies for visibility, we recorded grass height (‘short’ when below focal zebra’s hooves, ‘tall’ when above focal zebra’s tibia, which is above the level of a zebra’s eyes when feeding, and ‘medium’ when at
intermediate height). We recorded wind strength using Beaufort number given by an
anemometer (‘none’ (0 km h-1), ‘low’ (0 - 1.8 km h-1), ‘medium’ (1.8 - 7.4 km h-1), and ‘strong’
(> 13 km h-1) as zebras could be more vigilant in windy conditions that may affect the perception
of predator cues. In total, we analyzed 282 focal observations (122 for males, 89 for non-lactating females and 71 for non-lactating females). In 2018, we collected 138 and 35 focal samples in the wet and dry season respectively, and in 2019, we collected 49 and 60 focal samples in the wet and dry season respectively.
We tested the effect of group size on the duration of vigilance and foraging bouts by fitting generalized linear mixed-effects models using the R package ‘lme4’ (Bates et al. 2015). We first built full models with the duration of vigilance or foraging bouts as response variable (we assumed Poisson-distributed errors), and the main and interactive effects of group size, season, and a variable coding for sex and reproductive status (male, lactating female,
non-lactating female) as fixed effects. We also added a set of additive effects to control for the effects of variables which were not of interest here but were known to affect vigilance or foraging: presence/absence of other species, duration of the precedent foraging/vigilance bout, distance to
cover, distance to observer, grass height and wind strength. We included the identity of the individual as random intercept to take into account individual differences in average bout duration. We also included observation-level random intercepts to correct for over-dispersion (Harrison 2014). These models were run separately for harem and herds, as the very high correlation between group size and group type prevented including them meaningfully in the same models. We also ran these models with a second-order polynomial effect of group size to allow the relationship between the response variable and group size to be non-linear, as expected by optimal group size models. From these full models, we conducted variable selection using the Akaike Information Criterion corrected for small sample sizes (AICc), considering only
informative parameters (Arnold 2010), i.e. those reducing AICc by >2. Variable selection was performed using the R package ‘MuMIn’ (Barton 2019).
We studied the potential for collective vigilance using the scan-sampling approach (i.e. instantaneous sampling on groups) (Altmann 1974). We focused only on groups whose main activity was foraging. For each group studied, and every minute for 5 min, we performed a scan on the whole group and counted the number of individuals vigilant in the group (without
considering foals which we assumed naïve regarding predation risk). We could thus compute the proportion of time (i.e. proportion of scans) when at least one individual in the group was
vigilant, which is a metric of collective vigilance (Pays et al. 2007a, 2007b, 2012). We recorded the same control variables as for the study of individual vigilance and foraging (see above). As we conducted our research in the same study area during the whole study period, we could not avoid occasionally having repeated observations of the same groups (number of scan sequence per group: min=1, max=7, median=1, mean=1.7). In total, we analyzed 475 scan samples (95 scan sequences of 5 scans each). In 2018, we collected 35 and 15 scan sequences in the wet and
dry season respectively, and in 2019, we collected 23 and 22 scan sequences in the wet and dry season respectively.
For statistical inference on these ‘collective vigilance’ data, we used an approach similar to that used for the study of the duration of vigilance/foraging bouts. The response variable was the proportion of scans in an observation sequence where at least one individual was vigilant, and we assumed binomial distribution of errors. For harems, the fixed effects of the models were the same as for the study of the duration of vigilance/foraging bouts (except for sex and
reproductive status of individuals and the duration of the precedent bout). Random effects were changed: the random intercept was for harem identity, and observation-level random effects were not required. For herds, there were no repeated observations of specific herds, as herd
represented different group aggregation each time, and we therefore did not include random effects and fitted the models using the R package ‘stats’ (R Core Team 2019). Since sample sizes were small for herds (20 scan sequences), the full model for herds only included the interactive effects of group size and season, as adding other control variables led to strong overfitting. We performed the same AICc-based variable selection as for the study of the duration of
vigilance/foraging bouts.
We studied agonistic interactions using the all-occurrence sampling approach (Altmann 1974). Agonistic interactions during foraging were studied during the study of vigilance and foraging (see above). Additionally, we conducted 10-min observations of groups when individuals were resting, and 1-min observations of groups that were travelling. The 1-min duration was constrained by the fact that travelling groups often rapidly disappeared in the bushes. For both types of observation, we counted the number of agonistic interactions observed during the observations periods to estimate the frequency of agonistic interactions. In total, we
analyzed 32 sequences of 10-min observations when zebras were resting, and 46 sequences of 1-min observations when they were travelling. As previously, we could not avoid repeating observations of same groups occasionally (number of observations group-1 resting: min=1,
max=4, median=1, mean=1.3; number of observations group-1 travelling: min=1, max=12,
median=1, mean=1.7). Agonistic interactions were very rare (see results), so statistical analyses were not possible.
Collection and analysis of demographic data
We estimated the relationship between harem size and individual survival using data from the long-term sight-resight study. Twice a year, during approximately one month in the wet season and three weeks in the dry season, groups whose individuals were known were sought. When found, harem size and identity of the individuals were recorded. The age of previously unobserved young individuals was estimated as in Grange et al. (2015) and suckling used to determine motherhood. Further details on the monitoring of this population can be found in Grange et al. (2015). Data collected between January 2008 and March 2017 were used here, corresponding to 19 capture occasions (10 wet and 9 dry seasons) over 10 years.
We used multistate CMR models to estimate adult survival (Lebreton et al. 2009). CMR modelling allowed us to account for the fact that not all known individuals were observed at each session (imperfect detection). States were used to represent group size classes: small, medium and large for harems of size 2 to 3, 4 to 5, and 6 and more, respectively. Foals were not used for the calculation of group size. This classification was chosen based on the distribution of harem sizes in the population (Fig. 1). Using a different categorization of group sizes did not change our results (Appendix S1: Tables S1-S4) and classifying group sizes into more states created too
many parameters for our models. See supporting information for further details on encounter histories and survival, detection and transition matrices (Appendix S2: Figures S1-S3). We ran separate models for females and males. We added a fourth state in the male analysis to represent their presence in bachelor group (whose group size was usually not recorded). A total of 143 females and 105 males were retained for analysis. The U-CARE software (Choquet et al. 2009) was first used to perform goodness-of-fit tests to identify any issues in the structure of our datasets (Pradel et al. 2003). Models were fitted using the R package ‘RMark’ (Laake 2013), starting from a full model including an interactive effect of group size and season on survival probability, an additive effect of group size and season on detection probabilities, and a group size effect on transition probability. As our goal was to see how group size affects survival, we created only three simpler models from this model, which included either a season effect, a group size effect, or an additive effect of season and group size on the survival probability of adults. We used AICc to select the most parsimonious model, considering only informative parameters (Arnold 2010). Estimates were corrected for unequal time intervals between capture occasions. Each interval was defined as the time from the start of the field session until the start of the following field session.
For foals (less than 1 y.o.), we used the fact that they are dependent on their mother. If the mother was observed, the detection probability of the foal being alive is 1, and the observation of a mare without her foal is reliable evidence that the foal had not survived. We therefore used standard Cox proportional-hazards models, fitted with the R package ‘survival’ (Therneau 2020). A total of 114 foals were retained for the analysis. Due to small sample sizes, we could not test for the effect of season on foal survival, so we restricted our analysis to two models which included either an effect of age-at-entry (i.e. estimated age in days when they were first
observed) or an additive effect of group size and age-at-entry on the survival probability of foals. As age-at-entry for foals were highly variables (min=0, max=334, median=46, mean=68.7), we choose to run a time-on-study model which is more robust to variations in age-at-entry than the chronological age one (Chalise et al. 2012). Age-at-entry was therefore included as a 2-class variable (0-1 and 1-6 months-old).
RESULTS
Effect of group size on behavior
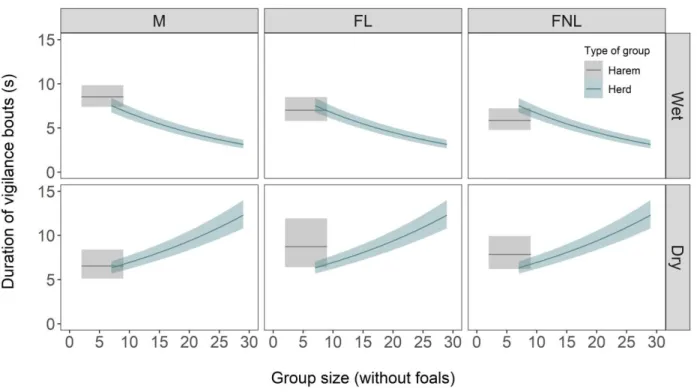
The duration of vigilance bouts was not affected, either linearly or curvilinearly, by group size in isolated harems (Fig. 2; Appendix S3: Table S1). In herds, aggregation of groups that were usually larger than single harems, vigilance decreased with group size during the wet season, but increased with group size during the dry season (Fig. 2; Appendix S3: Table S1). Vigilant bouts were on average slightly longer in the dry season (Fig. 2).
The duration of foraging bouts was affected linearly by group size in isolated harem, decreasing with group size in males and increasing with group size in lactating females (Fig. 3; Appendix S3: Table S2). Group size had no influence on the duration of foraging bouts in herds (Fig. 3; Appendix S3: Table S2). Foraging bouts were on average slightly shorter during the dry season (Fig. 3).
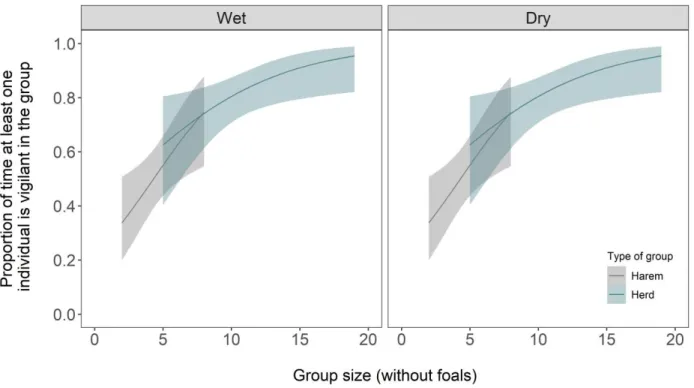
The likelihood that at least one individual of the group was vigilant increased strongly with group size, both in isolated harems and in herds (Fig. 4; Appendix S3: Table S3), with no seasonal differences.
Agonistic interactions were very rare. Over 636 foraging bouts observed, only 1 was interrupted by an agonistic interaction. When zebras were travelling or resting, agonistic
interactions were also low. We observed only 7 and 13 agonistic interactions (AI) during 0.77 h and 5.33 h when zebras were travelling (9.1 AI h-1) and resting (2.4 AI h-1) respectively : 30%
were threats (least intense level of agonism), 20% were pushes, and 50% were attacks (these involved physical contacts but rarely lead to severe injuries).
Effect of harem size on survival
Data for adult males did not show any lack of fit (X²(146)= 89.182, p = 1). However, we found evidence for a lack of fit in adult females' data (X²(142) = 232.505, p = 0), apparently due to a transient effect (test 3G.SR: X²(26) = 58.331, p = 0). We therefore corrected AICc values for over-dispersion (coefficient = 1.5015).
The survival of both adult males and females changed between seasons but was not affected by harem size (Table 1). Adult male survival was 0.863 (± 0.027 SE, 95% CI [0.801-0.908]) in the wet season and 0.926 (± 0.022 SE, 95% CI [0.870-0.959]) in the dry season. Adult female survival was 0.935 (± 0.022 SE, 95% CI [0.877-0.967]) in the wet season and 0.881 (± 0.020 SE, 95% CI [0.836-0.915]) in the dry season.
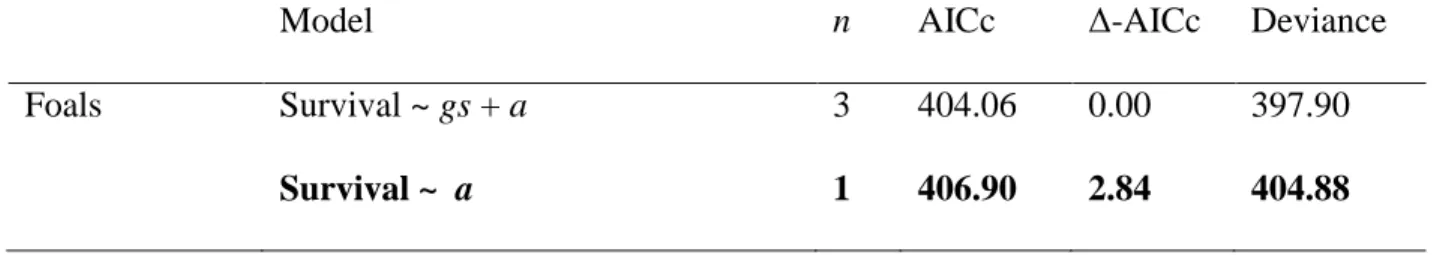
The survival of foals was not clearly affected by harem size. The model including harem size effect was only 2.84 AIC units better than the model without this factor, while having two extra parameters should have reduced AIC by four to be considered informative (Table 2). Survival estimates from the models including harem size were lower in medium-sized harems than in smaller or larger ones (Appendix S4: Table S1).
DISCUSSION
This study shows that group size does not have large and consistent effects on plains zebra vigilance or foraging behaviors at the individual level. This is despite the fact that group size increases the likelihood of not being targeted if attacked (dilution effect), and the likelihood of having at least one vigilant individual at any time, which should facilitate collective vigilance in larger groups. We found that agonistic interactions were rare. Overall, this suggests that in plains zebras increasing group size comes with little benefits or costs linked to foraging and vigilance. Accordingly, the size of the most stable unit, the harem, has no straightforward effect on
survival, even in context of high predation pressure.
Lack of, or inconsistency of, group size effects on vigilance and foraging
Contrary to our predictions, we found no consistent effect of group size on the duration of either vigilance or foraging bouts. Group size did contribute to an explanation of these variables in a few instances, but this effect was not always consistent with the decrease expected from a dilution or detection effect, was most often not large, or was driven by what happens in
uncommon situations (i.e. very large group size). For instance, zebras had shorter vigilance bouts when in very large herds, but this was true only in the wet season. The occurrence of such large aggregations was rare. The only situation in which foraging bouts increased with group size was for lactating females in the wet season, and this effect did not persist in larger herds. Therefore, our results suggest that group size has little effect on individual vigilance and foraging in plains zebras at our study site. This view is supported by the inconsistent results on the relationship between group size and vigilance and foraging found by previous independent studies conducted in the same species, either at the same site (Périquet et al. 2010, 2012, Barnier et al. 2016) or
elsewhere (Schmitt et al. 2014, Périquet et al. 2017). Thus, we conclude that we found no evidence of biologically significant detection or dilution effects on the duration of vigilance and foraging bouts.
We see three possible explanations for this unexpected result: (1) dilution or collective detection don’t occur or are not relied upon by zebras. Although zebra group sizes are generally small, this is the situation in which the dilution effect, a 1/N effect, should be strongest.
However, several conditions are required for dilution to occur. First, the rate of attacks by predators should not increase with increasing group size (Turner and Pitcher 1986). If this is so, individuals in smaller groups should benefit from increased safety (Creel and Winnie 2005), unlike what is predicted by the dilution and detection effects. In HNP, larger zebra groups could be more conspicuous and more frequently attacked by lions. This hypothesis cannot be tested at the moment. Secondly, dilution effects are expected to fade if predators attack a subset of individuals in groups of prey more frequently. Lions have been shown to preferentially attack zebra foals in Kruger National Park and Etosha National Park (Stander 1992, Mills and Shenk 1992) and this is likely the case in HNP too. If so, group size becomes a poor indicator of the level of risk experienced by individuals and the risk of being predated will likely be decoupled from the size of the group. This is also the case if individuals at the periphery of groups are preferentially targeted (the geometry of the selfish herd, Hamilton 1971), although our data do not suggest that individuals at the periphery are more vigilant (not shown). We also acknowledge that, although the dilution effect has until now be looked at, like here, at the scale of the group, it may actually operate first and foremost at a higher scale: for instance at the scale of the
predator’s foraging patch where groups, not individuals, can dilute each other’s risk. Therefore, there are reasons why dilution at the group scale might not occur. Regarding collective detection,
our results show that larger groups make it more likely to have at least one vigilant individual at any time. However, this probability remains significantly lower than 1.0 at most group sizes, and therefore individuals may be reluctant to rely on this effect. Also, it is known that it can be risky to rely on vigilance by another individual, as this one may be more likely to escape attack than non-vigilant individuals, which are more likely to become the predator’s target (Bednekoff and Lima 1998). This process explains why vigilance coordination is rarely observed in systems without dedicated sentinels (Pays et al. 2007a, 2007b, 2012). There is also no evidence of
vigilance coordination in zebras at our study site (unpublished study), suggesting that they might not rely on collective vigilance. Another possible explanation is that (2) zebras in larger groups may, if group size reduces risk, trade off this safety not for reduced vigilance but for greater use of riskier patches of higher forage quality. At the study site, larger groups of zebras may use riskier, but possibly richer, patches (Patin 2018), and such group size dependent space-use adjustments to predation risk might invalidate the traditional expectations about the group size - vigilance relationship (Patin et al. 2019). A third possibility is that (3) the prediction that dilution and collective detection should lead to reduce individual vigilance is based on the assumption that vigilance reduces foraging rate. This might not be the case here. Indeed, 90 % of the vigilance bouts observed were free vigilance bouts, as zebra chew the previous bite while being vigilant. If vigilance and foraging are not mutually exclusive activities, zebras do not have to trade-off foraging for vigilance as they can perform both simultaneously and this could explain why individuals in larger groups did not reduce their vigilance level.
Overall, many explanations, some not mutually exclusive, can be brought forward to explain the lack of a consistent vigilance - group size relationship in these plains zebras, and likely in other species. Future work is needed to clarify whether or not they hold true. It will be
challenging to do this in the wild, and modelling work might be helpful to narrow the field of investigation initially. Whatever the underlying reason(s), we did not find that increasing group size improve foraging rates in plains zebras.
Lack of evidence for costs dependent on group size via interference and agonistic interactions
Contrary to our prediction, we found no apparent costs related to intra-group interference competition for access to resources in our study population. Agonistic interactions were rare, as found in other plains zebra populations (Fischhoff et al. 2009, Simpson et al. 2012). Due to this rarity, we could not test our hypothesis that the frequency of agonistic interactions increases as group size increases. However, foraging plains zebras were rarely interrupted by agonistic interactions, so our results suggest that intra-group competition could have at most only a weak impact on the cost-benefit balance of grouping for these zebras.
Lack of evidence for a survival effect of harem size
We did not find evidence that harem size affects the survival of individuals in this population in which individuals experience high predation risk. This is consistent with our behavioral
observation suggesting no clear effect of group size on vigilance and foraging behavior. Some other benefits and costs of group living do exist and were not considered here (e.g. costs related to behavioral synchrony and decision-making, parasitism). Our results however show that, irrespective of the mechanisms considered, harem size has no overriding influence on survival, a pattern found in some of the few similar studies conducted on non-cooperative breeding species under predation (Brown et al., 2016; Robinson, 1988). We could not study whether grouping at higher social levels, i.e. between harems, has fitness benefits. The frequency of such associations
remains unknown and would be difficult to estimate in the field. However, an adaptive
perspective of the instability of these multi-harem herds suggests that the costs and benefits of such groupings must be highly time and space dependent and further research on their social and ecological determinants is clearly needed.
CONCLUSION
In conclusion, this study provides a rare comprehensive test of the demographic relevance of dilution and detection effects under predation risk, by combining behavioral observations and long-term demographic data. The results show that group size does not have an effect on vigilance, as has been found in some other studies (Treves 2000, Beauchamp 2008). Most importantly, all these results question whether fitness benefits of dilution or detection should always be assumed, as is commonly done in many empirical and theoretical works (e.g. Serrano et al. 2005, Lehtonen and Jaatinen 2016, Guindre-Parker and Rubenstein 2020). We argue that further studies on group size - fitness relationships are needed, particularly on species which do not breed cooperatively. This would allow a stronger conceptual framework for understanding how predation shapes animal sociality to be built.
ACKNOWLEDGMENTS
We thank the Director General of the Zimbabwe Parks and Wildlife Management Authority for providing the opportunity to carry out this research. We also thank the many people – too numerous to be named here - involved in the demographic monitoring over the years. C. Vitet was supported by a PhD fellowship from ‘Université de Montpellier’. The French ‘Agence
National de la Recherche’ supported this work via grants ANR-08-BLAN-0022, ANR-11-CEPS-003, and ANR-16-CE02-0001-01.
REFERENCES
Altmann, J. 1974. Observational Study of Behavior : Sampling Methods. Behaviour 49:227–267. Altmann, J., and S. C. Alberts. 2003. Variability in reproductive success viewed from a
life-history perspective in baboons. American Journal of Human Biology 15:401–409.
Amano, T., K. Ushiyama, G. Fujita, and H. Higuchi. 2006. Costs and benefits of flocking in foraging white-fronted geese (Anser albifrons): effects of resource depletion. Journal of Zoology 269:111–115.
Arnold, T. W. 2010. Uninformative Parameters and Model Selection Using Akaike’s Information Criterion. Journal of Wildlife Management 74:1175–1178.
Barnier, F., P. Duncan, H. Fritz, P. Blanchard, D. I. Rubenstein, and O. Pays. 2016. Between-gender differences in vigilance do not necessarily lead to differences in foraging-vigilance tradeoffs. Oecologia 181:757–768.
Barton, K. 2019. MuMIn: Multi-Model Inference.
Bates, D., M. Mächler, B. Bolker, and S. Walker. 2015. Fitting Linear Mixed-Effects Models Using {lme4}. Journal of Statistical Software 67:1–48.
Beauchamp, G. 2008. What is the magnitude of the group-size effect on vigilance? Oxford University Press.
Beauchamp, G. 2015. Animal vigilance : monitoring predators and competitors. Academic Press. Bednekoff, P. A., and S. L. Lima. 1998. Re-examining safety in numbers: interactions between
risk dilution and collective detection depend upon predator targeting behaviour. Proceedings of the Royal Society B: Biological Sciences 265:2021–2026.
Bertram, P. C. R. 1978. Living in groups: predators and prey. Pages 64–96 in J. R. Krebs and N. B. Davies, editors. Behavioural ecology: an evolutionary approach.
Blanchard, P., R. Sabatier, and H. Fritz. 2008. Within-group spatial position and vigilance: A role also for competition? The case of impalas (Aepyceros melampus) with a controlled food supply. Behavioral Ecology and Sociobiology 62:1863–1868.
Brouwer, L., A. Cockburn, and M. van de Pol. 2020. Integrating Fitness Components Reveals That Survival Costs Outweigh Other Benefits and Costs of Group Living in Two Closely Related Species. The American naturalist 195:201–215.
Brouwer, L., D. S. Richardson, C. Eikenaar, and J. Komdeur. 2006. The role of group size and environmental factors on survival in a cooperatively breeding tropical passerine. Journal of Animal Ecology 75:1321–1329.
Brown, C. R., and M. B. Brown. 2004. Group size and ectoparasitism affect daily survival probability in a colonial bird. Behavioral Ecology and Sociobiology 56:498–511.
Brown, C. R., M. B. Brown, E. A. Roche, V. A. O’Brien, and C. E. Page. 2016. Fluctuating survival selection explains variation in avian group size. Proceedings of the National Academy of Sciences 113:5113–5118.
survival and movement in relation to colony size in the sociable weaver. Behavioral Ecology 14:463–471.
Canestrari, D., J. M. Marcos, and V. Baglione. 2008. Reproductive success increases with group size in cooperative carrion crows, Corvus corone corone. Animal Behaviour 75:403–416.
Chalise, P., E. Chicken, and D. McGee. 2012. Baseline age effect on parameter estimates in Cox models. Journal of Statistical Computation and Simulation 82:1767–1774.
Chamaillé-Jammes, S., M. Valeix, M. Bourgarel, F. Murindagomo, and H. Fritz. 2009. Seasonal density estimates of common large herbivores in Hwange National Park, Zimbabwe. African Journal of Ecology 47:804–808.
Cheney, D. L., and R. M. Seyfarth. 1987. The influence of intergroup competition on the
survival and reproduction of female vervet monkeys. Behavioral Ecology and Sociobiology 21:375–386.
Choquet, R., J.-D. Lebreton, O. Gimenez, A.-M. Reboulet, and R. Pradel. 2009. U-CARE: Utilities for performing goodness of fit tests and manipulating CApture-REcapture data. Ecography 32:1071–1074.
Clutton-Brock, T. H. 2016. Mammal Societies. John Wiley & Sons.
Clutton-Brock, T. H., A. Maccoll, P. Chadwick, D. Gaynor, R. Kansky, and J. D. Skinner. 1999. Reproduction and survival of suricates (Suricata suricatta) in the southern Kalahari. African Journal of Ecology 37:69–80.
Creel, S., and N. M. Creel. 2015. Opposing effects of group size on reproduction and survival in African wild dogs. Behavioral Ecology 26:1414–1422.
Creel, S., P. Schuette, and D. Christianson. 2014. Effects of predation risk on group size, vigilance, and foraging behavior in an African ungulate community. Behavioral Ecology 25:773–784.
Creel, S., and J. A. Winnie. 2005. Responses of elk herd size to fine-scale spatial and temporal variation in the risk of predation by wolves. Animal Behaviour 69:1181–1189.
Creel, S., J. Winnie, B. Maxwell, K. Hamlin, and M. Creel. 2005. Elk alter habitat selection as an antipredator response to wolves. Ecology 86:3387–3397.
Elgar, M. 1989. Predator vigilance and group size in mammals and birds: a critical review of the empirical evidence. Biological Reviews 64:13–33.
Fischhoff, I. R., J. Dushoff, S. R. Sundaresan, J. E. Cordingley, and D. I. Rubenstein. 2009. Reproductive status influences group size and persistence of bonds in male plains zebra (Equus burchelli). Behavioral Ecology and Sociobiology 63:1035–1043.
Focardi, S., and E. Pecchioli. 2005. Social cohesion and foraging decrease with group size in fallow deer (Dama dama). Behavioral Ecology and Sociobiology 59:84–91.
Fortin, D., M. S. Boyce, E. H. Merrill, and J. M. Fryxell. 2004. Foraging costs of vigilance in large mammalian herbivores. Oikos 107:172–180.
Gager, Y., O. Gimenez, M. T. O’Mara, and D. K. N. Dechmann. 2016. Group size, survival and surprisingly short lifespan in socially foraging bats. BMC Ecology 16:2.
Grange, S., F. Barnier, P. Duncan, J. M. Gaillard, M. Valeix, H. Ncube, S. Périquet, and H. Fritz. 2015. Demography of plains zebras (Equus quagga) under heavy predation. Population
Guindre-Parker, S., and D. R. Rubenstein. 2020. Survival benefits of group living in a fluctuating environment. The American Naturalist:708496.
Hamilton, W. D. 1971. Geometry for the selfish herd. Journal of Theoretical Biology 31:295– 311.
Harrison, X. A. 2014. Using observation-level randomeffects to model overdispersion in count data in ecology and evolution. PeerJ 2014:e616.
Isvaran, K. 2007. Intraspecific variation in group size in the blackbuck antelope: The roles of habitat structure and forage at different spatial scales. Oecologia 154:435–444.
Klingel, H. 1969. The Social Organisation and Population Ecology of the Plains Zebra (Equus Quagga). Zoologica Africana 4:249–263.
Krause, J., and G. D. Ruxton. 2002. Living in Groups. Oxford University Press.
Laake, J. L. 2013. RMark: An R Interface for Analysis of Capture-Recapture Data with MARK. Seattle.
Lebreton, J. D., J. D. Nichols, R. J. Barker, R. Pradel, and J. A. Spendelow. 2009. Chapter 3 Modeling Individual Animal Histories with Multistate Capture-Recapture Models. Academic Press Inc.
Lehtonen, J., and K. Jaatinen. 2016. Safety in numbers: the dilution effect and other drivers of group life in the face of danger. Behavioral Ecology and Sociobiology 70:449–458.
Lima, S. L. 1995. Back to the basics of anti-predatory vigilance: the group-size effect. Animal Behaviour 49:11–20.
Lima, S. L., and L. M. Dill. 1990. Behavioral decisions made under the risk of predation: a review and prospectus. Canadian Journal of Zoology 68:619–640.
Loveridge, A. J., M. Valeix, G. Chapron, Z. Davidson, G. Mtare, and D. W. Macdonald. 2016. Conservation of large predator populations: Demographic and spatial responses of African lions to the intensity of trophy hunting. Biological Conservation 204:247–254.
Majolo, B., A. de Bortoli Vizioli, and G. Schino. 2008. Costs and benefits of group living in primates: group size effects on behaviour and demography. Animal Behaviour 76:1235– 1247.
Markham, A. C., L. R. Gesquiere, S. C. Alberts, and J. Altmann. 2015. Optimal group size in a highly social mammal. Proceedings of the National Academy of Sciences 112:14882– 14887.
McGuire, B., L. L. Getz, and M. K. Oli. 2002. Fitness consequences of sociality in prairie voles, Microtus ochrogaster: influence of group size and composition. Animal Behaviour 64:645– 654.
Mills, M. G. L., and T. M. Shenk. 1992. Predator--Prey Relationships: The Impact of Lion Predation on Wildebeest and Zebra Populations. The Journal of Animal Ecology 61:693.
Molvar, E. M., and R. T. Bowyer. 1994. Costs and Benefits of Group Living in a Recently Social Ungulate: The Alaskan Moose. Journal of Mammalogy 75:621–630.
van Noordwijk, M. A., and C. P. van Schaik. 1999. The effects of dominance rank and group size on female lifetime reproductive success in wild long-tailed macaques,Macaca fascicularis. Primates 40:105–130.
Patin, R. 2018. Jeu spatial et interactions comportementales dans la relation prédateur-proie. Université de Montpellier.
Patin, R., D. Fortin, C. Sueur, and S. Chamaillé-Jammes. 2019. Space Use and Leadership Modify Dilution Effects on Optimal Vigilance under Food-Safety Trade-Offs. The American Naturalist 193:E15–E28.
Pays, O., P. J. Jarman, P. Loisel, and J. F. Gerard. 2007a. Coordination, independence or synchronization of individual vigilance in the eastern grey kangaroo? Animal Behaviour 73:595–604.
Pays, O., P.-C. Renaud, P. Loisel, M. Petit, J.-F. Gerard, and P. J. Jarman. 2007b. Prey
synchronize their vigilant behaviour with other group members. Proceedings of the Royal Society B: Biological Sciences 274:1287–1291.
Pays, O., E. Sirot, and H. Fritz. 2012. Collective Vigilance in the Greater Kudu: Towards a Better Understanding of Synchronization Patterns. Ethology 118:1–9.
Périquet, S., P. Richardson, E. Z. Cameron, A. Ganswindt, L. Belton, E. Loubser, and F. Dalerum. 2017. Effects of lions on behaviour and endocrine stress in plains zebras. Ethology 123:667–674.
Périquet, S., L. Todd-Jones, M. Valeix, B. Stapelkamp, N. Elliot, M. Wijers, O. Pays, D. Fortin, H. Madzikanda, H. Fritz, D. W. MacDonald, and A. J. Loveridge. 2012. Influence of
immediate predation risk by lions on the vigilance of prey of different body size. Behavioral Ecology 23:970–976.
Individual vigilance of African herbivores while drinking: the role of immediate predation risk and context. Animal Behaviour 79:665–671.
Pillay, N., and T. L. Rymer. 2017. Behavioural correlates of group size and group persistence in the African ice rat Otomys sloggetti robertsi. Behavioral Ecology and Sociobiology 71:62.
Pradel, R., C. M. A. Wintrebert, and O. Gimenez. 2003. A proposal for a goodness-of-fit test to the Arnason-Schwarz multisite capture-recapture model. Biometrics 59:43–53.
Pulliam, H. R. 1973. On the advantages of flocking. Journal of theoretical biology 38:419–22.
R Core Team. 2019. R: A Language and Environment for Statistical Computing. Vienna, Austria.
Rasa, O. A. E. 1989. The costs and effectiveness of vigilance behaviour in the dwarf mongoose: Implications for fitness and optimal group size. Ethology Ecology and Evolution 1:265– 282.
Risenhoover, K. L., and J. A. Bailey. 1985. Relationships between group size, feeding time, and agonistic behavior of mountain goats. Canadian Journal of Zoology 63:2501–2506.
Roberts, G. 1996. Why individual vigilance declines as group size increases. Animal Behaviour 51:1077–1086.
Robinson, J. G. 1988. Group size in wedge-capped capuchin monkeys Cebus olivaceus and the reproductive success of males and females. Behavioral Ecology and Sociobiology 23:187– 197.
Animal Behaviour 39:566–572.
Savage, A., L. Soto, F. Medina, G. Emeris, and J. Soltis. 2009. Litter size and infant survivorship in wild groups of cotton-top tamarins (Saguinus oedipus) in Colombia. American Journal of Primatology 71:707–711.
Schmitt, M. H., K. Stears, C. C. Wilmers, and A. M. Shrader. 2014. Determining the relative importance of dilution and detection for zebra foraging in mixed-species herds. Animal Behaviour 96:151–158.
Serrano, D., D. Oro, E. Ursua, and J. L. Tella. 2005. Colony size selection determines adult survival and dispersal preferences: allee effects in a colonial bird. The American naturalist 166:E22–E31.
Sibly, R. M. 1983. Optimal group size is unstable. Animal Behaviour 31:947–948.
Simpson, H. I., S. A. Rands, and C. J. Nicol. 2012. Social structure, vigilance and behaviour of plains zebra (Equus burchellii): A 5-year case study of individuals living on a managed wildlife reserve. Acta Theriologica 57:111–120.
Stander, P. E. 1992. Foraging dynamics of lions in a semi-arid environment. Canadian Journal of Zoology 70:8–21.
Therneau, T. M. 2020. A Package for Survival Analysis in R.
Treves, A. 2000. Theory and method in studies of vigilance and aggregation.
Turner, G. F., and T. J. Pitcher. 1986. Attack Abatement: A Model for Group Protection by Combined Avoidance and Dilution. The American Naturalist 128:228–240.
Ward, A., and M. Webster. 2016. Sociality: The behaviour of group-living animals. Springer International Publishing.
Waterman, J. M. 2002. Delayed maturity, group fission and the limits of group size in female Cape ground squirrels (Sciuridae: Xerus inauris). Journal of Zoology 256:113–120.
Watson, M., N. J. Aebischer, and W. Cresswell. 2007. Vigilance and fitness in grey partridges Perdix perdix: The effects of group size and foraging-vigilance trade-offs on predation mortality. Journal of Animal Ecology 76:211–221.
Table 1. Statistics for models of adult survival. Number of parameters (n), Akaike Information
Criterion corrected for small sample sizes (AICc), Δ-AICc, and deviance for the models fitted for adults. Bold lettering indicates the selected models. # Models for adult females are classified
using the Akaike Information Criterion corrected for over-dispersion (QAICc, Δ-QAICc and QDeviance). Effects tested on survival, detection, and transition probabilities are group size (gs) and season (s).
Survival Detection Transition n AICc# Δ-AICc# Deviance#
Adult males s gs+s gs 19 1749.94 0.00 1539.38 gs gs+s gs 21 1752.26 2.32 1537.32 gs+s gs+s gs 22 1752.28 2.34 1535.14 gs*s gs+s gs 25 1753.14 3.20 1529.33 Adult females s gs+s gs 12 1631.73 0.16 1382.76 gs gs+s gs 13 1631.58 0.00 1380.52 gs+s gs+s gs 14 1632.07 0.49 1378.93 gs*s gs+s gs 16 1635.63 4.06 1378.31
Table 2. Statistics for models of foal survival. Number of parameters (n), Akaike Information
Criterion corrected for small sample sizes (AICc), Δ-AICc, and deviance for the models fitted for foals. Bold lettering indicates the selected model. Effects tested on survival probabilities are group size (gs) and age-at-entry (a).
Model n AICc Δ-AICc Deviance
Foals Survival ~ gs + a 3 404.06 0.00 397.90
Figure 1. Distribution of harem sizes (without foals) across sightings (median=4, mean=4.26, 1st
Figure 2. Duration of vigilance bouts in relation to group size (without foals), for males (M),
lactating females (FL) and non-lactating females (FNL) in wet and dry seasons. Model predictions and 95% confidence envelopes are shown.
Figure 3. Duration of foraging bouts in relation to group size (without foals), for males (M),
lactating females (FL) and non-lactating females (FNL) in wet and dry seasons. Model predictions and 95% confidence envelopes are shown.
Figure 4. Proportion of times at least one individual is vigilant in the group in relation to group
size (without foals) in wet and dry seasons. Model predictions and 95% confidence envelopes are shown
APPENDIX S1
Camille Vitet, Patrick Duncan, Olivier Gimenez, Cheryl Mabika & Simon Chamaillé-Jammes
Plains zebras bring evidence that dilution and detection effects may not always matter behaviorally and demographically
We tested if categorizing harem sizes into different classes changed the selection of survival models. We tested two other classifications of harem sizes : (1) harems with 2 to 3, 4 to 6, and 7 and more individuals were classified as small, medium and large respectively (Tables S1-S2), and (2) harems with 2 to 3, 4, and 5 and more individuals were classified as small, medium and large respectively (Tables S3-S4). The comparison showed that the way we categorized group size did not affect our results qualitatively.
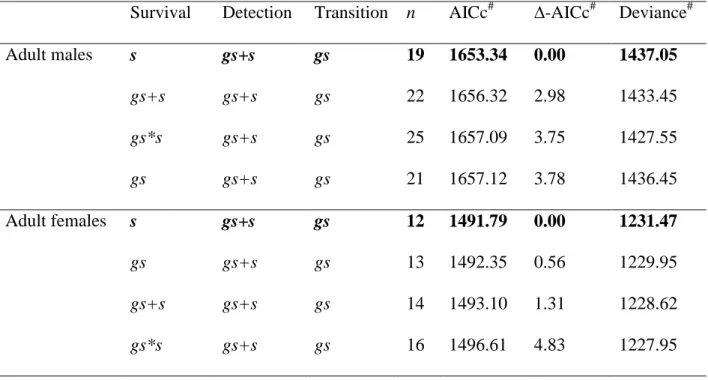
Table S1. Statistics for models of adult survival; harem sizes with 2 to 3, 4 to 6, and 7 and more
individuals are classified as small, medium and large respectively. Number of parameters (n), Akaike Information Criterion corrected for small sample sizes (AICc), Δ-AICc, and deviance for the models fitted for adults. Bold lettering indicates the selected models. # Models for adult females are classified using the Akaike Information Criterion corrected for over-dispersion (QAICc, Δ-QAICc and QDeviance). Effects tested on survival, detection and transition probabilities are group size (gs) and season (s).
Survival Detection Transition n AICc# ∆-AICc# Deviance#
Adult males s gs+s gs 19 1653.34 0.00 1437.05 gs+s gs+s gs 22 1656.32 2.98 1433.45 gs*s gs+s gs 25 1657.09 3.75 1427.55 gs gs+s gs 21 1657.12 3.78 1436.45 Adult females s gs+s gs 12 1491.79 0.00 1231.47 gs gs+s gs 13 1492.35 0.56 1229.95 gs+s gs+s gs 14 1493.10 1.31 1228.62 gs*s gs+s gs 16 1496.61 4.83 1227.95
Table S2. Statistics for models of foal survival; harem sizes with 2 to 3, 4 to 6, and 7 and more
individuals are classified as small, medium and large respectively. Number of parameters (n), Akaike Information Criterion corrected for small sample sizes (AICc), Δ-AICc, and deviance for the models fitted for foals. Bold lettering indicates the selected model. Effects tested on survival probabilities are group size (gs) and age-at-entry (a).
Model n AICc Δ-AICc Deviance
Foals Survival ~ a 1 406.90 0.00 404.88
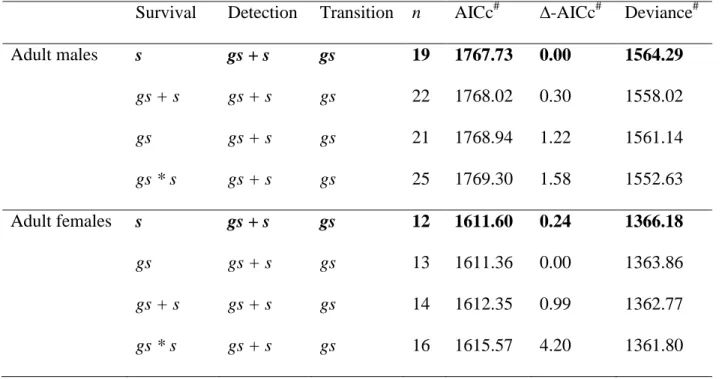
Table S3. Statistics for models of adult survival; harem sizes with 2 to 3, 4, and 5 and more
individuals are classified as small, medium and large respectively. Number of parameters (n), Akaike Information Criterion corrected for small sample sizes (AICc), Δ-AICc, and deviance for the models fitted for adults. Bold lettering indicates the selected models. # Models for adult
females are classified using the Akaike Information Criterion corrected for over-dispersion (QAICc, Δ-QAICc and QDeviance). Effects tested on survival, detection and transition probabilities are group size (gs) and season (s).
Survival Detection Transition n AICc# ∆-AICc# Deviance#
Adult males s gs + s gs 19 1767.73 0.00 1564.29 gs + s gs + s gs 22 1768.02 0.30 1558.02 gs gs + s gs 21 1768.94 1.22 1561.14 gs * s gs + s gs 25 1769.30 1.58 1552.63 Adult females s gs + s gs 12 1611.60 0.24 1366.18 gs gs + s gs 13 1611.36 0.00 1363.86 gs + s gs + s gs 14 1612.35 0.99 1362.77 gs * s gs + s gs 16 1615.57 4.20 1361.80
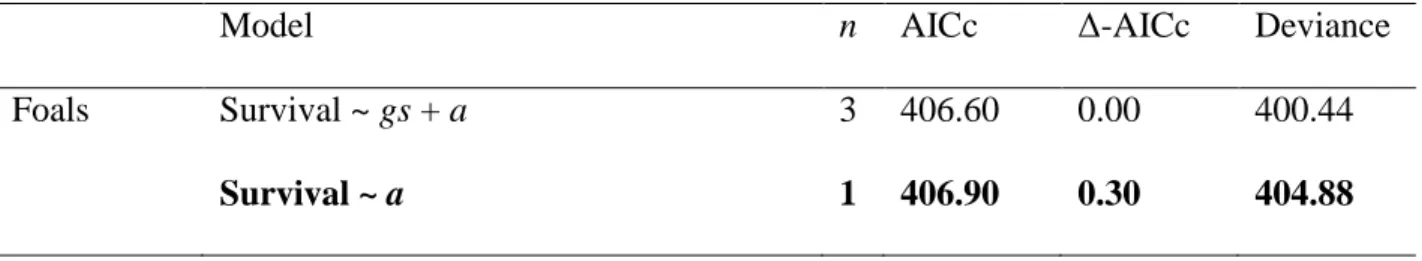
Table S4. Statistics for model of foal survival; harem sizes with 2 to 3, 4, and 5 and more
individuals are classified as small, medium and large respectively. Number of parameters (n), Akaike Information Criterion corrected for small sample sizes (AICc), Δ-AICc, and deviance for the models fitted for foals. Bold lettering indicates the selected model. Effects tested on survival probabilities are group size (gs) and age-at-entry (a).
Model n AICc Δ-AICc Deviance
Foals Survival ~ gs + a 3 406.60 0.00 400.44
APPENDIX S2
Camille Vitet, Patrick Duncan, Olivier Gimenez, Cheryl Mabika & Simon Chamaillé-Jammes
Plains zebras bring evidence that dilution and detection effects may not always matter behaviorally and demographically
We constructed encounter histories for all individuals based on initial observations of zebras and subsequent observations in the following capture occasions and the size/type of its group. We censured the encounter histories of individuals with “.” whenever we knew they were dead. In the CMR analysis, adult males and females could be observed in 5 different states {present in a small-size harem (state 1), present in a medium-size harem (state 2), present in a large-size harem (state 3), present in a bachelor group (state 4) (only for adult males), or dead (Ɨ)}.
Therefore, encounter histories were coded with 6 events at each capture occasions {not observed (0), observed in a small-size harem (1), observed in a medium-size harem (2), observed in a large-size harem (3), observed in a bachelor group (4), or dead (.)}. For instance, an individual with encounter history ‘40021’ is an individual that was seen in a bachelor group at first occasion, not observed during the two following sessions, observed on the fourth occasion in a medium-size harem, and then seen on the fifth occasion in a small-size harem.
t+1 : state 1 state 2 state 3 state 4 Ɨ t state 1 S1 0 0 0 1 – S1 = S state 2 0 S2 0 0 1 – S2 state 3 0 0 S3 0 1 – S3 state 4 0 0 0 S4 1 – S4 Ɨ 0 0 0 0 1
Figure S1. Survival matrix for adults. Grey row and column relate to adult males only.
0 1 2 3 4 . states state 1 1-P1 P1 0 0 0 0 = p state 2 1-P2 0 P2 0 0 0 state 3 1-P3 0 0 P3 0 0 state 4 1-P4 0 0 0 P4 0 Ɨ 1 0 0 0 0 0
t+1 : state 1 state 2 state 3 state 4 Ɨ t state 1 ψ11 ψ12 ψ13 Ψ14 0 = ψ state 2 ψ21 ψ22 ψ23 Ψ24 0 state 3 ψ31 ψ32 ψ33 Ψ34 0 state 4 Ψ41 Ψ42 Ψ43 Ψ44 0 Ɨ 0 0 0 0 1
APPENDIX S3
Camille Vitet, Patrick Duncan, Olivier Gimenez, Cheryl Mabika & Simon Chamaillé-Jammes
Plains zebras bring evidence that dilution and detection effects may not always matter behaviorally and demographically
We identified models with most support from the data using an AICc-based model selection. Number of parameters (n), Akaike Information Criterion corrected for small sample sizes (AICc), Δ-AICc, deviance, and marginal R-squared values (R²m) are shown.
Table S1. Duration of vigilance bouts in relation to group size (gs), season (s), a variable coding
for sex and reproductive status (sxrp), and other variables known to potentially affect vigilance (#). Bold lettering indicates the selected models.
Model * n AICc Δ-AICc Deviance R²m Harem Vigilance ~ sxrp * s + # 17 977.04 0.00 939.04 0.19 Vigilance ~ gs + sxrp * s + # 18 979.16 2.13 938.66 0.16 Vigilance ~ poly(gs,2) + sxrp * s + # 19 981.61 4.57 938.58 0.16 Vigilance ~ gs + sxrp + s + # 16 982.28 5.24 946.74 0.11 Vigilance ~ gs * s + sxrp + # 17 984.41 7.37 946.40 0.11 Vigilance ~ poly(gs,2) + sxrp + s + # 17 984.73 7.69 946.72 0.11 Vigilance ~ gs * sxrp + s + # 18 987.18 10.14 946.68 0.11 Vigilance ~ gs * sxrp * s + # 23 988.73 11.69 935.22 0.18 Vigilance ~ poly(gs,2) * s + sxrp + # 19 989.19 12.15 946.16 0.12 Vigilance ~ poly(gs,2) * sxrp + s + # 21 992.89 15.86 944.70 0.12 Vigilance ~ poly(gs,2) * sxrp * s + # 29 1002.89 25.85 932.54 0.19 Herd Vigilance ~ poly(gs,2) * s + sxrp + # 19 686.81 0.00 640.46 0.17
Vigilance ~ gs * s + sxrp + # 17 688.24 1.43 647.66 0.10 Vigilance ~ gs + sxrp + s + # 16 690.32 3.50 652.52 0.06 Vigilance ~ sxrp * s + # 17 690.70 3.89 650.12 0.08 Vigilance ~ poly(gs,2) + sxrp + s + # 17 691.96 5.15 651.38 0.07 Vigilance ~ gs * sxrp + s + # 18 693.42 6.60 649.98 0.08 Vigilance ~ gs + sxrp * s + # 18 693.45 6.63 650.02 0.08 Vigilance ~ poly(gs,2) + sxrp * s + # 19 695.31 8.50 648.96 0.09 Vigilance ~ gs * sxrp * s + # 23 698.97 12.16 640.28 0.16 Vigilance ~ poly(gs,2) * sxrp + s + # 21 699.00 12.19 646.62 0.11 Vigilance ~ poly(gs,2) * sxrp * s + # 29 710.64 23.82 631.16 0.24
#Other_sp + Foraging + Dist_cov + Dist_obs + Grass + Wind + (1|ID) + (1|ObsID)
* Vigilance = duration of the vigilance bout (in seconds), gs = size of the group (without foals), sxrp = sex and reproductive status of the individual (M for males, FNL for non-lactating females and FL for lactating females), s = season, Other_sp = presence/absence of other species within 50 m around the focal harem, Foraging = duration of the foraging bout that precedes the vigilance bout (in seconds), Dist_cov = distance to cover (in meters), Dist_obs = distance to observer (in meters), Grass = vegetation height (small, medium or tall), Wind = wind strength (none, low, medium or strong), (1|ID) = identity of the individual as random effect, (1|ObsID) = identity of the focal as random effect.
Table S2. Duration of foraging bouts in relation to group size (gs), season (s), a variable coding
for sex and reproductive status (sxrp), and other variables known to potentially affect foraging (#). Bold lettering indicates the selected models.
Model * n AICc Δ-AICc Deviance R²m Harem Foraging ~ gs * sxrp + s + # 18 1545.71 0.00 1505.18 0.20 Foraging ~ poly(gs, 2) * sxrp + s + # 21 1547.89 2.18 1499.47 0.23 Foraging ~ gs + sxrp + s + # 16 1550.96 5.25 1505.41 0.15 Foraging ~ gs * sxrp * s + # 23 1551.43 5.72 1497.87 0.23 Foraging ~ sxrp * s + # 17 1551.89 6.17 1513.86 0.15 Foraging ~ poly(gs, 2) + sxrp + s + # 17 1552.53 6.81 1514.50 0.15 Foraging ~ gs + sxrp * s + # 18 1552.82 7.10 1512.29 0.16 Foraging ~ gs * s + sxrp + # 17 1552.94 7.22 1514.91 0.15 Foraging ~ poly(gs, 2) + sxrp * s + # 19 1553.85 8.14 1510.78 0.17 Foraging ~ poly(gs, 2) * s + sxrp + # 19 1557.42 11.70 1514.35 0.15 Foraging ~ poly(gs, 2) * sxrp * s + # 29 1561.05 15.33 1490.62 0.27 Herd Foraging ~ sxrp * s + # 17 1036.30 0.00 995.72 0.22 Foraging ~ gs * s + sxrp + # 17 1037.89 1.59 997.31 0.21 Foraging ~ gs + sxrp * s + # 18 1038.90 2.60 995.47 0.22 Foraging ~ gs + sxrp + s + # 16 1039.00 2.70 1001.22 0.18 Foraging ~ poly(gs, 2) + sxrp * s + # 19 1039.94 3.63 993.58 0.24 Foraging ~ poly(gs, 2) + sxrp + s + # 17 1040.12 3.81 999.54 0.19 Foraging ~ poly(gs, 2) * s + sxrp + # 19 1042.52 6.22 996.17 0.22 Foraging ~ gs * sxrp * s + # 23 1042.66 6.36 983.97 0.31 Foraging ~ gs * sxrp + s + # 18 1043.20 6.90 999.77 0.19 Foraging ~ poly(gs, 2) * sxrp + s + # 21 1047.72 11.41 995.34 0.23 Foraging ~ poly(gs, 2) * sxrp * s + # 29 1059.59 23.28 980.11 0.34
#Others_sp + Vigilance + Dist_cov + Dist_obs + Grass + Wind + (1|ID) + (1|ObsID)
* Foraging = duration of the foraging bout (in seconds), gs = size of the group (without foals), sxrp = sex and reproductive status of the individual (M for males, FNL for non-lactating females and FL for lactating females), s = season, Other_sp = presence/absence of other species within 50 m around the focal harem, Vigilance = duration of the vigilance bout that precedes the foraging bout (in seconds), Dist_cov = distance to cover (in meters), Dist_obs = distance to observer (in meters), Grass = vegetation height (small, medium or tall), Wind = wind strength (none, low, medium or strong), (1|ID) = identity of the individual as random effect, (1|ObsID) = identity of the focal as random effect.
Table S3. Proportion of times at least one individual is vigilant in the group in relation to group
size (gs), season (s) and other variables known to potentially affect vigilance (#). Bold lettering indicates the selected models.