HAL Id: hal-02961805
https://hal.archives-ouvertes.fr/hal-02961805
Submitted on 14 Nov 2020
HAL is a multi-disciplinary open access
archive for the deposit and dissemination of
sci-entific research documents, whether they are
pub-lished or not. The documents may come from
teaching and research institutions in France or
abroad, or from public or private research centers.
L’archive ouverte pluridisciplinaire HAL, est
destinée au dépôt et à la diffusion de documents
scientifiques de niveau recherche, publiés ou non,
émanant des établissements d’enseignement et de
recherche français ou étrangers, des laboratoires
publics ou privés.
Use of Normalized Correlation Function to Discriminate
Outcome of Persistent Patients Undergoing Electrical
Cardioversion
Olivier Meste, Stef Zeemering, Joël Karel, Theo Lankveld, Ulrich Schotten,
Harry Crijns, Ralf Peeters, Pietro Bonizzi
To cite this version:
Olivier Meste, Stef Zeemering, Joël Karel, Theo Lankveld, Ulrich Schotten, et al.. Use of Normalized
Correlation Function to Discriminate Outcome of Persistent Patients Undergoing Electrical
Cardiover-sion. Computing in Cardiology, Sep 2020, Rimini, Italy. �hal-02961805�
Use of Normalized Correlation Function to Discriminate Outcome of Persistent
Patients Undergoing Electrical Cardioversion
Olivier Meste
1, Stef Zeemering
2Jo¨el Karel
4, Theo Lankveld
2,3, Ulrich Schotten
2, Harry Crijns
3,
Ralf Peeters
4, Pietro Bonizzi
41
Laboratoire I3S, UNSA-CNRS, Nice, France
2
Department of Physiology, Maastricht University Medical Center, Maastricht, The Netherlands
3Department of Cardiology, Maastricht University Medical Center, Maastricht, The Netherlands
4Department of Data Science and Knowledge Engineering, Maastricht University, Maastricht,
The Netherlands
Abstract
Atrial activity (AA) during atrial fibrillation (AF) is a process characterized by different short- and long-term re-current behaviors. In this work we hypothesize that the features derived from these behaviors contain an informa-tion on the lead locainforma-tions that discriminate the most be-tween persistent AF patients recurring after electrical car-dioversion from those who do not. Body surface potential maps (BSPMs, 184 electrodes) were recorded in 63 pa-tients in persistent AF prior to electrical cardioversion (32 recurrences after 4-6 weeks). A correlation function (CF) was computed for each electrode, and normalized in order to make it independent of its magnitude. Finally, the first min and max values of the normalized CF from each elec-trode were used to discriminate patients outcome. The cor-responding spatial maps showed that electrodes with the largest values of normalized CF are located on the front of the torso, centered around V1. A Wilcoxon rank-sum test was used to compare maps of recurrent and non-recurrent AF patients and find electrodes with significantly differ-ent magnitude. A significant difference was observed on the upper and lower parts of the torso, with higher val-ues for the non-recurrent AF patients (higher recurrence of the underlying AA propagation patterns). When looking at the energy computed on each electrode, this parameter was not able to distinguish among the two groups.
1.
Introduction
Although under the scope of many studies and re-searches, the characterization of atrial fibrillation (AF) is still an open field, especially when the goal is the strati-fication for guiding AF therapy [1]. This guidance could be the targeting of the ablation sites by using information recorded non-invasively. In [3],[2], we intended to
com-pute a recurrence AA signal based on a multidimensional autocorrelation function. Thus, novel insights in AA dur-ing AF have been proposed, in line with the underlydur-ing cardiac electrophysiology. However, these outcomes don’t allow by nature an accurate spatial analysis, e.g., at the level of the recording electrode.
In this study, we decompose the multidimensional cor-relation to introduce the role of individual corcor-relation func-tions, i.e., for each electrode. Features are extracted from these functions and the corresponding spatial maps are compared. Results shows how relevant is this approach and paves the road to a non-invasive spatial discrimina-tion of non-recurrent AF subjects from recurrent ones. Al-though this discrimination is not the ultimate goal, because it is based on spatial parameters it shows that relevant in-formation can be extracted from each electrodes taken sep-arately.
2.
Methods
2.1.
BSPM data and pre-processing
BSPMs were recorded in 63 patients in persistent AF using a custom configuration of 184 leads with 120 ante-rior and 64 posteante-rior leads (ActiveTwo BSM Panels Car-bon Electrodes, Biosemi B.V., The Netherlands). All pa-tients underwent electrical cardioversion. After a blank-ing period from 4 to 6 weeks after procedure, 32 patients showed AF recurrence (labeled R) and 31 remained un-der sinus rhythm (labeled NR). ECGs were sampled at 256Hz. A one-minute segment was selected for each subject, low-quality leads were excluded (low signal-to-noise ratio, poor electrode contact, motion artefacts), and Wilsons Central Terminal was subtracted in line with con-ventional ECG analysis. After band-pass filtering the sig-nals between 1 and 100Hz (3rd order Chebyshev), QRST
cancellation was performed using an adaptive singular value decomposition method, inspired by the approach in [4], with multiple QRST window templates defined using hierarchical clustering. The extracted atrial signals were post-filtered with a zerophase notch filter at 50Hz to sup-press power line noise, and with a 3Hz zero-phase high-pass filter (3rd order Chebyshev) to remove low-frequency residuals not related to (persistent) AF.
2.2.
Normalized Correlation Function
As published in [3], the nonstationary properties of non-invasive AA can be investigate by using a multivariable au-tocorrelation function of the spatial AA oscillatory patterns which provides a patient’s specific recurrence signal. The spatial information is provided by the multiple observa-tions of a single behavior by using electrodes mapping the torso. The autocorrelation function is based on the compu-tation of elements Ri,jdefined by :
Ri,j=
x(i)Tx(i + j − 1) ||x(i)||2||x(i + j − 1)||2
(1)
with vector x(n), n = 1, . . . , N represents the overall spa-tial AA from all electrodes l, l = 1, . . . , L, for a given time n. The corresponding multivariable autocorrelation func-tion is, in turn, given by :
r(p) = 1 M M X i=1 Ri,p+1 (2)
Where M M is the window size of the analysis (M N). This function has been shown to efficiently exhibit short and long term behaviors characterizing AA. In fact, the inner product x(i)Tx(i + j − 1) is a linear combination of the contribution of each electrodes, that isP
lxl(i)xl(i +
j − 1). Then r(p) can be rewritten as :
r(p) = 1 M M X i=1 P lxl(i)xl(i + p) ||x(i)||2||x(i + p)||2 (3)
From that expression it can be concluded that the global autocorrelation function is not simply the averaging of in-dividual monodimensional autocorrelation function :
rl(p) = 1 M M X i=1 xl(i)xl(i + p) (4)
but rather a non trivial weighted contribution of them. However, it appears that since the rl(p)’s participate to
the spatially computed information it is probable that they individually produce exploitable features to distinguish R from NR population. Each rl(p) being related to one
elec-trode contribution, it is expected that these features will
inform on the corresponding discrimination spatially de-fined. In order to get rid of the amplitude variabilities ob-served from one lead to another, a normalized version of (4) is preferred such that rl(0) = 1 for all l.
In line with the discriminative features proposed in [3], the first min and max values of all the normalized rl(p)’s
are computed for each patients of the groups R and NR. In addition to this analysis, the energy of each electrode is also computed to check its power in discriminating be-tween R and NR. This comparison is consistent with the correlation analysis because in both cases a second order metric is involved. Note that for the non normalized corre-lation the energy is equal to rl(0).
3.
Analyses and Results
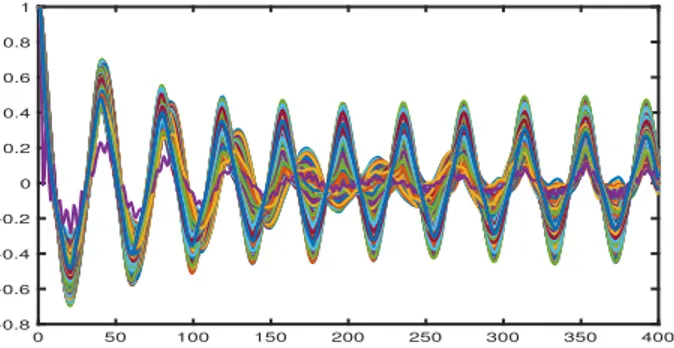
Both analyses have been performed on the two groups of subjects, according to the R and NR classification. For the autocorrelation based method the two relevant features for each electrode and subject are the first abs(M in) and M ax values. In order to exemplify the approach, in fig. (1) and fig. (2) are given all the rl(p)’s for a NR (#29) and
R (#45) subjects, respectively. 0 50 100 150 200 250 300 350 400 -0.8 -0.6 -0.4 -0.2 0 0.2 0.4 0.6 0.8 1
Figure 1. The rl(p)’s for the AF non-recurrent subject #29
0 50 100 150 200 250 300 350 400 -0.4 -0.2 0 0.2 0.4 0.6 0.8 1
Figure 2. The rl(p)’s for the AF recurrent subject #45
The corresponding spatial maps are given in fig. (3) and fig. (4) where a difference in magnitude and distribution is visible. The location of the maximum value of each map, marked by a bold black circle, is also different, but in the vicinity of V1.
0 0.1 0.2 0.3 0.4 0.5 0.6 0.7
Figure 3. The spatial distribution of the abs(M in) values extracted from the rl(p)’s for the AF non-recurrent subject #29. Red circle and bold black circle pinpoint the V1 electrode and the maximum value of the map, respectively.
0 0.1 0.2 0.3 0.4 0.5 0.6 0.7
Figure 4. The spatial distribution of the abs(M in) values extracted from the rl(p)’s for a AF recurrent subject #45. Red circle and bold black circle pinpoint the V1 electrode and the maximum value of the map, respectively.
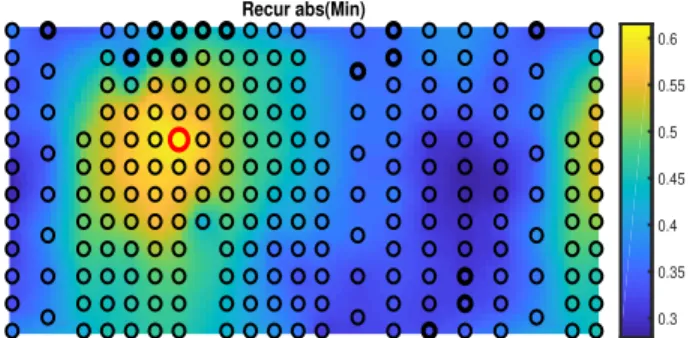
In order to globally compare the two groups (R and NR), the median spatial maps for the two features (abs(M in) and M ax) and the two groups are given in fig. (5), fig. (6), fig. (7), fig. (8). Firstly, it can be noticed that regardless the mean map the greatest values are concentrated around V1, in agreement with the key role played by this electrode. Secondly, a Wilcoxon rank sum test for equal medians is performed to distinguish the electrodes with the highest power to discriminate the NR from the R groups. Even though the maps of the NR group tend to be higher than the ones from the R group (consistent with results in [3]), it appears that upper and lower electrodes significantly dis-criminate the most, covering the relevant area above the atria. It is worth noticing that the multiple comparisons are not corrected.
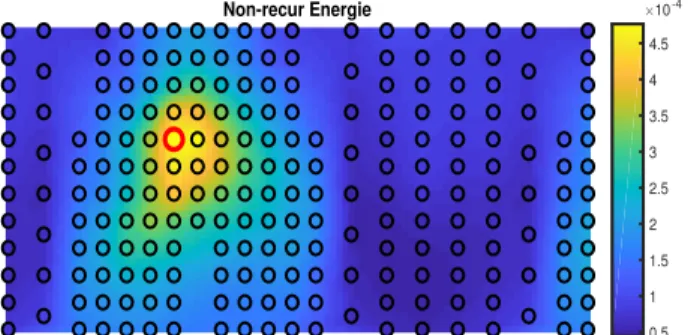
For the feature based on electrodes energy, spatial maps are given in fig. (9) and fig. (10), for the two groups. Similarly to the previous analysis, the energy is centered around electrode V1. There is a slight difference of the distributions but in that case the energy of the NR group doesn’t tend to be higher, especially around V1 (not illus-trated here). The Wilcoxon rank sum test for equal medi-ans applied to all electrodes did not show any significant differences between the two groups.
Non-recur abs(Min) 0.35 0.4 0.45 0.5 0.55 0.6
Figure 5. The mean spatial distribution of the abs(M in) values of the AF non-recurrent group. Red circle and bold black circles pinpoint the V1 electrode and the locations of significant (p<0.05) difference between NR and R groups, respectively.
Recur abs(Min) 0.3 0.35 0.4 0.45 0.5 0.55 0.6
Figure 6. The mean spatial distribution of the abs(M in) values of the AF recurrent group. Red circle and bold black circles pinpoint the V1 electrode and the locations of significant (p<0.05) difference between NR and R groups, respectively.
Non-recur Max 0.3 0.35 0.4 0.45 0.5 0.55
Figure 7. The mean spatial distribution of the M ax values of the AF non-recurrent group. Red circle and bold black circles pinpoint the V1 electrode and the locations of significant (p<0.05) difference between NR and R groups, respectively.
4.
Conclusions
This study proposed a spatial analysis of the autocorrela-tions computed from each electrode. The overall outcomes are in agreement with cardiac electrophysiology where in-formation about AA during AF is expected to be better captured by V1. In addition, taken separately the proposed features emphasized the role of the upper and lower elec-trodes for the discrimination of R from NR subjects. For the upper electrodes, this could be explained by the
prox-Recur Max 0.25 0.3 0.35 0.4 0.45 0.5 0.55
Figure 8. The mean spatial distribution of the M ax values of the AF recurrent group. Red circle and bold black circles pinpoint the V1 electrode and the locations of significant (p<0.05) difference between NR and R groups, respectively.
Non-recur Energie 0.5 1 1.5 2 2.5 3 3.5 4 4.5 10-4
Figure 9. The mean spatial distribution of the Energy for the AF non-recurrent group. Red circle pinpoints the V1 electrode.
Recur Energie 1 2 3 4 5 10-4
Figure 10. The mean spatial distribution of the Energy for the AF recurrent group. Red circle pinpoints the V1 electrode.
imity with the pulmonary veins often at the origin of AF. In contrast, the energy of each electrode failed for this dis-crimination. This could be explained by the inability of this metric to capture subtle variations unlike what is per-formed by the autocorrelation based features.
References
[1] Kirchhof P, Calkins H. Catheter ablation in patients with persistent atrial fibrillation. Eur Heart J ,2017;38(1):2026 [2] Bonizzi P, Zeemering S, Karel J, Azman M, Lankveld T,
Schotten U, Crijns H, Peeters R, Meste O. Noninvasive characterisation of short- and long-term recurrence of atrial
signals during persistent atrial fibrillation. Conf Proc Comp in Card, 2017;p 44
[3] Bonizzi P, Meste O, Zeemering S, Karel J, Lankveld T, et al.. A Novel Framework for Noninvasive Analysis of Short-Term Atrial Activity Dynamics During Persistent Atrial Fibrillation. Medical and Biological Engineering and Com-puting, Springer Verlag, 2020;58:19331945.
[4] Alcaraz R, Rieta JJ. Adaptive singular value cancellation of ventricular activity in single-lead atrial fibrillation electro-cardiograms. Physiol Meas, 2008;29:13511369.
Address for correspondence: Pr. Olivier MESTE
Laboratoire I3S - CNRS - UNS 2000 route des Lucioles
06903 Sophia Antipolis cedex, FRANCE E-mail address: [email protected]