HAL Id: insu-01133376
https://hal-insu.archives-ouvertes.fr/insu-01133376
Submitted on 3 Jul 2015HAL is a multi-disciplinary open access
archive for the deposit and dissemination of sci-entific research documents, whether they are pub-lished or not. The documents may come from teaching and research institutions in France or abroad, or from public or private research centers.
L’archive ouverte pluridisciplinaire HAL, est destinée au dépôt et à la diffusion de documents scientifiques de niveau recherche, publiés ou non, émanant des établissements d’enseignement et de recherche français ou étrangers, des laboratoires publics ou privés.
Gueorgui Ratzov, A. Cattaneo, Nathalie Babonneau, Jacques Déverchère, K.
Yelles, R. Bracene, F. Courboulex
To cite this version:
Gueorgui Ratzov, A. Cattaneo, Nathalie Babonneau, Jacques Déverchère, K. Yelles, et al.. Holocene turbidites record earthquake supercycles at a slow-rate plate boundary. Geology, Geological Society of America, 2015, 43 (4), pp.331-334. �10.1130/G36170.1�. �insu-01133376�
DOI:10.1130/G36170.1
Holocene turbidites record earthquake supercycles at slow
1
rate plate boundary
2
Gueorgui Ratzov1,2*, Antonio Cattaneo2, Nathalie Babonneau1, Jacques
3
Déverchère1, Karim Yelles3, Rabah Bracene4, and Françoise Courboulex5
4
1Université de Brest, CNRS UMR 6538, Domaines Océaniques, IUEM, 29280 Plouzané, 5
France
6
2IFREMER, Géosciences Marines–EDROME, 29280 Plouzané, France 7
3Centre de Recherche en Astronomie Astrophysique et Géophysique, 16006 Algiers, 8
Algeria
9
4SONATRACH Exploration, 35000 Boumerdès, Algeria 10
5Géoazur, Université de Nice/Sophia-Antipolis, CNRS, Observatoire de la Côte d’Azur, 11
06560 Valbonne, France
12
*Current address: Géoazur, Université de Nice/Sophia-Antipolis, CNRS, Observatoire de 13
la Côte d’Azur, 06560 Valbonne, France 14
ABSTRACT
15
Ongoing evidence for earthquake clustering calls upon records of numerous 16
earthquake cycles to improve seismic hazard assessment, especially where recurrence 17
times overstep historical records. We show that most turbidites emplaced at the Africa-18
Eurasia plate boundary off west Algeria over the past ~8 k.y. correlate across sites fed by 19
independent sedimentary sources, requiring a regional trigger. Correlation with 20
paleoseismic data inland and ground motion predictions support that M ~7 earthquakes 21
have caused them. The bimodal distribution of paleo-events supports the concepts of 22
DOI:10.1130/G36170.1
earthquake supercycles and rupture synchronization between nearby faults: thirteen 23
paleo-earthquakes underpin clusters of 3–6 events with recurrence intervals of ~300–600 24
yr, separated by periods of quiescence of ~1.6 k.y. without major events on other faults 25
over the study area. This implies broad phases of strain loading alternating with phases of 26
strain release. Our results suggest that fault slip rates are time-dependent and call upon 27
revising conventional seismic hazard models. 28
INTRODUCTION
29
Earthquake time series reveal that rupture occurrence depends on the history of 30
the causative fault, but also of adjacent ones (Stein, 1999; Scholz, 2010). Two main 31
limitations however exist in outcrop study of faults: the scarce access to faults and the 32
short time span of earthquake time series. Chronostratigraphy of earthquake-triggered 33
turbidites provides insightful paleoquake records in subduction zones (Goldfinger et al., 34
2003) and helps overcoming these limitations. 35
Turbidite paleoseismology relies on the fact that significant seafloor shaking 36
during large earthquakes promotes multiple and widespread turbidity currents, depositing 37
greater sediment volumes (Goldfinger et al., 2003 and references therein) than those 38
triggered by climatic events (Einsele et al., 1996). A widespread synchronous trigger is a 39
key assumption for reconstructing paleo-earthquake records. Synchroneity is established 40
by counting, dating and correlating deposits in independent channels (Goldfinger et al., 41
2003), basins (Gràcia et al., 2010) or sedimentary systems (Pouderoux et al., 2014). 42
Turbidite stratigraphy is a powerful tool to characterize the complex and 43
multiscale seismic behavior of megathrusts and to evidence supercycles and superquakes 44
(Goldfinger et al., 2013). However, the behavior of slow-rate plate boundaries has 45
DOI:10.1130/G36170.1
received little attention despite high seismic risks and patchy knowledge of full seismic 46
cycles. We aim to reconstruct thousand-year-long time-series of paleoquakes that 47
triggered largeturbidity flows in a low seismicity rate setting, and highlight the cycling of 48
earthquakes at a slow convergence plate boundary. 49
REGIONAL SETTING
50
The Algerian margin is located at the diffuse boundary of the African plate 51
converging at 3–6 mm yr-1 toward Eurasia (Stich et al., 2006). The 1954 Ms 6.7
52
Orléansville earthquake and the 2003 Mw 6.8 Boumerdes earthquake triggered
53
widespread turbidity flows documented by submarine cable breaks (Heezen and Ewing, 54
1955; Cattaneo et al., 2012), supporting a turbidite paleoseismology approach. The area 55
of the Orléansville and El Asnam earthquakes (Fig. 1) is a ~150-km-long margin segment 56
where strain is located inland along northeast-southwest strike-slip faults and landward-57
verging thrusts and folds (Beldjoudi et al., 2011). The main active tectonic feature is the 58
El Asnam Fault System (EAFS) forming a complex set of deep ramps connecting 59
laterally, followed upwards by fault-propagation folds (Avouac et al., 1992). The 1954 60
Ms6.7 Orléansville earthquake likely occurred along the deepest ramp without breaking
61
the surface. In contrast, the 1980 Ms 7.3 El Asnam earthquake ruptured a ~30-km-long
62
frontal scarp (Meghraoui et al., 1988). The El Asnam earthquake did not trigger 63
widespread turbidity currents, since no submarine cable broke offshore, except a single 64
cable ~200 km eastward (El Robrini et al., 1985). From available surface faulting 65
(Beldjoudi et al., 2011) and historical seismicity (Boughacha et al., 2004), whether other 66
faults than the EAFS can produce M >6.5 earthquakes in this part of Algeria is unclear. 67
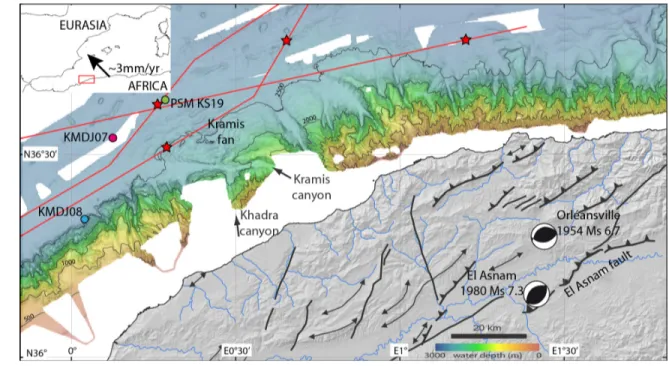
Offshore El Asnam, the eastern continental slope is 3–4° steep, dominated by the Kramis 68
DOI:10.1130/G36170.1
fan, fed by the Kramis and Khadra canyons (Fig. 1). The canyons are obliquely oriented 69
(N170 and N090) and build an asymmetric 800-m-high levee (Babonneau et al., 2012). 70
Westward and eastward, the slope is steeper (up to ~16°) and shows numerous slump 71
scars and gullies. No large active faults are observed offshore. 72
METHODS
73
Scientific Rationale
74
To infer the seismic trigger of turbidites, we test their synchroneity in three cores 75
collected in two independent sedimentary systems (Fig. 1; Fig. DR1 in the GSA Data 76
Repository1). Core site KMDJ07 (2630 m below sea level, mbsl) is fed by turbidity flows
77
coming from the Kramis turbidite system, whereas core KMDJ08 (2631 mbsl) samples 78
the margin toe and collects only turbidity currents originated from the overhanging slope. 79
To avoid any local or climatically triggered turbidites (flood, hyperpycnal flow) that 80
usually depict short runouts (Einsele et al., 1996), we collected core PSMKS19 (2626 81
mbsl) in the distal part of the Kramis fan (Fig. 1). As it is close to a A.D. 1954 cable 82
break, it stands on the path of the earthquake-triggered turbidity currents. We then 83
compare our record with the paleoseismic one on the El Asnam fault scarp (Meghraoui et 84
al., 1988). 85
Combined effects of lower sea level before ca. 8 ka and wetter conditions in the 86
Maghreb from the Bølling-Allerød stage (14.7–12.7 ka BP) to ca. 8 k.y. B.P. (Barcena et 87
al., 2001) favored the connection between river mouths and canyons, and the formation 88
of hyperpycnal flows able to reach the coring sites. We thus limited our investigation to 89
the past ~8 k.y. when the sea level was high and climate was drier and more stable, a 90
period less favorable to the climatic triggering of large turbidity flows. 91
DOI:10.1130/G36170.1
Sediment Analyses and Dating
92
We measure gamma density, porosity and magnetic susceptibility each centimeter 93
on the cores. We split them for description, photography, X-Ray imagery, magnetic 94
susceptibility, and laser granulometry. Finally, we measure composition of major 95
elements by X-Ray fluorescence (XRF) (Fig. 2; Figs. DR2 and DR3). Dating turbidites 96
requires calculating the hemipelagic accumulation rate between successive 14C ages dated
97
on planktonic foraminifers (Fig. DR4) by substracting all turbidites. We calibrate the 98
radiocarbon dates, built age/depth models, and thus calculate the age of each turbidite 99
(OxCal software; Figs. DR5–DR7). We choose an interpolation parameter allowing 100
heterogeneous sediment deposition to account for possible erosion at the base of each 101
turbidite that we cannot quantify. 102
RESULTS AND INTERPRETATIONS
103
The three cores KMDJ07, KMDJ08, and PSM-KS19 show alternating light-to-104
dark olive beige, poorly sorted bioclastic silty clay, interpreted as background 105
hemipelagic deposits, and dark olive gray to olive beds with a sharp, sometimes erosive 106
silty base and a fining-upward grain-size trend. These beds are interpreted as 107
instantaneous turbiditic deposits (Fig. 2; Figs. DR1–DR3). The top of turbidites is 108
determined by the analysis of several proxies. In Northern Algeria, the watersheds are 109
mainly calcareous, resulting into relatively low contrasts in carbonated content between 110
turbidites tails and hemipelagites based on Ca/Fe ratios (biogenic vs detrital fluxes) (Fig. 111
2b). This limits the use of variation in magnetic susceptibility, density or geochemical 112
composition often used for accurate identification of turbidites (Goldfinger et al., 2003; 113
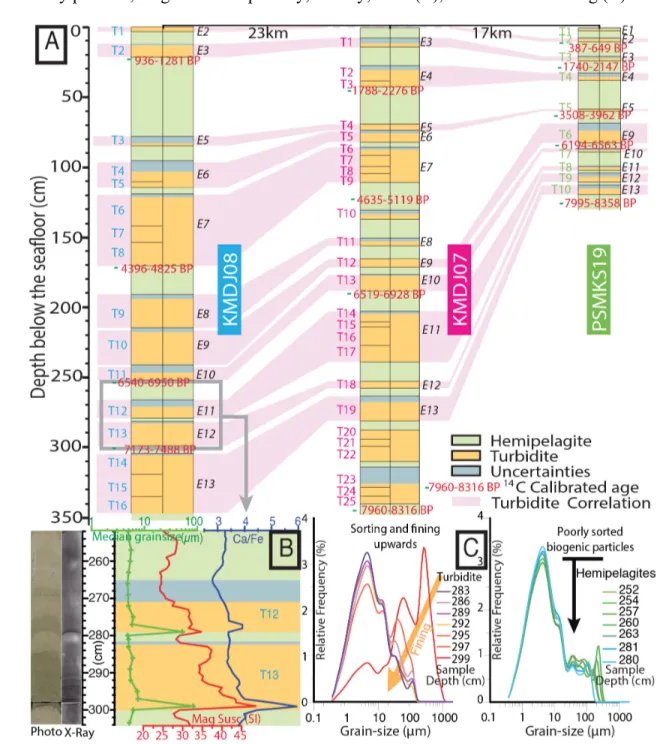
Gràcia et al., 2010). Moreover, sediment sorting (Fig. 2c) reveals normally graded 114
DOI:10.1130/G36170.1
turbidites with a coarse base (up to 1000 µm) fining upwards to silts and clays. The grain 115
size distribution supports well-sorted deposits. Contrastingly, most hemipelagites are 116
unsorted and show a plateau for grain size comprised between ~30 and >300 µm 117
associated to biogenic particles (Fig. 2c). This criterion appears more reliable for 118
discriminating turbidites from hemipelagites when the compositional contrast is low 119
(Ratzov et al., 2010). Where discrimination remains uncertain (e.g., sediment mixing by 120
bioturbation), we consider the interval as an uncertainty included in the age model (Fig. 121
2; Figs. DR2 and DR3). 122
Turbidites may be stacked without intervening hemipelagites in proximal cores 123
KMDJ07 and KMDJ08. Such stacks may reflect: (1) simultaneous slope failures during 124
an earthquake, (2) large aftershocks or earthquakes occurring closely in space and time, 125
(3) pulses and flow discontinuities in the turbidity current (Van Daele et al., 2013) or (4) 126
seafloor erosion of hemipelagites by the coarse fraction of the subsequent turbidite 127
(Goldfinger et al., 2003). Since we hardly discriminate among these scenarii, we consider 128
a single trigger when stacks contain no hemipelagites, and multiple triggers where the 129
presence of hemipelagites is unclear. 130
We define an event (E) as a turbidite or a stack of turbidites that either 131
corresponds to a historical earthquake or is synchronous in at least two cores. We identify 132
13 events based on turbidite correlation with overlapping age error bars across two or 133
three cores (Figs. 2 and 3). Although the error bars of events may overlap, the 134
stratigraphy of deposits allows establishing the number of events. Seven events are 135
retrieved in all cores (E3, E5, E9, E10, E11, E12, and E13), five correlate across two 136
DOI:10.1130/G36170.1
cores (E2 and E4 collected in the same system, E6, E7, and E8), and only two turbidites 137
are single ones: T1 in core PSMKS19 (E1) and T10 in core KMDJ07 (Fig. 2a). 138
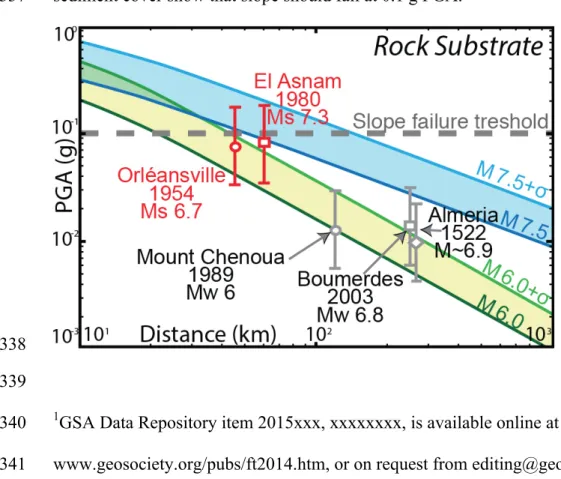
Ground motion prediction equations applied to our case study show that M >6.5 139
earthquakes are required to produce a peak ground acceleration (PGA) sufficient to 140
promote slope failures (Fig. 4; Fig. DR8). Our study should therefore trace the cycling of 141
M >6.5 earthquakes occurring approximately within the area mapped in Figure 1. 142
DISCUSSION AND CONCLUSION
143
From Turbidites to Paleo-Earthquakes
144
The greater amount of turbidites in more proximal cores (Fig. DR1) suggests that 145
turbidites in our cores are not linked to climatic events (floods, hyperpycnal flows) that 146
usually depict short runouts. Instead, the clear synchroneity of at least seven groups of 147
turbidites supports a regional trigger that we interpret as coseismic. Although visible in a 148
single core, turbidite T1 of core PSMKS19 has an error bar (0–460 yr) that includes the 149
age of the 1954 Orléansville earthquake and is located near a cable break (Heezen and 150
Ewing, 1955). As no large (M >6.5) historical events occurred in the area during the 0– 151
460 yr time span (Boughacha et al., 2004), T1 likely corresponds to the 1954 earthquake. 152
The lack of events E1 in cores KMDJ07 and KMDJ08, and E2 in core KMDJ07, likely 153
results from the loss of the uppermost deposits in the piston corer. Conversely, the lack of 154
turbidites coeval with T10 in Core KMDJ07 cannot be caused by sampling limitations. 155
Because T10 occurs ~500 yr after the previous earthquake, the slope was most likely 156
reloaded with sediments, thus the lack of coeval record in other cores supports that T10 is 157
local and not triggered by a large earthquake. 158
DOI:10.1130/G36170.1
The strongest argument to interpret the turbidites as coseismic is their correlation 159
with independent paleoseismic data inland (Sumner et al., 2013), here, the El Asnam fault 160
scarp, the greatest fault in the area. At least eight out of nine paleoquakes are coeval with 161
the submarine record within their error bars (all events except E7, Fig. 3). This clear 162
correlation suggests that ruptures on the El Asnam fault triggered these turbidites. 163
However, other faults in the area may have triggered the turbidites in case they ruptured 164
almost synchronously (i.e., within few decades) with the El Asnam paleoquakes. Indeed, 165
although the error bar of Event E1 overlaps both 1954 and 1980 earthquakes, only the 166
first one triggered turbidity flows in the area (Heezen and Ewing, 1955). Sediment prone 167
to failure was probably flushed during the earlier earthquake, thus lowering the 168
probability of a subsequent failure. Similarly, the slight asynchrony of Event E7 with the 169
El Asnam paleo-earthquake (<100 yr) may result from bursts of activity on nearby faults. 170
Therefore, it is impossible to assign a turbidite to a specific fault segment, and the 171
number of large earthquakes may exceed the number of turbidites found (i.e., a single 172
turbidite may hide multiple earthquakes). Still, the nine ruptures identified on the El 173
Asnam fault scarp remarkably match the nine widespread turbidites deposited within very 174
short time spans. Turbidites triggered by earthquakes from active faults located in other 175
regions (e.g., the Iberian margin) have no chance to reach our area, given (1) the large 176
distance (>250 km) of our coring sites to canyons and major faults of Iberia (Gràcia et al., 177
2006), and (2) the depth of coring, significantly less than the deepest basin floor 178
(Babonneau et al., 2012). 179
Earthquake Recurrences and Supercycles
DOI:10.1130/G36170.1
Although the turbidite record is incomplete for earthquakes occurring closely in 181
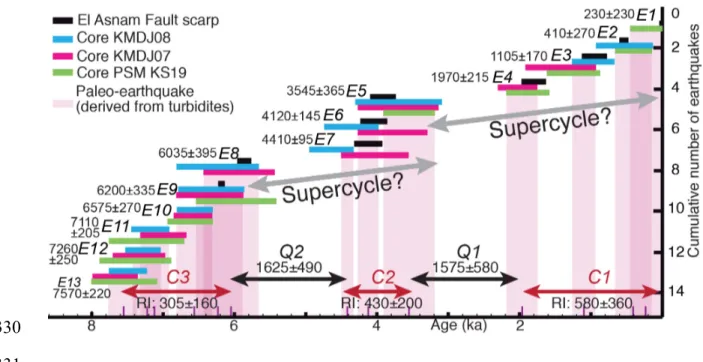
time (a few decades), the 13 paleo-events identified define three clusters of seismicity 182
(Fig. 3): C1 (4 events in 1800 ± 250 yr), C2 (3 events in 850 ± 260 yr), and C3 (6 events 183
in 1650 ± 400 yr). The distribution is bimodal: the 3 clusters depict mean Recurrence 184
Intervals (RI) of 0.3 ± 0.2 (C3), 0.4 ± 0.2 (C2), and 0.6 ± 0.4 ka (C1) and are separated by 185
two Quiescence periods Q1 and Q2 of 1625 ± 490 yr and 1575 ± 580 yr, respectively 186
(Fig. 3). This distribution suggests 3–4 k.y.-long patterns including clusters of 3 to 6 187
events and periods without major events inbetween. This variability in earthquake 188
recurrence is akin to the concept of “supercycles” suggested in subduction zones 189
(Goldfinger et al., 2013). Interestingly, similar quiescence periods are found in the 190
southwest Iberian margin (Gràcia et al., 2010) and in central Italy (Benedetti et al., 2013), 191
where slip rates are low. This concept supports alternation of broad phases of strain 192
loading and shorter phases of strain release and implies that fault slip rates are time 193
dependent (Friedrich et al., 2003; Benedetti et al., 2013). Note also that the mean RI in 194
clusters rises progressively (C3: 305 yr; C2: 430 yr; C1: 580 yr; Fig. 3), suggesting that 195
strain rates may change through time. 196
Earthquake Synchrony
197
Fault interactions have proved to promote or delay fault activity by stress transfer, 198
sometimes leading to synchronization between fault segments (Scholz, 2010). If slope 199
sediments are prone to failure, turbidites record the activity of any neighboring fault able 200
to cause earthquakes strong enough to trigger turbidity currents (Fig. 4). The 201
cluster/quiescence pattern found here supports the idea that the seismogenic segments 202
(EAFS and other large faults in the area) are in synchrony, at least at the scale of the 203
DOI:10.1130/G36170.1
study region (~100 × 100 km, Fig. 1). Knowledge of long-term cycling in the rupture 204
pattern (here, two complete supercycles; Fig. 3) is important since it reveals phases of 205
strain release and loading, therefore a given elapsed time after a clustering period would 206
not necessarily mean a higher hazard. This result thus modifies the probability models of 207
earthquake recurrence (Gomberg et al., 2005) and helps improve seismic hazard 208
assessments. 209
ACKNOWLEDGMENTS
210
We thank GENAVIR for their assistance during the MARADJA and PRISME 211
cruises, and Algerian authorities for permits and logistical supply. IFREMER and the 212
Conseil Général du Finistère funded G. Ratzov’s grant. LabexMER (ANR-10-LABX-213
19-01) supported part of the analyses. CNRS-INSU Artemis Program provided 14C
214
dates. We thank J.Y. Collot, M.A. Gutscher and D. Pantosti for fruitful discussions, 215
L.McNeill, A. Polonia and four anonymous reviewers for thorough comments. 216
REFERENCES CITED
217
Akkar, S., and Bommer, J.J., 2010, Empirical Equations for the Prediction of PGA, PGV, 218
and Spectral Accelerations in Europe, the Mediterranean Region, and the Middle 219
East: Seismological Research Letters, v. 81, p. 195–206, doi:10.1785/gssrl.81.2.195. 220
Avouac, J.-P., Meyer, B., and Tapponnier, P., 1992, On the growth of normal faults and 221
the existence of flats and ramps along the El Asnam active fold and thrust system: 222
Tectonics, v. 11, p. 1–11, doi:10.1029/91TC01449. 223
Babonneau, N., Cattaneo, A., Savoie, B., Barjavel, G., Déverchère, J., and Yelles, K., 224
2012, Discovery of the Kramis fan offshore Algeria: the role of sediment waves in 225
turbiditic levee growth: AAPG SEPM Special Publication, v. 99, p. 293–308. 226
DOI:10.1130/G36170.1
Barcena, M.A., Cacho, I., Abrantes, F., Sierro, F.J., Grimalt, J.O., and Flores, J.A., 2001, 227
Paleoproductivity variations related to climatic conditions in the Alboran Sea 228
(western Mediterranean) during the last glacial‚ interglacial transition: the diatom 229
record: Palaeogeography, Palaeoclimatology, Palaeoecology, v. 167, p. 337–357, 230
doi:10.1016/S0031-0182(00)00246-7. 231
Beldjoudi, H., Delouis, B., Heddar, A., Nouar, O.B., and Yelles Chaouche, A., 2011, The 232
Tadjena Earthquake (Mw=5.0) of December 16, 2006 in the Cheliff Region 233
(Northern Algeria): Waveform Modelling, Regional Stresses, and Relation with the 234
Boukadir Fault: Pure and Applied Geophysics, v. 169, p. 677–691, 235
doi:10.1007/s00024-011-0337-8. 236
Benedetti, L., Manighetti, I., Gaudemer, Y., Finkel, R., Malavieille, J., Pou, K., Arnold, 237
M., Aumaître, G., Bourlès, D., and Keddadouche, K., 2013, Earthquake synchrony 238
and clustering on Fucino faults (Central Italy) as revealed from in situ 36Cl exposure
239
dating: Journal of Geophysical Research, v. 118, p. 4948–4974. 240
Boughacha, M.S., Ouyed, M., Ayadi, A., and Benhallou, H., 2004, Seismicity and 241
seismic hazard mapping of northern Algeria: Map of Maximum Calculated 242
Intensities (MCI): Journal of Seismology, v. 8, p. 1–10, 243
doi:10.1023/B:JOSE.0000009513.11031.43. 244
Cattaneo, A., Babonneau, N., Ratzov, G., Dan, G., Yelles, K., Bracene, R., Mercier de 245
Lepinay, B., Boudiaf, A., and Déverchère, J., 2012, Searching for the seafloor 246
signature of the 21 May 2003 Boumerdes earthquake offshore central Algeria: 247
Natural Hazards and Earth System Sciences, v. 12, p. 2159–2172, 248
doi:10.5194/nhess-12-2159-2012. 249
DOI:10.1130/G36170.1
Einsele, G., Chough, S.K., and Shiki, T., 1996, Depositional events and their records An 250
introduction: Sedimentary Geology, v. 104, p. 1–9, doi:10.1016/0037-251
0738(95)00117-4. 252
El-Robrini, M., Genesseaux, M., and Mauffret, A., 1985, Consequences of the El Asnam 253
Earthquake: Turbidity Currents and Slumps on the Algerian Margin (Western 254
Mediterranean): Geo-Marine Letters, v. 5, p. 171–176, doi:10.1007/BF02281635. 255
Friedrich, A., Wernicke, B.P., Niemi, N.A., Bennett, R.A., and Davis, J.L., 2003, 256
Comparison of geodetic and geologic data from the Wasatch region, Utah, and 257
implications for the spectral character of Earth deformation at periods of 10 to 10 258
million years: Journal of Geophysical Research, v. 108, B4, p. 2199, 259
doi:10.1029/2001JB000682. 260
Goldfinger, C., Nelson, C.H., Johnson, J.E., and Party, S.S., 2003, Holocene earthquake 261
records from the Cascadia subduction zone and northern San Andreas Fault based on 262
precise dating of offshore turbidites: Annual Review of Earth and Planetary 263
Sciences, v. 31, p. 555–577, doi:10.1146/annurev.earth.31.100901.141246. 264
Goldfinger, C., Ikeda, Y., Yeats, R.S., and Ren, J., 2013, Superquakes and Supercycles: 265
Seismological Research Letters, v. 84, p. 24–32, doi:10.1785/0220110135. 266
Gomberg, J., Belardinelli, M.E., Cocco, M., and Reasenberg, P., 2005, Time-dependent 267
earthquake probabilities: Journal of Geophysical Research, v. 110, p. B05S04, 268
doi:10.1029/2004JB003405. 269
Gràcia, E., et al., 2006, Active faulting offshore SE Spain (Alboran Sea): Implications for 270
earthquake hazard assessment in the Southern Iberian Margin: Earth and Planetary 271
Science Letters, v. 241, p. 734–749, doi:10.1016/j.epsl.2005.11.009. 272
DOI:10.1130/G36170.1
Gràcia, E., Vizcaino, A., Escutia, C., Asioli, A., Rodes, A., Pallas, R., Garcia Orellana, J., 273
Lebreiro, S., and Goldfinger, C., 2010, Holocene earthquake record offshore 274
Portugal (SW Iberia): testing turbidite paleoseismology in a slow convergence 275
margin: Quaternary Science Reviews, v. 29, p. 1156–1172, 276
doi:10.1016/j.quascirev.2010.01.010. 277
Heezen, B.C., and Ewing, M., 1955, Orléansville earthquake and turbidity currents: 278
AAPG Bulletin, v. 39, p. 2505–2514. 279
Meghraoui, M., Jaegy, R., Lammali, K., and Albarède, F., 1988, Late Holocene 280
earthquake sequences on the El Asnam (Algeria) thrust fault: Earth and Planetary 281
Science Letters, v. 90, p. 187–203, doi:10.1016/0012-821X(88)90100-8. 282
283
Pouderoux, H., Proust, J.-N., and Lamarche, G., 2014, Submarine paleoseismology of the 284
northern Hikurangi subduction margin of New Zealand as deduced from Turbidite 285
record since 16ka: Quaternary Science Reviews, v. 84, p. 116–131, 286
doi:10.1016/j.quascirev.2013.11.015. 287
Ratzov, G., Collot, J.Y., Sosson, M., and Migeon, S., 2010, Mass transport deposits in the 288
northern Ecuador subduction trench: Result of frontal erosion over multiple seismic 289
cycles: Earth and Planetary Science Letters, v. 296, p. 89–102, 290
doi:10.1016/j.epsl.2010.04.048. 291
Scholz, C.H., 2010, Large Earthquake Triggering, Clustering, and the Synchronization of 292
Faults: Bulletin of the Seismological Society of America, v. 100, p. 901–909, 293
doi:10.1785/0120090309. 294
DOI:10.1130/G36170.1
Stein, R.S., 1999, The role of stress transfer in earthquake occurrence: Nature, v. 402, 295
p. 605–609, doi:10.1038/45144. 296
Stich, D., Serpelloni, E., de Lis Mancilla, F., and Morales, J., 2006, Kinematics of the 297
IberiaMaghreb plate contact from seismic moment tensors and GPS observations: 298
Tectonophysics, v. 426, p. 295–317, doi:10.1016/j.tecto.2006.08.004. 299
Sumner, E.J., Siti, M.I., McNeill, L.C., Talling, P.J., Henstock, T.J., Wynn, R.B., 300
Djajadihardja, Y.S., and Permana, H., 2013, Can turbidites be used to reconstruct a 301
paleoearthquake record for the central Sumatran margin?: Geology, v. 41, p. 763– 302
766, doi:10.1130/G34298.1. 303
Van Daele, M.E., Cnudde, V., Duyck, P., Pino, M., Urrutia, R., and de Batist, M., 2013, 304
Multidirectional, synchronously triggered seismoturbidites and debrites revealed by 305
X-ray computed tomography (CT): Sedimentology, v. 61, p. 861–880, 306
doi:10.1111/sed.12070. 307
DOI:10.1130/G36170.1 309
FIGURE CAPTIONS
310
Figure 1. Morphostructural map of the northwestern Algerian margin. Capsule: Arrow is 311
the Africa/Eurasia convergence inferred from GPS (Stich et al., 2006). Map: Black lines 312
onland are the active fault network, double arrows are folds (Beldjoudi et al., 2011). 313
Focal mechanisms of the 1954 and 1980 earthquakes are from Avouac et al. (1992). 314
Offshore, isobaths represent 500 m. Red lines are submarine cables, stars are the breaks 315
after the 1954 earthquake (after Heezen and Ewing, 1955). Color circles are sedimentary 316
cores used in this study. 317
318 319
DOI:10.1130/G36170.1
Figure 2. Synthetic logs of the cores used for turbidite correlations depicting 320
interpretation from turbidite in each core (Tx) to widespread events (Ex) where the 321
turbidites are correlated across numerous cores. Gray layer outlines the uncertainties on 322
identifying the precise turbidites boundaries. Deposits are discriminated based on Photo, 323
X-ray pictures, magnetic susceptibility, density, XRF (B), and sediment sorting (C). 324
DOI:10.1130/G36170.1
Figure 3. Correlations between ages of events recorded in each core (color lines) and the 326
paleoquake chronology reconstructed across the El Asnam fault (Meghraoui et al., 1988). 327
Purple stripes outline the intersection of the error bars of turbidite ages, thus the 328
probability age of earthquake triggering. 329
330 331
DOI:10.1130/G36170.1
Figure 4. Mean Peak Ground Acceleration (PGA) predicted for historical earthquakes, 332
felt in the area of submarine canyon heads where sediment turbibity flows likely 333
originate. PGA is calculated with empirical equations (Akkar and Bommer, 2010) for 334
rock sites. Color stripes outline the PGA caused by Mw 6.0 ± σ and Mw 7.5 ± σ
335
earthquakes (Fig. DR8 [see footnote 1] for further details). Geotechnical analyses of the 336
sediment cover show that slope should fail at 0.1 g PGA. 337
338 339
1GSA Data Repository item 2015xxx, xxxxxxxx, is available online at
340
www.geosociety.org/pubs/ft2014.htm, or on request from [email protected] or 341
Documents Secretary, GSA, P.O. Box 9140, Boulder, CO 80301, USA. 342
N36°30’ N36° 0° E0°30’ E1° KMDJ08 KMDJ07 KMDJ23 KMDJ24 KMDJ22 PSM KS19 2500 2000 1000 500 KMDJ06 0 10 20 40 Km 0 3000 water depth (m) KMDJ08 KMDJ06 KMDJ07 KMDJ23 PSM KS-19 KMDJ24 KMDJ22 PSM KS-20 0 1 2 3 4 5 6 7 0 1 2 3 4 5 6 0 1 2 3 4 5 6 7 8 9 0 1 2 3 4 5 6 7 8 0 1 2 3 4 5 6 7 8 0 1 0 1 2 3 4 5 6 7 0 1 2 3 4 5 6 7 8 0 1 2 3 4 5 6 7
W
E
D ep th b el ow th e s ea flo or (m ) Hemipelagite TurbiditeMass Transport Deposit
Clay Silty ClaySilt Very Fine SandFine Sand
Middle SandCoarse Sand Clay
Silty ClaySilt V. Fine SandFine Sand Middle SandCoarse Sand
Clay Silty ClaySilt
V. Fine SandFine Sand Middle SandCoarse Sand
Clay Silty ClaySilt
V. Fine SandFine Sand Middle SandCoarse Sand
Clay Silty ClaySilt
V. Fine SandFine Sand Clay
Silty ClaySilt V. Fine SandFine Sand Middle Sand
Clay Silty ClaySilt V. Fine SandFine Sand Middle SandCoarse Sand
Clay Silty ClaySilt
50
100
Depth below the sea
floor (cm) T2 T3 T4 T5 T6 T7 T8 T9 T10 T11 T12 T13 T14 T15 E3 E5 E6 E8 E9 E10 E11 E12 E7 E3 E4 E5 E6 E7 E8 E9 E10 E11 E12 E13 50 100 150 200 250 300
Depth below the sea
floor (cm) -3 (g.cm )-3 T1 T2 T3 T4 T5 T6 T7 T8 T9 T10 T11 T12 T13 T14 T15 T16 T17 T18 T19 T20 T21 T22 T23 T24 300 250 200 150 100 50
Depth below the sea
floor (cm) 1.6 1.8 2 Gamma Density T2 T3 T4 T5 T6 T7 T8 T9 T10 1 10 100 1000 D50 (μm) Hemipelagite Turbidite Uncertainty
1 E2 E3 E4 E5 E9 E10 E11 E12 E13 1788-2276 387-649BP 1740-2147BP 3508-3962BP 6194-6563BP 7995-8358BP 936-1281BP 6540-6950BP 6540-6950BP 4396-4825BP 7173-7488BP 4635-5119 6519-6928
%!!!" " " T2 T1 T3 T4 T5 T6 T7 T8 T9 T10 T11 T12 T14 T15 T16 0 50 100 150 200 250 300 350 0 50 100 150 200 250 300 350 0 50 100 150 200 250 300 0 50 100 150 200 250 T13 T17 T18 T19 T20 T21 T22 T23 T24 T25 T2 T1 T3 T4 T5 T6 T7 T8 T9 T10 T2 T1 T3 T4 T5 T6 T7 T8 T9 T10 T11 T12 T14 T15 T16 T13 350 0.1 1 10 100 1000 0.1 1 10 100 1000 0.1 1 10 100 1000 Grain-size (µm) Hemipelagite Hemipelagite Turbidite Turbidite Uncertainties Facies interpretation Grain-size analyses Base of turbidite Uncertainies Photo X Ray Turbidite ID Turbidite ID Turbidite ID
Globigerinoides Bulloides
KMDJ08 36.3362 0.0462 2631 7.65 UGAMS 9291 23 G. ruber, G. sacculifer, G. bulloides 1660 ± 25 936-1281 UGAMS 9292 171 G. ruber, G. sacculifer, G. bulloides 4540 ± 25 4396-4825 UGAMS 9293 253 G. ruber, G. sacculifer, G. bulloides 6390 ± 25 6540-6950 UGAMS 9294 303 G. ruber, G. sacculifer, G. bulloides 6910 ± 25 7173-7488 KMDJ07 36.5403 0.1267 2630 6.68 UGAMS 8785 45 G. ruber, G. sacculifer, G. bulloides 2590 ± 25 1788-2276 SacA 29350 124-125 G. ruber, G. sacculifer 4745 ± 30 4635-5119 UGAMS 8786 190 Mixed Planctonic Foraminifers 6370 ± 25 6516-6928 UGAMS 8788 345 Mixed Planctonic Foraminifers 7770 ± 25 7960-8316 PSM
KS19 36.6340 0.2863 2626 8.65 UGAMS 8782 11 G. ruber, G. sacculifer, G. bulloides 1020 ± 25 387-649 UGAMS 8783 39 G. ruber, G. sacculifer, G. bulloides 2430 ± 25 1740-2147 SacA 29351 63-64 G. ruber, G. sacculifer 3885 ± 30 3508-3962 SacA 21669 82 G. ruber, G. sacculifer 6045 ± 30 6194-6563 UGAMS 8784 127 Mixed Planctonic Foraminifers 7820 ± 25 7995-8358
P_sequence k k (A) (B) (C)
E13 Date AE12 E11 Date BE10 E9E8 Date CE7 E6 E5 Date DE3 E2 0 1000 2000 3000 4000 5000 6000 7000 8000 9000
Calibrated Age (cal yr BP)
E13Date A E12E11 Date B E10 E9 E8-E10 Date CE7 E6 E5 Date D E3 E2 0 1000 2000 3000 4000 5000 6000 7000 8000 9000
Calibrated Age (cal yr BP)
0 1 2 3 4 5 6 7 8 9 0 50 100 150
Hemipelagic depth (cm) Hemipelagic depth (cm)
Calibrated Age (cal kyr BP) 9 8 7 6 5 4 3 2 1 0
0
50
100
150
Calibrated Age (cal kyr BP)
A
Age / Depth modelMinimum turbidite thickness
B
Age / Depth modelMaximum turbidite thickness
C
Total age probabilityE11 E10 E9 E8 E7 E6 E3 E2 E12 E5
Date A T23-25 T20-22 E13 E12 E11 Date B E10 E9 E8 T10 Date C E7 E6 E5 Date DE4 E3 Core-top 0 1000 2000 3000 4000 5000 6000 7000 8000 9000
Calibrated Age (cal yr BP)
Date A T23-25 T20-22 E13 E12 E11 Date BE10 E9 E8 T10 Date C E7 E6 E5 Date D E4 E3 Core-top 0 1000 2000 3000 4000 5000 6000 7000 8000 9000
Calibrated Age (cal yr BP)
0 1 2 3 4 5 6 7 8 9 0 50 100 150
Hemipelagic depth (cm) Hemipelagic depth (cm)
Calibrated Age (cal kyr BP) 9 8 7 6 5 4 3 2 1 0
0
50
100
150
Calibrated Age (cal kyr BP)
A
Age / Depth modelMinimum turbidite thickness
B
Age / Depth modelMaximum turbidite thickness
C
Total age probabilityE12 E11 E10 E9 E8 T10 E7 E6 E5 E4 E3
Date A E13E12 E11 E10 Date B E9 Date CE5 Date D E4 E3 Date EE2 E1 Date A E13 E12 E11 E10 Date B E9 Date C E5 Date D E4 E3 Date EE2 E1 0 1000 2000 3000 4000 5000 6000 7000 8000 9000
Calibrated Age (cal yr BP)
0 1000 2000 3000 4000 5000 6000 7000 8000 9000
Calibrated Age (cal yr BP)6 5 4 3 2 1 0
7 8 9 0 50 100 150 Hemipelagic depth (cm)
Calibrated Age (cal kyr BP) 9 8 7 6 5 4 3 2 1 0
0
50
100
150
Hemipelagic depth (cm)
Calibrated Age (cal kyr BP)
A
Age / Depth modelMinimum turbidite thickness
B
Age / Depth modelMaximum turbidite thickness
C
Total age probabilityE13 E12 E11 E10 E9 E5 E4 E3 E2 E1
Slope failure treshold Almeria 1522 M~6.9 Ms 7.3 Orléansville 1954 Ms 6.7 Mount Chenoua 1989 Mw 6 M 7.5+ σ M7.5 M6.0+ σ 10-1 10-2 PGA (g)