HAL Id: hal-02975828
https://hal.uca.fr/hal-02975828
Submitted on 23 Oct 2020
HAL is a multi-disciplinary open access archive for the deposit and dissemination of sci-entific research documents, whether they are pub-lished or not. The documents may come from teaching and research institutions in France or abroad, or from public or private research centers.
L’archive ouverte pluridisciplinaire HAL, est destinée au dépôt et à la diffusion de documents scientifiques de niveau recherche, publiés ou non, émanant des établissements d’enseignement et de recherche français ou étrangers, des laboratoires publics ou privés.
Synchrotron high-resolution XRD and thermal
expansion of synthetic Mg calcites
Nicole Floquet, Daniel Vielzeuf, Vasile Heresanu, Didier Laporte, Jonathan
Perrin
To cite this version:
Nicole Floquet, Daniel Vielzeuf, Vasile Heresanu, Didier Laporte, Jonathan Perrin. Synchrotron high-resolution XRD and thermal expansion of synthetic Mg calcites. Physics and Chemistry of Minerals, Springer Verlag, 2020, 47 (48), �10.1007/s00269-020-01115-5�. �hal-02975828�
1 Synchrotron High-Resolution XRD and thermal expansion of synthetic Mg Calcites 1
Nicole Floquet,*,a Daniel Vielzeuf,a Vasile Heresanu,a Didier Laporteb and Jonathan Perrin.c 2
3
a Aix-Marseille University, CNRS, CINaM UMR7325, 13288 Marseille, France 4
b Université Clermont Auvergne, CNRS, IRD, OPGC, Laboratoire Magmas et Volcans, 63000 5
Clermont-Ferrand, France
6
c Synchrotron SOLEIL, BP 38, Saint-Aubin, Gif-sur-Yvette, France 7
8
* Corresponding author N. Floquet.
9
Address : CNRS, UMR7325, Aix-Marseille University, CINaM, 13288, Marseille, France.
10
E-mail addresses : floquet@cinam.univ-mrs.fr (N. Floquet) vielzeuf@cinam.univ-mrs.fr (D.
11
Vielzeuf), heresanu@cinam.univ-mrs.fr (V. Heresanu), didier.laporte@uca.fr (D. Laporte),
12 perrin@synchrotron-soleil.fr (J. Perrin). 13 14 15 Abstract : 16
The structural parameters and the thermal behavior of a complete series of Ca-Mg carbonates
17
synthesized at high pressure and temperature (1–1.5 GPa, 1273–1373 K) in the range 0-50
18
mol% MgCO3 has been investigated by in situ powder synchrotron high-resolution X-ray 19
diffraction at ambient and up to 1073 K under self-controlled CO2 partial pressure. The crystal 20
structures are disordered Mg calcite in the range 1- 41 mol% MgCO3, and Ca dolomite at 49 21
mol% MgCO3. New calibration curves of the cell parameters for the Mg content and thermal 22
expansion from ambient to 1073 K are given. Short range structural effects of cation
23
substitution and ordering and their thermal behavior as a function of Mg content were
24
identified from three sets of data: the peak broadening, the cell parameter strains and the
25
Raman band enlargements. Both intra- and inter-crystalline levels of compositional
26
heterogeneity are identified and allow splitting the Mg calcites into two groups: low and
high-27
Mg calcites. The low Mg calcites (up to 22 mol% MgCO3) are homogeneous in Mg content with 28
short range ordering. High Mg calcite (up to 41 mol% MgCO3) display domains with different 29
local ordering configurations and similar or slightly different Mg contents, and to which is
30
added a compositional variation between crystals, as determined by EMP, of the order of ±
31
0.8 mol% MgCO3. The cation ordering in Ca-rich dolomites similarly occurs in high-Mg 32
synthetic calcites. The role of (CO3)2- group ordering is shown to be an important factor in the 33
formation of Ca-Mg carbonates.
34 35
Key-words: calcite-dolomite solid solution; RT and high-temperature X-ray diffraction; crystal 36
structure; short range cation order; long range cation order; thermal expansion.
37 38
2
Introduction
39
Among all carbonate systems, Ca-Mg carbonates on the calcite dolomite join are the most
40
studied due to their importance as geological and industrial materials. Low to high Mg-calcites
41
are main components of many biominerals, whereas Ca-rich dolomites with Ca excess up to 6
42
mol% occur in sedimentary rocks of diverse environments and ages. Most natural carbonates
43
present morphology, structure, composition, stoichiometry, and/or cation ordering deviations
44
from the ideal crystalline structures of calcite and dolomite (Deelman 2011; Rodriguez-45
Navarro et al. 2013). Such features may contain information about crystal growth. They may
46
also reflect environmental factors that control Mg calcite and Ca dolomite formation and
47
transformation in biominerals and sedimentary rocks.
48
Optically clear natural (OCN) calcite, dolomite and synthetic crystals on the calcite-dolomite
49
join are commonly used as standards to study the physicochemical and structural properties
50
of natural carbonates. Synthesized Mg-calcites were produced either at high pressure and
51
temperature from solid mixtures (Bischoff et al. 1983; Goldsmith et al. 1958; Goldsmith et al. 52
1961; Jenkins et al. 2018) or by crystallization in aqueous solutions under ambient pressure
53
and temperature (Glover and Sippel 1967) and references therein, (Zhang et al. 2010). As a
54
reference work, (Bischoff et al. 1983) synthesized up to 24 mol% MgCO3 Mg-calcites at high 55
pressure (2, 10 and 15 kbar) and temperature (973K or 1273K), and characterized the products
56
by XRD and μRaman spectroscopy. The Mg-calcites are reported as fully disordered calcite
57
structures and display a nonlinear, but smooth, variation of unit cell parameters and volume
58
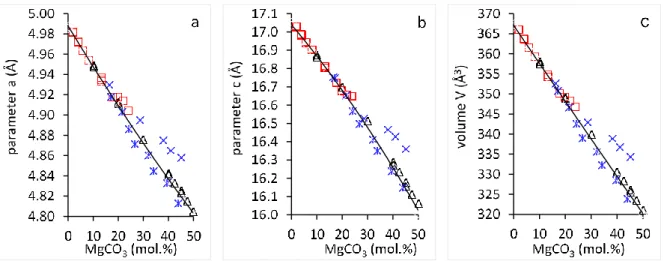
with composition up to about 20 mol. % MgCO3. (Bischoff et al. 1983) reported negative excess 59
volumes changing from negative to positive at 20 mol. % MgCO3 (Fig. 1). (Zhang et al. 2010) 60
indicate that the cell parameters of Mg calcites synthesized in aqueous solutions deviate from
61
a simple linear trend above 28 mol. % MgCO3 (Fig. 1). (Zhang et al. 2010) considered that this 62
non-linear change of structural parameters is related to partially ordered arrangements of Mg
63
and Ca and twinning which are well known for compositions close to dolomite ((Reeder 1992;
64
Rodriguez-Navarro et al. 2013; Wenk et al. 1983) and references therein). Thus, the
65
relationship between Ca-Mg structural ordering observed by transmission electron
66
microscopy (Fang and Xu 2019; Larsson and Christy 2008; Meike et al. 1988; Reksten 1990;
67
Shen et al. 2014; Van Tendeloo et al. 1985; Wenk et al. 1991) and the cell parameter variations
68
as a function of Mg content are still a matter of debate and require new structural studies of
69
high quality Mg calcites of known composition. Further evidence of structural ordering (or
70
not) can be obtained by studying the evolution of the crystal structure with temperature
71
through in situ heating experiments. An interesting relationship between structure and
72
physical property is observed in carbonates in terms of thermal expansion and its relationship
73
with anion group libration and cation octahedra composition (Reeder and Markgraf 1986;
74
Wang et al. 2018).Indeed, calcite displays negative and positive thermal expansions of a and
75
c cell parameters, respectively, whereas dolomite and magnesite show positive, although 76
quite anisotropic, thermal expansions of both a and c parameters. Noting this fact, (Markgraf 77
3 and Reeder 1985) wondered about the thermal expansion of the a cell parameter in
78
magnesian calcites, and more specifically about the Ca:Mg ratio at which the thermal
79
expansion of the a cell parameter changes from negative to positive.
80
81
Fig. 1 a, c and V parameters of synthetic calcites according to previous studies. Note the discrepancies
82
above 20 mol% MgCO3. Black triangles: Goldsmith et al (1961); Blue stars: Erenburg (1963); blue
83
crosses: Zhang et al (2010); red squares: Bischoff et al (1983). The line in the V-X diagram corresponds 84
to the calibration curve of Jenkins (2018): V (Å3)= 366.788-0.9326 mol% MgCO3
85 86 87
The present study is a follow-up from a previous one on the same synthetic carbonate
88
samples, already published by our group. The first study is a comprehensive characterization
89
by μRaman spectroscopy giving accurate data (both in wavelength position and full width at
90
half maximum (FWHM) peaks of carbonate group vibration bands) on the local ordering of the
91
carbonate groups along the calcite-dolomite join (Perrin et al. 2016). The aims of the present
92
study are (1) to analyze the powder diffractograms obtained by synchrotron high-resolution
93
X-ray powder diffraction (HRXRPD), determine the cell parameters and identify the structural
94
short- and (or) long-range ordering (if any) of Ca-Mg carbonates in the range 0-50 mol%
95
MgCO3; (2) characterize in situ the evolution with temperature of the crystal structure of 96
selected Mg calcites and determine their thermal expansion up to 1073 K under self-controlled
97
CO2 partial pressure. 98
99
Materials and Methods
100Experimental syntheses 101
The samples were synthesized at high pressure and high temperature in a piston cylinder
102
apparatus (Perrin et al. 2016). The Mg calcites cover the range 2 to 50 mol% MgCO3 (2 and 5 103
mol% step intervals between 2-30 and 30-50 mol% MgCO3, respectively). The starting 104
materials consist of pure synthetic calcite (Alfa Aesar) and natural magnesite from Brumado
105
4
(Bahia, Brazil). After desiccation in an oven at 383 K, about 60 mg of the mixture were loaded
106
in a 7 mm long by 5 mm outer-diameter gold capsule and welded shut. The gold capsule was
107
placed in a salt-glass assembly pressurized and heated for ~96 h in the piston-cylinder
108
apparatus, at 1273 K and 1 GPa for compositions in the range 2–30 mol% MgCO3. For 109
compositions in the range 35–50 mol% MgCO3, higher pressure and temperature were 110
selected (1373 K and 1.5 GPa) to avoid exsolution in the calcite-dolomite solvus as determined
111
by (Goldsmith et al. 1961). Large thick-walled capsules yielded sufficient quantity of crystalline
112
material in a single experiment to carry out different series of analyses while long run
113
durations (~4 days) favored attainment of textural and thermodynamic equilibrium. All runs
114
were quenched by the same procedure at high pressures, by cutting off the electrical power.
115
The quenching time was about 20 s from 1273 K to 573 K and 5 min to room temperature.
116
After the experiment, the run product was extracted from the capsule, part of it was mounted
117
in epoxy and polished for electron microprobe (EMP), scanning electron microscopy (SEM)
118
and µRaman analyses (Perrin et al. 2016), while the remaining was ground and kept for X-ray
119
diffraction (XRD). OCN calcite, dolomite, and magnesite crystals were also analyzed to serve
120
as references. OCN calcite comes from a perfect rhombohedron of unknown origin. OCN
121
dolomite and OCN magnesite come from Azcárate quarry, Eugui, Esteríbar (Spain), and
122
Brumado, Bahia (Brazil), respectively. Note that the number associated with the sample name
123
(e.g. MgCc2, MgCc50) refer to the nominal composition in mol% MgCO3 in the starting 124
material. The actual concentrations measured by EMP are given in Table 1. 125
Analytical Methods 126
Synchrotron High-Resolution X-ray Powder Diffraction
127
HRXRPD of the samples was performed at the ID22 beamline of the European Synchrotron
128
Radiation Facility (ESRF, Grenoble, France). The instrument is equipped with a double-crystal
129
monochromator Si(111) and crystal analyzer optical elements in the incident and diffracted 130
beams, respectively. A description of the diffraction instrument is given by (Fitch 2004). The
131
setup allows high quality powder diffraction patterns with high signal/noise ratio, combined
132
with narrow peaks, accurate positions and intensities. The instrumental contribution to peak
133
width (FWHM) does not exceed 0.003° 2θ. The typical resolution (Δd/d) is ∼10−4. Incident 134
beam size on the sample is typically 1.5 mm × 1.5 mm. The selected wavelength λ = 0.41068(1)
135
Å (30 keV) was calibrated with Si standard NIST 640c (certified cell parameter a = 5.4311946
136
(92) Å). One mm outer-diameter quartz capillaries were filled with sample powder, then
137
sealed, mounted horizontally, and spun at 1000 rpm during data collection to improve particle
138
statistics. Data were collected in the 1° < 2θ < 45° range, in continuous motion 5°/ min, and
139
rebinned in 2 step of 0.003°. Data acquisition time was 30 min for each sample at room
140
temperature (RT) to ensure good counting statistics. For in situ heating measurements, the
141
capillaries were heated with a hot air blower mounted vertically, perpendicular to the
142
capillary. Temperature was controlled by a thermocouple located in the hot air stream. The
5
measurements (three recording patterns of 10 min at each T) were performed at RT, then in
144
steps of 60 K from 353 to 1073 K (heating rate of 10 K/min) and again at room temperature
145
after cooling.
146
147
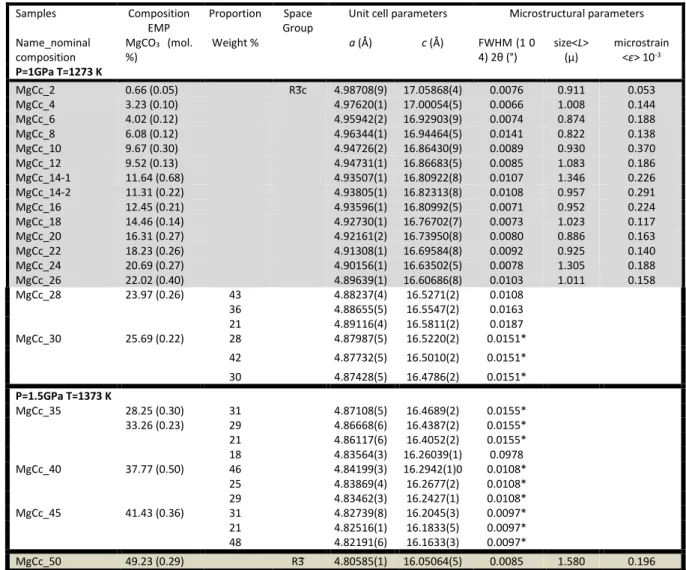
Table 1 Refined unit cell parameters, microstructural parameters [FWHM broadening, size <L> and
148
microstrain <ɛ>] of synthetic magnesian calcites and dolomite. (wavelength of λ = 0.41068(1) Å (30 149
keV)) (standard deviation in brackets).* broadening coefficients of the pseudo-Voigt profile function 150
constrained to the same values. Composition measured by EMP (Perrin et al., 2016)
151 152 HRXRPD Pattern Analysis 153 Cell parameters 154
Both whole powder pattern and single peak analyses were performed with the Fullprof
155
software suite (Rodriguez-Carvajal 1993). In the Rietveldrefinements, the diffraction peak
156
profiles were fitted with a pseudo-Voigt profile function and corrected for the asymmetry due
157
to axial divergence (Rietveld 1969). All samples were refined in the rhombohedral system
158
using the 𝑅3𝑐 space group for calcite, Mg-calcite and magnesite, and the 𝑅3 space group for
159
dolomite and Ca-dolomite. Starting atomic coordinates, cell parameters, and isotropic
160
Samples Composition EMP
Proportion Space Group
Unit cell parameters Microstructural parameters Name_nominal composition MgCO3 (mol. %) Weight % a (Å) c (Å) FWHM (1 0 4) 2θ (°) size<L> (µ) microstrain <ɛ> 10-3 P=1GPa T=1273 K MgCc_2 0.66 (0.05) R3̅c 4.98708(9) 17.05868(4) 0.0076 0.911 0.053 MgCc_4 3.23 (0.10) 4.97620(1) 17.00054(5) 0.0066 1.008 0.144 MgCc_6 4.02 (0.12) 4.95942(2) 16.92903(9) 0.0074 0.874 0.188 MgCc_8 6.08 (0.12) 4.96344(1) 16.94464(5) 0.0141 0.822 0.138 MgCc_10 9.67 (0.30) 4.94726(2) 16.86430(9) 0.0089 0.930 0.370 MgCc_12 9.52 (0.13) 4.94731(1) 16.86683(5) 0.0085 1.083 0.186 MgCc_14-1 11.64 (0.68) 4.93507(1) 16.80922(8) 0.0107 1.346 0.226 MgCc_14-2 11.31 (0.22) 4.93805(1) 16.82313(8) 0.0108 0.957 0.291 MgCc_16 12.45 (0.21) 4.93596(1) 16.80992(5) 0.0071 0.952 0.224 MgCc_18 14.46 (0.14) 4.92730(1) 16.76702(7) 0.0073 1.023 0.117 MgCc_20 16.31 (0.27) 4.92161(2) 16.73950(8) 0.0080 0.886 0.163 MgCc_22 18.23 (0.26) 4.91308(1) 16.69584(8) 0.0092 0.925 0.140 MgCc_24 20.69 (0.27) 4.90156(1) 16.63502(5) 0.0078 1.305 0.188 MgCc_26 22.02 (0.40) 4.89639(1) 16.60686(8) 0.0103 1.011 0.158 MgCc_28 23.97 (0.26) 43 4.88237(4) 16.5271(2) 0.0108 36 4.88655(5) 16.5547(2) 0.0163 21 4.89116(4) 16.5811(2) 0.0187 MgCc_30 25.69 (0.22) 28 4.87987(5) 16.5220(2) 0.0151* 42 4.87732(5) 16.5010(2) 0.0151* 30 4.87428(5) 16.4786(2) 0.0151* P=1.5GPa T=1373 K MgCc_35 28.25 (0.30) 33.26 (0.23) 31 4.87108(5) 16.4689(2) 0.0155* 29 4.86668(6) 16.4387(2) 0.0155* 21 4.86117(6) 16.4052(2) 0.0155* 18 4.83564(3) 16.26039(1) 0.0978 MgCc_40 37.77 (0.50) 46 4.84199(3) 16.2942(1)0 0.0108* 25 4.83869(4) 16.2677(2) 0.0108* 29 4.83462(3) 16.2427(1) 0.0108* MgCc_45 41.43 (0.36) 31 4.82739(8) 16.2045(3) 0.0097* 21 4.82516(1) 16.1833(5) 0.0097* 48 4.82191(6) 16.1633(3) 0.0097* MgCc_50 49.23 (0.29) R3̅ 4.80585(1) 16.05064(5) 0.0085 1.580 0.196
6
temperature factors of calcite and magnesite are taken from (Maslen et al. 1995) while those
161
of dolomite and Mg-calcite are from (Althoff 1977). The atomic composition of each powder
162
sample was determined by EMP with a mean value and a standard deviation. Consequently,
163
(1) the random occupancy of Ca and Mg into octahedral sites for Mg calcite samples were not
164
refined but constrained to the EMP composition, (2)the CO3 group was considered as a rigid 165
structural unit. The C-O bond length was previously found to be very close to 1.284 Å for
166
several carbonate phases, including magnesite and otavite (Reeder 1983; Zemann 1981). The
167
C-O bond length was fixed as a function of Mg content (nMg), between the C-O bond lengths 168
in calcite (nMg = 0, d(C-O)calcite =1.2864 Å) and in dolomite (nMg = 0.5, d(C-O)dolomite =1.2831 Å). 169
It was constrained according to the linear relation d(C-O)MgCc = -0.000068 nMg + 1.2864 (with 170
nMg: mol.% MgCO3 determined by EMP reported on Table 1). The background function, scale 171
factors, unit-cell parameters, Gaussian and Lorentzian broadening coefficients of the
pseudo-172
Voigt profile function, and March-Dollase preferred orientation parameters were refined for
173
each entire diffractogram. Atomic positions were refined only for OCN calcite, dolomite and 174
magnesite.In the synthetic Mg calcites, where oxygen position and Ca and Mg occupations
175
were constrained, typical agreement factors, , Rp, and Rwp ranged from 3 to 13, 0.08 to 0.10, 176
and 0.12 to 0.15, respectively.
177
Long-range and short-range atom ordering 178
The degree of order is of primary importance in the calcite-dolomite-magnesite system. As
179
summarized by (Putnis 1992), the degree of order involves two different concepts.
180
Long-range order involves the occupancies of the sites averaged over the complete crystal. It 181
is defined in terms of relative occupancy of non-equivalent sites. In the case of dolomite, the
182
disordered state occurs on sites of two distinct layers, Ca layers labelled and Mg layers
183
labelled . The degree of cation order is described by the order parameter s, defined as s =
184
(nCa-nCa,)/(nCa,+nCa,) where nCa, andnCa, is the occupancy of Ca-type cations in Ca-type 185
layers and Mg-type layers, respectively. The long-range order parameter equals 0 in the fully
186
disordered state and 1 in the fully ordered state. Other equivalent formulations for the s order
187
parameter were found for stoichiometric dolomites: s =-1+2nCa (Reeder and Wenk 1983) 188
and for Ca-rich dolomite s = (2nCa-nCa,)/(2-nCa-nCa,) where nCa, and nCa,are the 189
occupancy of Ca-type cations in Ca-type layers and in Mg-type layers, respectively.(Reeder 190
2000).
191
When the occupancy of Ca-type cations could not be refined, it is usual to calculate the long
192
range order parameter in dolomite structure from the intensity of b-type peaks. In the
193
dolomite diffractograms, the periodic layer arrangement of the non-equivalent sites gives rise
194
to b-type ordering peaks [(1 0 1), (0 1 5), (0 2 1)] characteristic of the 𝑅3 space group
195
(Goldsmith and Heard 1961; Reeder and Nakajima 1982; Deelman 1999). In this case, the
long-196
range order parameter is related to the intensities of normal (0 0 6) and b-type (0 1 5) peaks,
197
and defined as √(I0 1 5/I0 0 6) ((Zucchini et al. 2012) and references therein).The order parameter 198
√(I0 1 5/I0 0 6) was determined from diffraction patterns computed with Fullprof for 199
7
stoichiometric dolomites (Supp. Mat. Fig. S1). From nCa, = 1 to 0, √(I0 1 5/I0 0 6) = 0.0058 x (nCa)2
200
+ 1.0621 x nCa + 0.0335 where nCa is the Ca occupancy at its normal site in the dolomite
201
structure. The order parameter √(I0 1 5/I0 0 6) varies almost linearly between 1.1 and 0 from 202
fully ordered (nCa = 1) to fully disordered (nCa = 0) dolomite. In the present study, the linear
203
relation √(I0 1 5/I0 0 6) = 1.1 nCa was used to quantify the disordering in dolomite structures.
204
Short-range order was first introduced and theorized by Warren and Cowley (Warren et al. 205
1951; Cowley 1950, 1960). It involves the occupancies of the sites over a scale of a few Å. It is
206
defined by the probability that an atom is in the first coordination sphere surrounding an
207
arbitrary atom relatively to the random probability. In the case of Mg calcite, the disordered
208
state occurs on one set of equivalent cation (Ca,Mg) sites. The degree of short-range order ()
209
is defined as = 1-PMg/nMg, =1-PCa/nCa where nMg or Ca is the Mg (or Ca) occupancy fraction, i.e.
210
the random probability and PMg or Ca the probability of Mg (or Ca) atoms is within the first
211
coordination sphere surrounding a central Ca (or Mg) atom. In the random structure = 0,
212
while in the fully ordered structure = 1. In the Rietveld analysis of the Mg calcite powder
213
diffractograms, the substitution of Mg for Ca could not be refined, it was considered as fully
214
random and disordered. All kinds of short-range order being not considered, led to lower
215
agreement factors values. Besides, short-range order such as preferential occupancy of Ca and
216
Mg into octahedral sites within domains would generate variations of intensities and
non-217
uniform broadening of select families of reflections (Radha et al. 2007). In particular, (h k l)
218
stacking faults would selectively broaden the peaks due to the (h k l) family of reflections. The
219
heat treatment of Mg calcites is expected to induce lattice parameter distortions and Ca and
220
Mg re-ordering, but also change the average domain size and crystal lattice microstrain. For
221
these specific microstructural characterizations, each single peak in the diffractogram was
222
analyzed with the Winplotr program (Roisnel and Rodriguez-Carvajal 2001) and we used the
223
Williamson-Hall plot method (Williamson and Hall 1953) in which the broadened peak is
224
analyzed by a pseudo-Voigt function. The integrated intensity, coherent domain size ⟨L⟩ and
225
average microstrain values ⟨ε⟩ are estimated from the refined profile width parameters. The
226
coherent domain size was determined using the (Scherrer 1918) formula: ⟨L⟩ = λ /βcos(θ)
227
where λ, β, and θ are the wavelength, integral breath, and Bragg angle, respectively (Scherrer 228
1918). The microstrain effect is the variance of the lattice spacing (Δd/d) and the angular
229
dependence of the form is defined as Δd/d = β/tan(θ) (Stokes and Wilson 1942).
230 231
Results and interpretations
232HRXRPD characterization of magnesian calcite syntheses 233
Whole pattern analysis and cell parameters
234
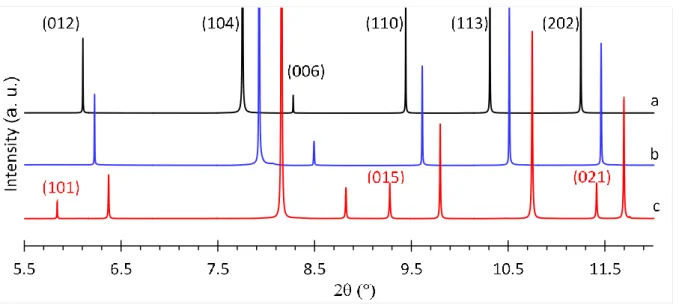
HRXRPD patterns of OCN calcite, OCN dolomite, and synthetic magnesian calcite MgCc24
235
(~20.7 mol% MgCO3) are shown in Fig. 2. Note the narrowness of the peaks in the synthesized 236
8
materials. No phase other than Mg calcite and/or dolomite was detected. No indication of
237
extended basal cation stacking order such as b-type ordering reflections characteristic of the
238
(𝑅3) ordered structure of dolomite was found in the synthetic carbonates in the range 2-45
239
mol% MgCO3. MgCc50 with 49.2 mol% MgCO3 is the only synthetic sample with this type of 240
ordering reflections. (1 0 4) peaks of OCN calcite, OCN dolomite and synthetic samples in the
241
range 2-50 mol% MgCO3 are shown in Fig. 3. The plots of the (3 0 0) and (0 0 12) peaks 242
(distinctive a and c basal reflections, respectively) are provided as supplementary materials
243
(Supp. Mat. Fig. S2). The three figures show the same general features and allow identifying
244
two groups of syntheses: a first group comprising the MgCc2 to MgCc26 samples is
245
characterized by narrow and symmetric peaks, a second group from MgCc28 to MgCc45
246
displays largely broadened and asymmetric peaks. The two groups will be referred to as low
247
and high-Mg synthetic calcites, respectively. Diffractograms of the high-Mg synthetic calcite
248
group can be analyzed in different ways: the peak broadening corresponds to a distribution
249
curve of single phase Mg calcites with either 1) different Mg compositions, 2) different sizes
250
and microdistortions (Ca/Mg disordering), or 3) different Mg compositions, sizes or
251
microdistortions (Ca/Mg disordering). Table 1 reports the Rietveld refinement results of the
252
simplest model involving three or four calcites with different compositions (and thus different
253
cell parameters) and similar peak broadening. The origin of peak broadening will be discussed
254
below. Refined unit cell parameters, microstructural parameters (FWHM broadening, size <L>
255
and microstrain <ɛ>) for, synthetic Mg calcites, synthetic dolomite and OCN crystals are given
256
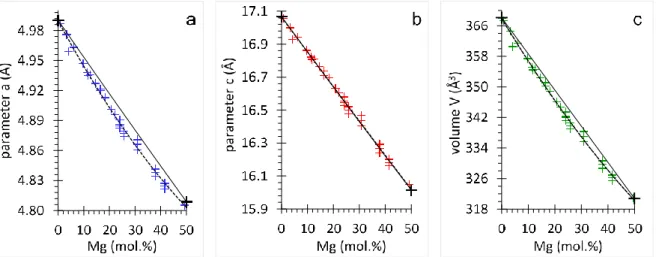
in Tables 1 and 2. Unit-cell parameters and volumes obtained for all synthetic samples are
257
shown as a function of their Mg contents in Fig. 4. For the high-Mg synthetic calcites, values
258
of the three phases used in the refinement are plotted in the diagram. The a and V parameters
259
show a small negative deviation from the Cc-Dol straight line, whereas the c parameter
260
displays almost no deviation. These parameters can be fit with a second degree polynomial
261 with R2>0.995: 262 a (Å) = 4.9897 - 0.4747 (XMg) + 0.2037 (XMg)2 263 c (Å) = 17.0643 - 2.1221 (XMg) + 0.0646 (XMg)2 264 V (Å3) = 367.9028 - 114.8121 (X Mg) + 38.4623 (XMg)2 265
(XMg: mole fraction of MgCO3 in the carbonate). 266
The fitting curves are shown in Fig.4. As stated by (Reeder 1983), d(1 0 4) has long been used to 267
determine the Mg content of rhombohedral carbonates. In the present study the following
268 relationship is determined: 269 d(1 0 4) (Å) = -0.003032 (XMg) + 3.033503 (R2= 0.994) 270 271
It should be noted that d(1 0 4) does not provide a unique description of the cell while lattice 272
parameters do, and thus cell parameters should be preferred to determine Mg contents in
Ca-273
Mg carbonates (Reeder 1983). For natural carbonates (including biominerals) that may
9
contain significant amounts of other components such as Fe, Mn, Sr, S, organic matrix, etc.,
275
direct measurements of compositions (by EMP for instance) should be preferred.
276
Note again that the substitution of Mg for Ca in Mg-calcite has been considered as fully
277
random and disordered in this analysis of the entire diffractograms. A more precise structural
278
model that would take into account preferential occupancy of Ca and Mg into octahedral sites
279
within domains, would possibly lead to better agreement-factor values. However in the
280
present state of our knowledge, too many variables remain undetermined to allow this type
281
of modelling with reasonable degree of confidence.
282
283
Fig. 2 HRXRPD patterns of (a) OCN calcite (black), (b) synthetic magnesian calcite MgCc24 (blue) and
284
(c) OCN dolomite (red) [wavelength of λ = 0.41068(1) Å (30 keV)]. Bragg peaks in the range 5.5 to 12° 285
(2 𝑅3𝑐 space group reflections in black, and 𝑅3 space group b-type ordering reflections in red 286
287
288
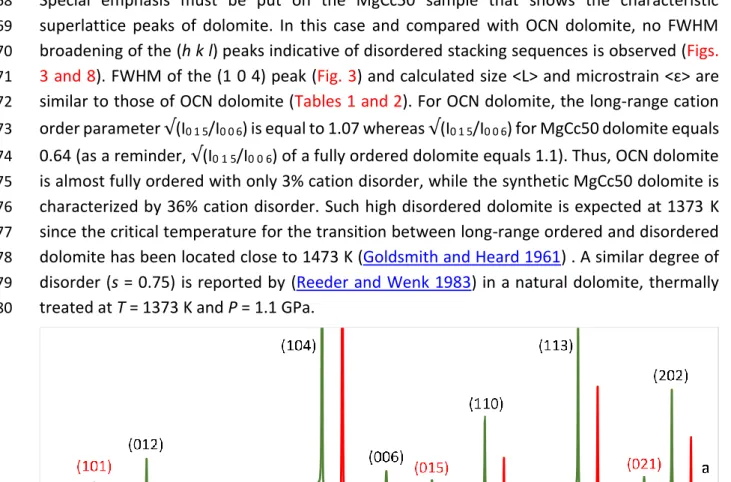
Fig. 3 Bragg (1 0 4) diffraction peaks of OCN calcite (black), synthetic magnesian calcites (MgCc2 to 289
MgCc45), synthetic MgCc50 dolomite and OCN dolomite (red) [wavelength of λ = 0.41068(1) Å (30 keV)] 290
1
10 291 292 293 294 295 296 297 298 299 300 301 302 303 304
Table 2 Refined unit cell parameters, microstructural parameters (FWHM broadening, size <L> and
305
microstrain <ɛ>) and conventional Rietveld R-factors for OCN calcite, dolomite, and magnesite 306
[wavelength of λ = 0.41068(1) Å (30 keV)] (Standard deviation in brackets) 307
308
Fig. 4 Unit cell parameters and volume as function of Mg composition for OCN calcite, OCN dolomite
309
(black plus) and for synthetic carbonate (blue, red and green plus). Dashed line is the quadratic least-310
square adjustment as discussed in the text. Solid line is the straight line between OCN calcite and OCN 311
dolomite 312
313
Single peak analysis and microstructural parameters
314 315
Short-range disorder in Mg calcites associated with the shift in position of atoms and
316
distortion of octahedral sites must generate variations of (h k l) l=even intensities because of
317
large differences in X-ray scattering factors between calcium and magnesium atoms.
318
Misorientation of carbonate ions must generate variations of (h k l) l=odd intensities. As far as
319
long-range order is concerned, the spatial extent and the structural nature of long range order
320
in Mg calcites domain must generate non-uniform widening of some families of reflections.
321
Below, both intensities and FWHM of the diffraction peaks are analyzed in order to
322
characterize both the structural short- and/or long-range order and the length of structural
323
coherence.
324
Samples Calcite Dolomite Magnesite Unit cell parameters
Space Group R3̅c Space Group R3̅ Space Group R3̅c a (Å) 4.98899(3) 4.80892(1) 4.63491(1) c (Å) 17.05813(2) 16.01536(5) 15.02125(5) FWHM(104) 2θ (°) 0.0072 0.0091 0.0104 size<L> (µ) 0.541 1.156 0.717 microstrain <ɛ> 10-3 0.197 0.144 0.129
Conventional Rietveld R-factors
Rp % 11.10 11.80 9.81 Rwp % 15.30 18.60 13.3 Rexp % 12.61 9.39 5.91 χ2 1.47 3.92 5.06 1
11
Intensities of several first (h k l) peaks for even and odd (l)s are shown in Figs. 5a and 5b as a
325
function of Mg contents, and they are compared to those calculated from randomly
326
disordered Mg calcite structure. Intensities of all (h k l) peaks vary linearly as a function of Mg
327
content. No particular (h k l) intensity variation as a function of Mg content is observed. Some
328
of them increase while others decrease. The deviations from linearity (SD = 0.10) are small
329
and not correlated to Mg content and (h k l) families. A small deviation could be attributed to
330
random distribution of structural distortions such as locally restricted cation ordering and
331
anion positional disorder (off-planar tilting of the CO3 groups) (Althoff 1977; Paquette and 332
Reeder 1990). In the present case, the deviations are erratic and prevent refining a better
333
structural model with confidence.
334 335
336
Fig. 5 Observed intensities of (h k l) peaks a) l=even (distortion of octahedral sites); b) l=odd
337
(misorientation of CO3 groups) of synthetic carbonates as a function of Mg composition for synthetic
338
carbonates (filled circles). The dashed line represents the intensities calculated for ideally disordered 339
Mg calcites. All observed and calculated intensity are normalized to the same scale factor. Intensity axis 340
is offset for each (h k l) for clarity 341
342
Concerning the FWHM, it has been mentioned earlier that two groups can be defined on the
343
basis of peak FWHM differences, as observed in Fig. 3 (see also Supp. Mat. Fig. S2). In the
low-344
Mg synthetic calcites (0-26 mol. % MgCO3), the FWHM variation of each (h k l) peak as a 345
function of Mg content is small (usually less than 0.3%) (SD in Fig. 6). The largest values and
346
variations are for (h k l) peaks with large l values such as (1 0 10) (2 0 8) (0 0 12) (0 2 10) and
347
(1 1 12). The (h k l) families with large l values are sensitive to local basal stacking disorder, but
348
here again we must remain cautious as differences with variations observed in OCN calcite are
349
small (Fig. 6). The structural distortions determined with the Williamson-Hall plot method are
350
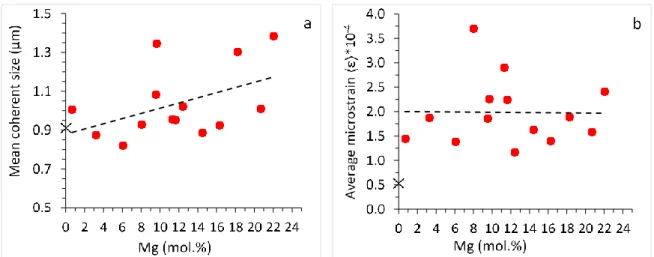
given in Table 1. The mean coherent domain size ⟨L⟩ [1.0 µm (SD = 0.2)] is similar to OCN calcite
351
(Fig. 7a). However, the average microstrain ⟨ε⟩= 2 10-4 (SD = 0.7 10-4), that is 4 times higher 352
12
than in OCN calcite (Fig. 7b), could be related to the random distribution of structural
353
distortions leading to small intensity deviations described above.
354
355
Fig. 6 FWHM of OCN calcite (h k l) peaks (black crosses). Mean FWHM of (h k l) peaks of 13 samples
356
of synthetic low-Mg carbonates (MgCc2 to MgCc26) (red dots, vertical bars are standard deviations) 357
358
Fig. 7 a) Mean coherent domain size ⟨L⟩; b) average microstrain values ⟨ε⟩ calculated by the
Williamson-359
Hall plot method for OCN calcite (black crosses) and for low-Mg synthetic carbonates (MgCc2 to 360
MgCc26) (red dots). Dashed lines are linear least-square fitting curves 361
In the case of high-Mg synthetic calcites, the FWHM of the diffraction peaks are three to four
362
time larger than low-Mg calcites (Fig. 3, Supp. Mat. Fig. S2). In addition, the peaks are
363
asymmetric whatever the Mg content, and in a similar way for each (h k l) peak family. Thus,
364
the FWHM broadening cannot be interpreted in terms of domain size and microstructural
365
defects but rather in terms of coexistence of tiny domains with different compositions in a
366
single crystal (Table 1). This interpretation will be developed in the discussion below.
367 1
1
13
Special emphasis must be put on the MgCc50 sample that shows the characteristic
368
superlattice peaks of dolomite. In this case and compared with OCN dolomite, no FWHM
369
broadening of the (h k l) peaks indicative of disordered stacking sequences is observed (Figs. 370
3 and 8). FWHM of the (1 0 4) peak (Fig. 3) and calculated size <L> and microstrain <ɛ> are
371
similar to those of OCN dolomite (Tables 1 and 2). For OCN dolomite, the long-range cation
372
order parameter √(I0 1 5/I0 0 6) is equal to 1.07 whereas √(I0 1 5/I0 0 6) for MgCc50 dolomite equals 373
0.64 (as a reminder, √(I0 1 5/I0 0 6) of a fully ordered dolomite equals 1.1). Thus, OCN dolomite 374
is almost fully ordered with only 3% cation disorder, while the synthetic MgCc50 dolomite is
375
characterized by 36% cation disorder. Such high disordered dolomite is expected at 1373 K
376
since the critical temperature for the transition between long-range ordered and disordered
377
dolomite has been located close to 1473 K (Goldsmith and Heard 1961) . A similar degree of
378
disorder (s = 0.75) is reported by (Reeder and Wenk 1983) in a natural dolomite, thermally
379
treated at T = 1373 K and P = 1.1 GPa.
380
Fig. 8 HRXRPD diffractograms of the OCN and synthetic MgCc50 dolomites (in red and green,
381
respectively) (wavelength of λ = 0.41068(1) Å (30 keV)). Bragg peaks in the 2 range from 5.5 to 12 (°). 382
Normal reflections and b-type ordering reflections for space group 𝑅3 are noted in black and red, 383
respectively. The red (OCN dolomite) has been shifted in 2 for clarity 384
Thermally processed magnesian calcite syntheses 385
OCN dolomite, and the synthetic MgCc24, MgCc40, and MgCc50 samples have been thermally
386
processed following the step-mode heating process previously used for OCN calcite and
387
MgCc10 (Floquet et al. 2015). In this previous work, no phase decomposition of OCN calcite
388
or MgCc10 was observed until 1073 K. As expected, the calcite unit cell showed contrasting
389
thermal contraction and expansion for the a and c parameters, respectively. For Mg calcite
390
MgCc10, the a cell parameter decreased until 673 K, then increased, while the c parameter
391
expanded monotonically all along the temperature range. Figs. 9 and 10 display the XRD
392
patterns collected at different temperatures for the MgCc24, MgCc40 and MgCc50 samples.
393 1
14
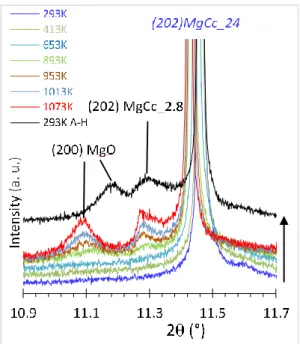
Fig. 9 - Selected HRXRPD diffractograms in the 10.9 -11.7 2 range of the synthetic MgCc24 sample
394
recorded from RT to T=1073 K and then back to RT after heating (293 K A-H), showing (1) the (2 0 2) 395
peaks of untransformed magnesian calcite (T in the range RT-653 K, indexes in italics) and partially 396
decomposed product (at T > 653 K), and (2) the (2 0 0) peak of MgO resulting from partial decomposition 397
(above 653 K). The black diffractogram collected at RT after annealing is shifted in intensity for clarity 398
(black vertical arrow). [wavelength of λ = 0.41068(1) Å (30 keV)] 399
400
Fig. 10 - a) HRXRPD patterns of synthetic MgCc40 recorded at RT (purple line, indexes in italics) and
401
after annealing back to RT (black line). The original material (high-Mg calcite) is partially transformed 402
into low-Mg calcite (~6.0 mol. % MgCO3) and MgO; b) HRXRPD patterns of the synthetic dolomite
403
MgCc50 recorded at RT before thermal processing (green line, and indexes in italics) and at RT after 404
annealing at 1073 K (black line). The original dolomite has been totally transformed into low Mg calcite 405
with ~ 5.1 mol.% MgCO3 and MgO. [wavelength of λ = 0.41068(1) Å (30 keV)]
406 407 408 1 1 (110) (113) (202)
15
Thermal decomposition of Mg calcites and dolomite
409 410
Refined unit cell parameters and FWHM of (1 0 4) peaks of the samples as a function of
411
temperature are given in Table 3 and as supplementary data (Supp. Mat. Tables S1 and S2).
412
Partial decomposition (PD) [or ‘half decomposition’ according to many authors (e.g. (Valverde 413
et al. 2015) and refs therein)] meaning that an original magnesian calcite progressively
414
decomposes at high temperature into a less magnesian calcite plus MgO, is observed for the
415
three samples. The beginning temperature of partial decomposition (TPD), decreases as the 416
Mg content increases. For instance, MgCc24, MgCc40, MgCc50 start forming low Mg calcite
417
(2.8 to 6 mol% MgCO3) and periclase at TPD of about 893 K, 833 K and 773 K, respectively (Figs. 418
9 and 10, Table 3). After annealing at 1073 K for 20 min followed by cooling down to RT,
419
MgCc24 and MgCc40 are only partially decomposed, whereas the dolomite sample (MgCc50)
420
is completely transformed into low Mg calcite (~ 5.1 mol. % MgCO3) and MgO. These 421
observations are in great part in agreement with those of (Reeder and Markgraf 1986) who
422
observed the beginning of dolomite decomposition at ~973 K and total transformation into
423
Mg calcite at ~1023 K in partial CO2 pressure. The average sizes of newly formed Mg calcite 424
and periclase determined from the FWHM of the peaks using the Scherrer method, <L> ~80
425
and ~50 nm, respectively, are similar to those reported from XRD analysis of the thermal
426
decomposition of dolomite. (Hashimoto et al. 1980; Rodriguez-Navarro et al. 2012)
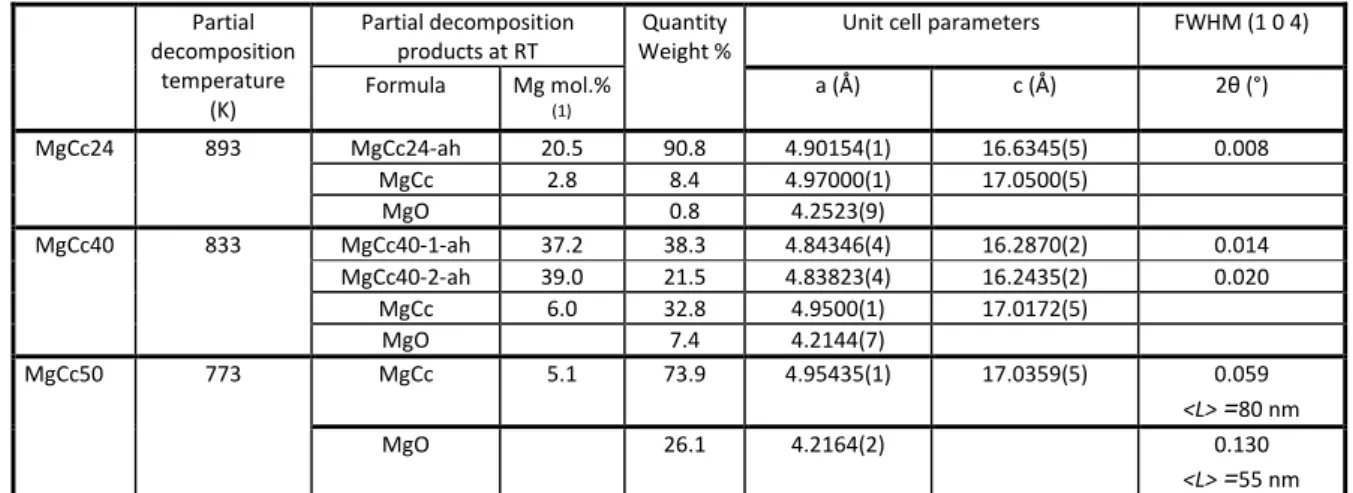
427 428 Partial decomposition temperature (K) Partial decomposition products at RT Quantity Weight %
Unit cell parameters FWHM (1 0 4) Formula Mg mol.% (1) a (Å) c (Å) 2θ (°) MgCc24 893 MgCc24-ah 20.5 90.8 4.90154(1) 16.6345(5) 0.008 MgCc 2.8 8.4 4.97000(1) 17.0500(5) MgO 0.8 4.2523(9) MgCc40 833 MgCc40-1-ah 37.2 38.3 4.84346(4) 16.2870(2) 0.014 MgCc40-2-ah 39.0 21.5 4.83823(4) 16.2435(2) 0.020 MgCc 6.0 32.8 4.9500(1) 17.0172(5) MgO 7.4 4.2144(7) MgCc50 773 MgCc 5.1 73.9 4.95435(1) 17.0359(5) 0.059 <L> =80 nm MgO 26.1 4.2164(2) 0.130 <L> =55 nm 429
Table 3 Partial decomposition temperature, composition, structural parameters (refined unit cell
430
parameters) and microstructural parameters (FWHM broadening, size <L>) of the decomposition 431
products measured at RT after final step of annealing at 1073 K for MgCc24, MgCc40 and MgCc50. 432
[wavelength of λ = 0.41068(1) Å (30 keV)]. (ah: after heating) 433
(1) Mg contents calculated from the present study calibration curve that links the V parameter to the Mg
434
content of synthetic Mg calcites (Fig. 4c) 435
436
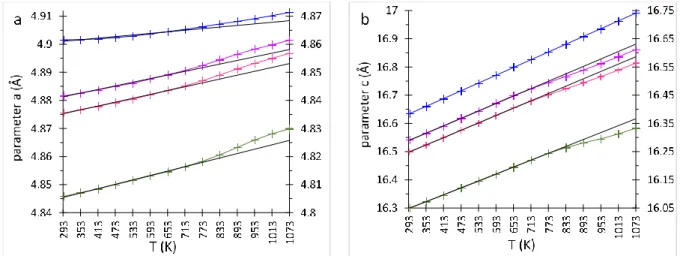
Variation of cell parameters with temperature
437
The variations of the unit cell parameters of MgCc24, MgCc40 and MgCc50 in the range
RT-438
1073 K are plotted in Fig. 11. Note that in the experiments undergoing partial decomposition,
439
cell parameters were determined on the remaining magnesian calcite that did not undergo
16
partial decomposition. The unit cell shows a thermal expansion for both a and c parameters,
441
even for MgCc24 with 20.7 mol% MgCO3. The temperature dependence of a, c and V is not 442
linear over the entire temperature range, as best observed in the c/a vs T plot (Supp. Mat. Fig. 443
S3). Note that for MgCc40, a model with two Mg compositions (MgCc40-1 and MgCc40-2) has
444
been used to refine the diffractogram, hence two curves are plotted in Figs. 11, Supp. Mat. 445
Fig. S3 for the MgCc40 experiment. The deviation from a linear expansion is positive for a, but
446
negative for c, except for MgCc24 that shows a linear expansion for c. The c/a ratio of the unit
447
cell deviates negatively from linearity at Tdif of about 653 K, 673 K and 773 K for MgCc24, 448
MgCc40 and MgCc50, respectively (Supp. Mat. Fig. S3). A similar deviation occurs at ~ 673 K
449
for MgCc10 due to the parabolic expansion of the a parameter (Floquet et al. 2015). The
450
change of the thermal unit cell deformation starts at a temperature (Tdif) lower than the 451
beginning of partial decomposition (TPD) for Mg calcite, and at the same temperature for the 452
synthetic dolomite (Tdif ~ TPD). 453
454
Fig. 11 Thermal expansion of the unit cell parameters a) a parameter; b) c parameter for synthetic
455
MgCc24 (blue), MgCc40-1 and 2 (purple and pink) and MgCc50 (green), respectively 456
Above, two important temperatures are put forward: Tdif which is the temperature of the 457
beginning of deviation from a linear expansion of the a, c (and V) parameter, and TPD the 458
temperature of beginning of partial half decomposition of Mg calcites. The physical meaning
459
of TPD is straightforward, as discussed above, while that of Tdif is not. On the basis of Raman 460
characterizations, it has been argued that significant short-range Ca-Mg cation order is
461
present in magnesian calcites that crystallized at 1273 K or 1373 K. Three reasons have been
462
invoked: (1) the wavenumbers of magnesian calcites are close to the calcite–dolomite line
463
(and not to calcite-magnesite), (2) the FWHM of the T, L, and 4 modes reach a maximum
464
around 30 ±5 mol% MgCO3, and (3) the active mode (2, A2g) in dolomite at 880 cm–1 is 465
observed in high-magnesian calcites above ~10 mol% MgCO3 (Perrin et al. 2016). It should be 466
noted also that short-range order greatly depends on temperature, it increases as
467
temperature decreases. Thus, Tdif is interpreted as the temperature at which re-ordering (by 468
diffusion) of calcium and magnesium atoms is activated to reach a more stable short-range
469
17
ordering configuration. For the studied Mg calcite samples, Tdif is lower than TPD and the two 470
processes are expected to produce effects on Bragg peaks as a function of temperature, in
471
addition to the thermal vibrational effect reflected in the Debye-Waller factors. Actually, the
472
partial decomposition is mainly related to the decrease of all (h k l) peak intensities. In
473
contrast, a short-range re-ordering should (1) produce thermal deviation excess of the cell
474
parameters and (2) lead to different variations of the (h k l) peak intensities, and therefore
475
could be detected by the variation of the intensity ratio as function of temperature.
476
Thermal expansion coefficients along the calcite-dolomite join
477
High-temperature single crystal (Markgraf and Reeder 1985; Reeder and Markgraf 1986) and
478
powder (Antao et al. 2009; De Aza et al. 2002; Merlini et al. 2016) diffraction experiments have
479
been conducted on calcite, dolomite and magnesite. The relative thermal expansion of the
480
cell parameters a/a293 K, c/c293 K of OCN calcite, OCN magnesite and synthetic MgCc50 dolomite
481
are compared to those of these previous data in Supp. Mat. Fig. S4. The comparison shows (1)
482
a good agreement between OCN crystal data with powder diffraction experiments, but small
483
discrepancies with single crystal experiments, (2) a marked deviation at about 773 K (Tdif) for 484
synthetic MgCc50 dolomite compared to OCN dolomite. Similarly, the relative thermal
485
expansion of the cell parameters for OCN calcite, synthetic MgCc10, MgCc24 MgCc40, and
486
MgCc50 are presented in Supp. Mat. Fig. S5. The Fig. illustrates (1) the change of slope of the
487
a parameter as a function of temperature, from negative to positive, at about 10 mol% MgCO3 488
(Supp. Mat. Fig. S5a), and (2) the deflection of slope of the c parameter as a function of
489
temperature, at about 653 K (Tdif) (Supp. Mat. Fig. S5b). The thermal coefficients obtained by 490
fitting the data to the usual second order polynomial curve are reported in Table 4. The
491
coefficient of thermal expansion of parameter x (x = a, c or V) αx= (1/x)(𝑑x/𝑑T) is obtained 492
by differentiating the polynomial expression of the thermal expansion x = f(T) and then
493
dividing by the x parameter (Dubrovinsky 2002).
494
The mean coefficient of thermal expansion over the temperature range from T1 to T2 is 495
expressed as α̅̅̅̅ =∫ α𝑋 x × dT ∫ dT⁄ T1T2 T2
T1
. Because of the noticeable deviation of the thermal
496
unit cell parameters at Tdif, the mean thermal expansion coefficients α̅̅̅, α𝑎 ̅̅̅ and α𝑐 ̅̅̅̅ are𝑉 497
calculated below and above Tdif, i. e. within two temperature ranges: 293 K-653 K (LT) and 653 498
K-1073 K (HT). The mean thermal expansion coefficients for the cell parameters are compared
499
to those of OCN calcite, magnesite and dolomite (De Aza et al. 2002) in Fig. 12, no
500
measurements on OCN dolomite was realized by ourselves.
501
The particular features of the thermal expansion coefficients of calcite, dolomite and
502
magnesite, in both low- and high-T ranges, are 1) the negative α̅̅̅ of calcite and 2) all 𝑎 503
coefficients of dolomite lie off of the calcite-magnesite line. These particularities were
504
comprehensively studied and discussed by (Markgraf and Reeder 1985; Reeder and Markgraf 505
1986). In the Ca-Mg carbonate structure, the variation of the c parameter is related to the
506
variation of lateral oxygen bonds of the (Ca,Mg)O6 octahedra, while the variation of the a 507
parameter is related to the variation of basal oxygen bond which is limited by the resistance
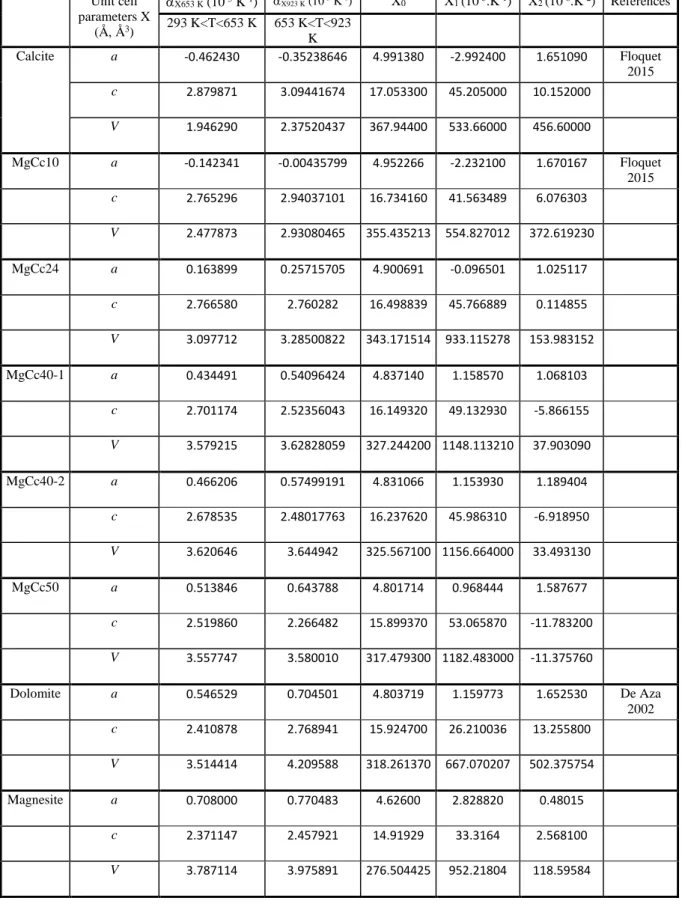
18 Unit cell parameters X (Å, Å3) X653 K (10-5 K-1) X923 K(10-5 K-1) X0 X1 (10-5.K-1) X2 (10-8.K-2) References 293 K<T<653 K 653 K<T<923 K Calcite a -0.462430 -0.35238646 4.991380 -2.992400 1.651090 Floquet 2015 c 2.879871 3.09441674 17.053300 45.205000 10.152000 V 1.946290 2.37520437 367.94400 533.66000 456.60000 MgCc10 a -0.142341 -0.00435799 4.952266 -2.232100 1.670167 Floquet 2015 c 2.765296 2.94037101 16.734160 41.563489 6.076303 V 2.477873 2.93080465 355.435213 554.827012 372.619230 MgCc24 a 0.163899 0.25715705 4.900691 -0.096501 1.025117 c 2.766580 2.760282 16.498839 45.766889 0.114855 V 3.097712 3.28500822 343.171514 933.115278 153.983152 MgCc40-1 a 0.434491 0.54096424 4.837140 1.158570 1.068103 c 2.701174 2.52356043 16.149320 49.132930 -5.866155 V 3.579215 3.62828059 327.244200 1148.113210 37.903090 MgCc40-2 a 0.466206 0.57499191 4.831066 1.153930 1.189404 c 2.678535 2.48017763 16.237620 45.986310 -6.918950 V 3.620646 3.644942 325.567100 1156.664000 33.493130 MgCc50 a 0.513846 0.643788 4.801714 0.968444 1.587677 c 2.519860 2.266482 15.899370 53.065870 -11.783200 V 3.557747 3.580010 317.479300 1182.483000 -11.375760 Dolomite a 0.546529 0.704501 4.803719 1.159773 1.652530 De Aza 2002 c 2.410878 2.768941 15.924700 26.210036 13.255800 V 3.514414 4.209588 318.261370 667.070207 502.375754 Magnesite a 0.708000 0.770483 4.62600 2.828820 0.48015 c 2.371147 2.457921 14.91929 33.3164 2.568100 V 3.787114 3.975891 276.504425 952.21804 118.59584 509
Table 4 Thermal expansion coefficients of unit cell parameters obtained by fitting the data to the
510 expression X(T)= X0 +X1 10-5T+X2 10-5T2 ; α̅̅̅ = (∫ αX X× d𝑇 ∫ d𝑇 T2 T1 ⁄ T2 T1
) 10-5K-1 is the mean linear
511
thermal coefficient between T1 and T2 , where αX= (1 x)(dx dT⁄ ⁄ ) is the thermal expansion coefficient
19 of parameter x (x = a, c or V) and T is the temperature (K). No thermal measurements on OCN dolomite 513
was realized by ourselves 514
515
of rigid (CO2-)
3 groups. Accordingly, the thermal c expansion and a contraction in calcite is 516
related to the strong anisotropy of the thermal expansion of the CaO6 octahedra and the large 517
magnitude of libration of the (CO2-)
3 group (Markgraf and Reeder, 1985; Reeder and Markgraf, 518
1986). In magnesite, characterized by the a and c thermal expansion, the thermal expansion
519
anisotropy of the MgO6 octahedra is moderate and the dominant motion of (CO2-)3 group is 520
the translation. In dolomite, the corner sharing between CaO6 and MgO6 octahedra in adjacent 521
layers induces a lack of anisotropy of the CaO6 octahedra and a low amplitude of both libration 522
and translation motions of the (CO2-)
3 group. Thus, the shift of the cell thermal expansion of 523
dolomite from the calcite – magnesite line is explained by the perfect structural stacking
524
alternating Ca and Mg basal planes on both sides of each CO3 plane. The systematic corner 525
sharing between CaO6 and MgO6 octahedra in dolomite is ruled out in the disordered 526
structures of MgCc calcites and dolomite. The thermal - structural relationships, as described
527
by (Markgraf and Reeder 1985; Reeder and Markgraf 1986), imply that the thermal behavior
528
of the synthetic MgCc calcites and MgCc50 dolomite is dependent of the structural
529
arrangement of the CaO6 and MgO6 octahedra. The thermal coefficients are expected in the 530
calcite – dolomite line for fully disordered MgCc calcites. Thus, a thermal coefficient excess
531
from the calcite – dolomite line would be characteristic of the structural order of CaO6 and 532
MgO6 octahedra. 533
In the low- and high-T range (Fig. 12), the mean thermal expansion coefficients of the synthetic
534
MgCc calcites and MgCc50 dolomite lie off of both calcite-dolomite and calcite-magnesite
535
lines. In the low-T range (Figs. 12 a to c), a significant positive deviation from the
calcite-536
dolomite line is observed for the α̅̅̅ and𝑎 α̅̅̅̅ coefficients, with a maximum deviation close to 𝑉 537
25 mol% MgCO3 for α̅̅̅. Conversely, the α𝑎 ̅̅̅ coefficients lie in between calcite - dolomite and 𝑐 538
calcite – magnesite line. In the high-T range, positive deviation from calcite-dolomite line
539
occurs for the α̅̅̅ coefficients (𝑎 Fig. 12d). On the contrary, large negative deviation are observed 540
for the α̅̅̅ and α𝑐 ̅̅̅̅ coefficients (𝑉 Figs. 12 e and f). 541
For the synthetic MgCc calcites and MgCc50 dolomite, in the LT range 273 K-653 K, the thermal
542
expansion excess (with respect to the calcite-dolomite line) is positive for a, c and V
543
(α̅̅̅𝑎 -6, α̅̅̅𝑐 -6, α̅̅̅̅𝑉 -6). These results are consistent with the thermal-544
structural relationships proposed by (Markgraf and Reeder 1985; Reeder and Markgraf 1986),
545
and could be related to the state of order-disorder as do the cell parameters that are similarly
546
deviating from the calcite-dolomite line (Fig. 4). In the HT range, excess is unchanged for a
547
(α̅̅̅𝑎 -6) but largely negative for c and V α̅̅̅𝑐 -6, α̅̅̅̅𝑉 -6). The differences 548
observed between the low- and high-T range comes from the positive and negative inflection
549
of the a and c parameters respectively, starting at Tdiff in all synthetic MgCc (Figs. 11 and Supp. 550
Mat. Fig. S3) whereas not recorded in OCN dolomite powder (De Aza et al. 2002; Merlini et al.
551
2016) and in dolomite single crystal (Reeder and Markgraf 1986) (Supp. Mat. Fig. S4).
552 553
20 554
Fig. 12 Mean thermal expansion coefficients of the cell parameters a, c andV as a function of Mg
555
content for OCN calcite and OCN magnesite (double crosses), natural dolomite (De Aza 2002) 556
(crosses), and for synthetic MgCc10, MgCc24, MgCc40 and MgCc50 (plus) : a to c Low-temperature 557
ranges (293-673 K) (blue) and d to f high-temperature ranges (653-923 K) (red)
558 559
Intensities and FWHMs of the Bragg peaks as a function of T. Interpretation of the data.
560
In the case of MgCc24 both intensity effects are detected. The variations of the (1 0 4) peak
561
intensities as a function of T for MgCc24 are shown in Fig. 13a. The regular shift of the (1 0 4)
562
peak towards lower 2values is due to the progressive change of cell parameters with
563
temperature. Concerning intensities, different zones can be defined: (1) intensities increase
564
between 293 K and 413 K, (2) intensities decrease regularly between 413 K and 713 K (=Tdif), 565
(3) a plateau is observed between Tdif (713 K) and TPD (953 K), (4) intensities decrease past TPD. 566
Interestingly, the two patterns determined at RT before (initial sample) and after annealing
567
(remaining undecomposed sample) are almost identical (Supp. Mat. Table S1). Besides, the
568
intensity ratio I(1 0 4)/I(1 1 0) and I(1 0 4)/I(1 1 3) shown in Fig. 13b displays two marked slope
569
disruptions at 713 K and 953 K relevant to both diffusion and decomposition processes.
570
However, no notable FWHM effect on the Bragg peaks was detected. The variations of (h k l)
571
FWHMs as a function of T are unrelated to the Mg content of the samples, the variations
572
among different samples are not significant (Supp. Mat. Table S1), and no irregularity is
573
observed even for (h k l) peaks with large l values such as (0 1 8) (0 0 12) (0 2 10) and (1 1 12).
574
1
21
Concerning the synthetic dolomite MgCc50, Tdif equals TPD and normal and b-type peak 575
intensities display different behaviors. Normal peak intensities (e.g. 0 0 6) plotted in Fig. 14 576
decrease progressively up to Tdif = TPD = 773 K, then faster above Tdif. This observation is valid 577
for all normal peaks. On the other hand, b-type peak intensities [e.g. (0 1 5)] decrease up to
578
Tdif, then increase up to 1013 K (Fig. 14).
579
580
Fig. 13 a) Bragg (1 0 4) diffraction peaks for MgCc24; b) Intensity ratio I(1 0 4)/I(1 1 3) and I(1 0 4)/I(1
581
1 0) for MgCc24 (wavelength of λ = 0.41068(1) Å (30 keV)) recorded from RT to T=1073 K. Note the 582
slope breaks at 713 K and 953 K 583
584
Fig. 14 a) HRXRPD patterns in the 2 range corresponding to the (0 0 6) and (0 1 5) peaks; b) Intensity 585
ratio I(0 1 5)/I(0 0 6) (green plus) and √(I0 1 5/I0 0 6) order parameter(black crosses) for MgCc50 (Ca-586
dolomite) from RT to T=1073 K (wavelength of λ = 0.41068(1) Å (30 keV)) 587
These data indicate that cation long-range reordering within the dolomite structure starts at
588
773 K. The order parameter √(I0 1 5/I0 0 6) shows that the MgCc50 dolomite is almost fully 589
ordered at T= 1073 K, with less than 10% cation disordering (Fig. 14b) which is not surprising
590
since ordered dolomite is expected at 1073 K. (Hammouda et al. 2011; Zucchini et al. 2012).
591
In addition, (Goldsmith et al. 1961; Reeder and Wenk 1983) concluded that cation ordering in
592
1
22
dolomite results in a decrease of c and a slight increase of a, thus a marked decrease of the
593
c/a ratio. Data reported above with c/a of MgCc50 deviating from linearity at Tdif (Supp. Mat.
594
Fig. S3) is interpreted as an effect of cation ordering activated by temperature, in a disordered
595
dolomite initially synthesized at 1373 K. Similarly to MgCc50, the changes of cell parameters
596
arising at Tdif = 653 K, 673 K for MgCc10, MgCc24 and MgCc40 are interpreted in terms of 597
ordering process in partially disordered Mg calcite samples synthesized at 1273 K or 1373 K.
598
Note that in the case of MgCc50, both short- and long-range ordering is implicated while in
599
more calcitic syntheses only short-range ordering would be implied. Summarizing, in the range
600
RT-Tdif, the variation of cell parameters is simply due to a thermal effect. Above Tdif, both 601
thermal effect and cation ordering affect the cell parameters. More interactive and interlinked
602
effects are expected once the partial decomposition starts.
603
Discussion
604605
Comparison with previous data and interpretation of high-Mg calcite XRD patterns 606
607
Our data are consistent with previous experimental studies (Byrnes and Wyllie 1981;
608
Goldsmith et al. 1955; Goldsmith and Heard 1961; Harker and Tuttle 1955; Irving and Wyllie 609
1975; Newton et al. 1969) that predict a continuous (or almost continuous) solid solution
610
between CaCO3 and (Ca0.5Mg0.5)CO3, in the pressure and temperature conditions of our 611
experiments. Indeed, (Goldsmith and Heard 1961) locate the top of the calcite-dolomite
612
solvus at a temperature of 1348 K and a composition of 43 mol% MgCO3. The variation of cell 613
parameters as a function of composition are in agreement with most previous studies
614
(Bischoff et al. 1983; Goldsmith et al. 1958; Goldsmith et al. 1961) but disagree with the results
615
of (Zhang et al. 2010) that strongly deviate from previous data, particularly above 30 mol%
616
MgCO3 (Fig. 1). 617
The identification of two groups characterized either by narrow and symmetric peaks (low-Mg
618
synthetic calcites: MgCc2-MgCc26) or broadened and asymmetric peaks (high-Mg synthetic
619
calcites: MgCc28 to MgCc45) is of major importance and deserves further interpretation. First
620
of all, the features on which the separation into two groups are robust since (1) all MgCc above
621
26 mol% MgCO3 display similar patterns, (2) higher temperatures (1373 K instead of 1273 K) 622
and pressure (1.5 GPa instead of 1 GPa) are not responsible for the peak widening because
623
two of the high-Mg calcites (MgCc28 and 30) synthesized at 1273 K, 1 GPa display similar broad
624
peaks. Actually, the broadening of the peaks corresponds to (1) a compositional variability in
625
the high-Mg calcites of the order of ± 1 mol% MgCO3, (2) a mean apparent strain ⟨ε⟩ of about 626
410-3 against 210-4 in low Mg-calcites, (3) both effects of compositional heterogeneity. One 627
of them could be related to compositional variation between crystals as determined by EMP
628
of the order of ± 0.8 mol% MgCO3. But the second, finer level of compositional heterogeneity 629
could be due to the coexistence in a given crystal of coherent scattering domains, the
630
components of which have different cation ordering and slightly different compositions and
631
are producing microstructural strain. The actual distribution of Ca and Mg in each microcrystal
23
cannot be determined because the broadening of the diffraction peaks depends also on the
633
strain, size and distribution of the coherent scattering domains. Nanoscale heterogeneous
634
microstructures are very common in Ca rich dolomite natural samples. They were reported in
635
numerous HRTEM studies by interpreting HAADF image modulations and satellite reflections
636
in the diffraction patterns (Fang and Xu 2019; Larsson and Christy 2008; Meike et al. 1988;
637
Reksten 1990; Shen et al. 2014; Van Tendeloo et al. 1985; Wenk et al. 1991). But actually, if
638
many microstructures were proposed at the nanometric scale, no further structural details of
639
the domain model would be provided at the micrometric scale by single crystal diffraction
640
method (Reeder 2000) - natural dolomites with 44 and 45.5 mol% MgCO3 - sorder = 0.84 and
641
0.71) and by comprehensive Rietveld techniques (Drits et al. 2005) natural dolomites with
642
45.1, 47.8 and 48.4 mol% MgCO3). Considering all this, it is very likely that the constraints on
643
cation order in Ca rich dolomite similarly occur in the high-Mg synthetic calcite. Clearly, further
644
studies are required to validate the nanoscale compositional heterogeneity, but additional
645
valuable insights at the short-range-order scale could be given from our previous Raman data
646
(Perrin et al. 2016), as discussed below.
647 648
Length scales of the cationic disorder state 649
Unit-cell parameters and volume obtained for all the MgCc samples show small deviations
650
from the almost straight calcite-dolomite-magnesite line. Assuming that a total disordered
651
MgCc corresponds to an ideal solid solution and plots along the straight line, the strain
652
associated with the partial order (p-ord) - total disorder (t-dis) transformation is defined as X 653
= (Xp-ord –Xt-dis)/Xt-dis = ∆X / Xt-dis where Xp-ord is the value of a, c or V obtained for a MgCc sample
654
and Xt-dis is the value of a, c or V calculated for the same composition from the straight line
655
through the end-members. The strains ac, V calculated for the a, c and V parameters, for 656
all the MgCc samples are plotted as a function of the Mg content in Fig. 15.
657
Fig. 15 Strain in magnesian calcites at RT as a function of Mg content a) a;b)c; c) V; (black: OCN
658
calcite and OCN dolomite; blue: low-Mg synthetic samples; red: high-Mg and MgCc50 synthetic 659
samples) 660