HAL Id: inserm-00726672
https://www.hal.inserm.fr/inserm-00726672
Submitted on 31 Aug 2012
HAL is a multi-disciplinary open access
archive for the deposit and dissemination of
sci-entific research documents, whether they are
pub-lished or not. The documents may come from
teaching and research institutions in France or
abroad, or from public or private research centers.
L’archive ouverte pluridisciplinaire HAL, est
destinée au dépôt et à la diffusion de documents
scientifiques de niveau recherche, publiés ou non,
émanant des établissements d’enseignement et de
recherche français ou étrangers, des laboratoires
publics ou privés.
Specification Suggests New Roles of Metabolic and
Epigenetic Genes.
Said Assou, Imène Boumela, Delphine Haouzi, Cécile Monzo, Hervé Dechaud,
Issac-Jacques Kadoch, Samir Hamamah
To cite this version:
Said Assou, Imène Boumela, Delphine Haouzi, Cécile Monzo, Hervé Dechaud, et al.. Transcriptome
Analysis during Human Trophectoderm Specification Suggests New Roles of Metabolic and Epigenetic
Genes.. PLoS ONE, Public Library of Science, 2012, 7 (6), pp.e39306. �10.1371/journal.pone.0039306�.
�inserm-00726672�
Specification Suggests New Roles of Metabolic and
Epigenetic Genes
Said Assou1,2., Ime`ne Boumela1,2., Delphine Haouzi1, Ce´cile Monzo1,2, Herve´ Dechaud1,2,3, Issac-Jacques Kadoch4, Samir Hamamah1,2,3*
1 CHU Montpellier, Institute for Research in Biotherapy, Hoˆpital Saint-Eloi, INSERM U1040, Montpellier, France, 2 Universite´ MONTPELLIER1, UFR de Me´decine, Montpellier, France,3 ART-PGD department, CHU Montpellier, Hoˆpital Arnaud de Villeneuve, Montpellier, France, 4 De´partement d’Obste´trique Gyne´cologie, Universite´ de Montre´al, Hoˆpital Saint-Luc du CHUM, Montre´al, Canada
Abstract
In humans, successful pregnancy depends on a cascade of dynamic events during early embryonic development. Unfortunately, molecular data on these critical events is scarce. To improve our understanding of the molecular mechanisms that govern the specification/development of the trophoblast cell lineage, the transcriptome of human trophectoderm (TE) cells from day 5 blastocysts was compared to that of single day 3 embryos from our in vitro fertilization program by using Human Genome U133 Plus 2.0 microarrays. Some of the microarray data were validated by quantitative RT-PCR. The TE molecular signature included 2,196 transcripts, among which were genes already known to be TE-specific (GATA2, GATA3 and GCM1) but also genes involved in trophoblast invasion (MUC15), chromatin remodeling (specifically the DNA methyltransferase DNMT3L) and steroid metabolism (HSD3B1, HSD17B1 and FDX1). In day 3 human embryos 1,714 transcripts were specifically up-regulated. Besides stemness genes such as NANOG and DPPA2, this signature included genes belonging to the NLR family (NALP4, 5, 9, 11 and 13), Ret finger protein-like family (RFPL1, 2 and 3), Melanoma Antigen family (MAGEA1, 2, 3, 5, 6 and 12) and previously unreported transcripts, such as MBD3L2 and ZSCAN4. This study provides a comprehensive outlook of the genes that are expressed during the initial embryo-trophectoderm transition in humans. Further understanding of the biological functions of the key genes involved in steroidogenesis and epigenetic regulation of transcription that are up-regulated in TE cells may clarify their contribution to TE specification and might also provide new biomarkers for the selection of viable and competent blastocysts.
Citation: Assou S, Boumela I, Haouzi D, Monzo C, Dechaud H, et al. (2012) Transcriptome Analysis during Human Trophectoderm Specification Suggests New Roles of Metabolic and Epigenetic Genes. PLoS ONE 7(6): e39306. doi:10.1371/journal.pone.0039306
Editor: Francisco Jose´ Esteban, University of Jae´n, Spain
Received December 8, 2011; Accepted May 18, 2012; Published June 22, 2012
Copyright: ß 2012 Assou et al. This is an open-access article distributed under the terms of the Creative Commons Attribution License, which permits unrestricted use, distribution, and reproduction in any medium, provided the original author and source are credited.
Funding: This work was supported by Ferring and Genevrier pharmaceutical companies. The funders had no role in study design, data collection and analysis, decision to publish, or preparation of the manuscript
Competing Interests: The authors have read the journal’s policy and have the following conflicts: This study was funded by Ferring and Genevrier pharmaceutical companies. This does not alter the authors’ adherence to all the PLoS ONE policies on sharing data and materials.
* E-mail: [email protected] .These authors contributed equally to this work.
Introduction
Pre-implantation development of mammalian embryos encom-passes a series of critical dynamic events, such as the transition from a single-cell zygote to a multicellular blastocyst and the first segregation of cells within the embryo with the formation of the inner cell mass (ICM) surrounded by trophectoderm (TE) cells. ICM retains pluripotency and gives rise to the embryo proper, whereas TE cells play an important role in embryonic implanta-tion in the uterine endometrium and placental formaimplanta-tion. In humans, the embryonic genome activation (EGA) program is functional by day 3 after fertilization [1]. The 6–8 cell stage embryo (day 3 post-fertilization) starts the process of ‘‘compaction’’ that leads to the generation of the tightly organized cell mass of the morula and is followed by differentiation of the morula into a blastocyst [2]. The transition from day 3 embryos to day 5 blastocysts is likely to be controlled by many and specific changes in the expression of different genes as this process involves both
cellular differentiation and transcriptional reprogramming. Al-though some genes that are specifically expressed in day 3 human embryos and in TE cells, such as CCNA1 and GATA3 respectively have been identified [3,4], our knowledge on the changes in gene expression associated with the initial embryo-TE transition and the specification of the TE cell lineage is still limited. In addition, since TE biopsies from day 5 human blastocysts might become a reliable alternative to blastomere biopsies to assess the expression of biomarkers of embryo viability [5], a better knowledge of the genes that are specifically expressed in TE cells and the embryo proper is crucial. Recent technological advances in mRNA amplification methods and DNA microarray assays have allowed the simultaneous analysis of the transcript level of thousands of genes in one experiment, thus offering a global view of the molecular events regulating physiological functions and cellular processes [6,7]. Indeed, these methodologies have already contributed to improving our knowledge on the genetic network controlling key stages of pre-implantation embryo development
[8,9,10,11]. In this study, we used high-density oligonucleotide Affymetrix HG-U133P microarray chips to analyze the gene transcription profiles of single day 3 human embryos and TE cells isolated from day 5 blastocysts. By comparing the transcriptomes of TE cells and day 3 embryos, we identified the specific molecular signature of human TE cells. These findings should provide a base for investigating the molecular mechanisms of the embryo-TE transition as well as important insights for the development of diagnostic tests to test blastocyst quality in assisted reproduction programs.
Results
Dynamic Changes in Overall Gene Expression in Mature MII Oocytes, Single Day 3 Embryos, TE Cells from Day 5 Blastocysts and hESCs
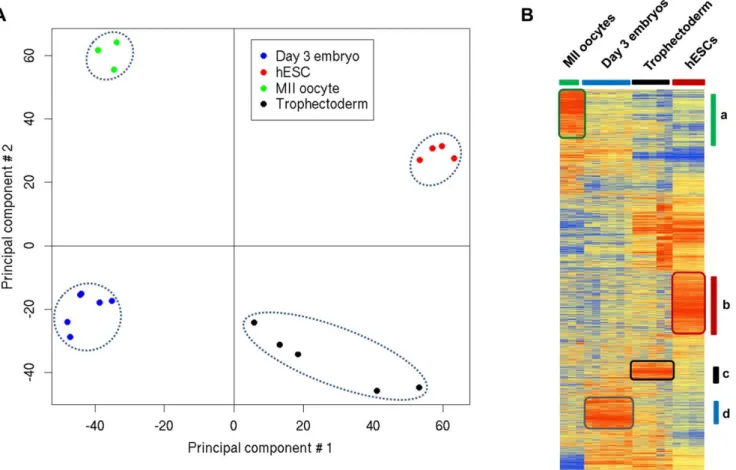
In order to determine the global gene expression variation in the different samples, we established the gene expression profile of mature MII oocytes (n = 3), day 3 single embryos (n = 6), TE samples from day 5 blastocysts (n = 5) and hESCs (n = 4) (to represent the ICM) by using high-density oligonucleotide Affyme-trix HG-U133P microarray chips. A non-supervised analysis using the principal components analysis (PCA) showed that samples from the same group clustered together very tightly (Figure 1A), corroborating the robustness of the Affymetrix microarrays [12]. Moreover, a non-supervised hierarchical clustering analysis of the array data (based on 15,000 genes) clustered perfectly the different samples, confirming their very specific expression profiles (Figure 1B). Finally, a scatter plot analysis (Figure S1) showed that expression variations between mature MII oocytes and single day 3 embryos were high as illustrated by the dispersed scatter plots and the low correlation coefficient (0.51). Conversely, the differences in gene expression between day 3 embryos and TE or hESC samples were lower as indicated by the tighter scatter plots and the high correlation coefficients (0.60–0.76) (Figure S1). These results reveal dynamic transcriptome changes during the transition from mature oocyte to day 3 embryo and from day 3 embryo to blastocyst. These ‘‘dynamic patterns’’ are due to the large-scale degradation of human maternal transcripts and the activation of embryonic genes, as was also observed in the mouse [10,13].
Comparison of the Gene Expression Profiles of Day 3 Embryos and TE Cells Isolated from Day 5 Blastocysts
We then compared the expression profiles of day 3 embryos and TE cells, by using the significance analysis of microarrays (SAM) software with a 2-fold change cut-off and false discovery rate (FDR) ,1%. We found that 2,196 transcripts were up-regulated in human TE cells (‘‘TE molecular signature’’) and 1,714 in day 3 embryos (‘‘day 3 embryo molecular signature’’) (Figure 2). The comprehensive lists of these signatures are presented in Tables S1 and S2 and the 100 genes with the highest fold change and significant statistical value (FDR = 0) for each signature are listed in Table 1 and 2. The ‘‘day 3 embryo molecular signature’’ included the Developmental Pluripotency Associated gene 5 (DPPA5), members of the Ret finger protein-like gene family (RFPL1, 2 and 3), of the NLR family (NALP4, 5, 9, 11 and 13), and of the melanoma antigen family (MAGEA1, 2, 3, 5, 6 and 12). Several maternal genes were found in this signature, such as members of the Zona Pellucida gene family (ZP2, 3 and 4), ZAR1, AURKC and FIGLA, suggesting that they are still active in day 3 embryos. Several transcription factors were also significantly over-expressed in day 3 embryos, such as TFB1M and TFB2M, the transcriptional regulators MBD3L2 and ZSCAN4, as well as metabolic genes such as Pyruvate Dehydrogenase Kinase 3
(PDK3) and Lactate Dehydrogenases (LDHC). The ‘‘TE molecular signature’’ comprised genes important for placental development (PGF and TFAP2A), cytoskeleton-associated genes (Keratin 18 and 19), and genes encoding S100 calcium binding proteins (S100P, S100A6, 10, 13, 14 and 16), retinoid receptor-related testis-associated receptors (NR2F2 and NR2F6) or the B receptor (CCKBR). Moreover, genes encoding extracellular matrix proteins, such as Laminins (LAMA1, LAMA5 and LAMC1) and Integrins (ITGB4 and ITGB5) were also up-regulated. Gene ontology (GO) annotations were used to explore the specific functional properties of the two molecular signatures (Figure 3). The day 3 embryo molecular signature was enriched in genes associated with localization in the ‘‘nucleus’’, while genes associated with the ‘‘cytoplasm’’ localization were over-represented in the TE molecular signature. Concerning the ‘‘biological processes’’, the day 3 embryo molecular signature was enriched in genes involved in the regulation of cellular processes, transcription and post-translational protein modifications. Conversely, in the TE molecular signature, genes connected with different metabolic and steroid biosynthetic processes were over-represented. The ‘‘molecular function’’ analysis showed that genes involved in oxido-reductase activity were significantly enriched in the TE signature (p,0.001), whereas genes related to ‘‘GTPase activity’’ and DNA binding were over-represented in the day 3 embryo signature. Finally, the expression pattern of 11 genes belonging to the TE (GATA3, LAMA1, KRT18, HSD3B1, HSD17B1 and DNMT3L) or to the day 3 embryo molecular signature (MBD3L2, CCNA1, BIK, RFPL2 and FIGLA) was confirmed by qRT-PCR analysis using specific primer pairs (Table S3). All qRT-PCR data were normalized to GAPDH to control for variations in mRNA recovery and RT efficiency (Figure S2).
Expression of Genes Encoding Proteins which Play a Role in Apoptosis in Day 3 Embryos and TE Samples
We then investigated the expression of genes coding for proteins linked to the extrinsic and intrinsic apoptosis pathways in day 3 embryos and TE cells. The expression of genes of the TNF ligand and receptor family was not different in day 3 embryos and TE cells. Conversely, several genes belonging to the BCL-2, BIRC and Caspase families appeared to be differentially expressed in the two groups (Figure 4A). Specifically, the BCL-2 family members BCL2L10 (637, FDR ,0.0001), BCL2L11 (616, FDR ,0.001), and BIK (63.7, FDR ,0.001), the expression of which was validated by qRT-PCR (Figure 3), and the BIRC family member BIRC2 (64, FDR ,0.001) were up-regulated in day 3 embryos. Caspase 6 (63, FDR ,0.001) was over-expressed in TE cells. MCL-1, a gene that belongs to the BCL2 family and promotes cell survival, was strongly expressed in both day 3 embryos and TE samples.
Evaluation of DNA Repair Regulation in Day 3 Embryos and TE Samples
The microarrays data were also used to investigate the expression of a comprehensive list of DNA repair genes [14] in day 3 embryos and TE samples (Tables S1 and S2). Of the 123 DNA damage repair genes investigated, five [UNG, RFC1, UNG2 (now named CCNO), PCNA, MSH2] were up-regulated in day 3 embryos and eleven [BRCA1, TDG, FANCG, FEN1, XRCC5, XRCC6, XPC, MUTYH, XPA, SMUG1, POLD2] in TE cells. We then analyzed the functional relationship between the DNA damage repair genes that were differentially expressed in TE samples and day 3 embryos using the Ingenuity Pathway Analysis (IPA) software. In both cases, all the DNA repair genes displayed a
documented functional interaction with each other, forming a tightly connected network (Figure S3).
Stemness Genes and Transcriptional Regulatory Networks Identified in Day 3 Embryos and TE Cells
We then performed a stemness gene enrichment analysis using a previously published dataset from hESCs, in which we defined a consensus hESC stemness gene list (n = 48 genes) [7]. The key stemness factors NANOG, POU5F1 (OCT3/4) and SOX2 [15] were enriched in day 3 human embryos, whereas DNMT3B, LIN28, PHF17, SEPHS1 were over-represented in TE cells. Conversely, other genes, such as UGP2 and PIM2, were enriched in both day 3 embryos and TE samples (Figure 4B). Bioinformatic gene pathway analysis (Ingenuity software) of the day 3 embryo molecular signature showed that many genes of the NANOG signaling pathway, including NANOG (Figure 5), were up-regulated in day 3 human embryos, thus confirming the role of NANOG in the maintenance of pluripotency [16]. The ‘‘TE molecular signature’’ included transcription factors such as GCM1, which is induced by Transforming Growth Factor-b (TGF-b) [17], and Bone Morpho-genic Protein 4 (BMP4) that induces the differentiation of pluripotent stem cells to trophoblast cells [18,19]. Other compo-nents of the TGF-b signaling cascade, such as Transforming Growth Factor Beta Receptor III (TGFBRIII), were also included in the ‘‘TE molecular signature’’.
Dynamic Expression of Epigenetic and Metabolic Regulators During Trophoblast Development
Since specification of the TE lineage during blastocyst formation involves initiation of differentiation, it is likely that epigenetic regulators may have an important role in this first developmental decision. The majority of the epigenetic regulators that were up-regulated in TE cells are associated with a repressive epigenetic status (Figure 5). Specifically, the expression of the DNA methyl transferases (DNMT) DNMT3A, DNMT3B and DNMT1 increased between 2- and 13-fold in TE cells in comparison to day 3 embryos. DNMT3L expression was 70-fold higher in TE samples than in day 3 embryos. Similarly, several transcripts coding for proteins involved in chromatin remodeling and histone modifica-tion (SMARCA4, SMARCC1 and SMARCE1) were up-regulated between 2- and 7-fold in TE cells. Conversely, many histone deacetylases (HDAC9and HDAC2) and histone acetyltransferases (HAT1, SETD8, RNF20, TAF1, STK17B, 31, 32B and 35) were down-regulated in TE cells in comparison to day 3 embryos. Another feature of the TE molecular signature was the up-regulation of several metabolic genes. Specifically, genes that are involved in estrogen biosynthesis (CYP11A1 x35, CYP19A1 x14) and lipid metabolism (PTGES x20) were strongly up-regulated in TE cells. One of the most striking observations was the high expression of genes that are involved in steroidogenesis (HSD3B1 6383, STS 6135, HSD17B1 6108, FDX1 614 and SRA1 66).
Figure 1. Gene expression patterns of day 3 human embryos, mature MII oocytes, TE cells and hESC cells. (A) PCA two-dimensional scatter plots represent the differential gene expression patterns of the different human samples. Each dot represents a sample and the color its origin: oocytes (green dots), day 3 embryos (blue dots), TE from day 5 embryos (black dots) and hESCs (red dots). Samples can be divided in four distinct areas based on their gene expression. (B) Average-link hierarchical clustering of 15,000 genes delineated four major gene clusters: (a) genes specifically detected in mature MII oocytes; (b) genes over-expressed in hESCs; (c) genes up-regulated in TE and (d) genes specifically over-expressed in day 3 embryos.
Intersection with the Transcriptomes of Mature MII Oocytes and hESCs
In an effort to link the genes involved in the day 3 embryo-TE transition with early embryonic development, we further investi-gated differences and similarities in the gene expression patterns of MII oocytes, day 3 embryos, TE cells and hESCs samples (comprehensive list in Table S4). The genes that were found to be up-regulated in day 3 embryos (Table S1) and TE cells (Table S2) were individually compared to those up-regulated in MII oocytes and hESCs using Venn diagrams (Figure S4). Only 36 genes were common to both the TE and the MII oocyte signatures. On the other hand, day 3 embryos and MII oocytes shared a set of 511 genes, among which many are associated with oogenesis, such as DAZL, GDF9 and FIGLA. Finally, 1263 genes were common to both TE and hESC profiles, whereas only 124 genes were shared by day 3 embryos and the hESCs. Genes that were up-regulated in both TE and hESC samples were associated with cell death and proliferation (BAG6, CASP2 and ANXA3), metabolism (GCDH and HPGD) and WNT signaling (FZD5, AXIN1 and TCF3). Genes that were up-regulated in both day 3 embryos and hESCs (124 genes) are involved in the maintenance of pluripotency and tissue development, such as NANOG. Among the genes specifically up-regulated in TE samples (644 genes), key genes related to epigenetic and metabolic pathways, such as DNMT3L, HSD3B1 and HSD17B1, were observed.
Discussion
Here, we compared the transcriptomes of day 3 human embryos and TE cells from day 5 human blastocysts to identify transcripts that are differentially expressed during the embryo-to-TE transition and the specification of the embryo-to-TE cell lineage. Many of the genes that were up-regulated in TE cells are already known to be associated with human TE differentiation [20,21]. For instance, we confirmed that GATA3 and KRT18, two trophoblast-determin-ing genes, are enriched in TE from human blastocysts [22]. Moreover, the ‘‘TE molecular signature’’ included also unexpect-ed genes, the TE-specificity of which has been overlookunexpect-ed. For instance, CCKBR activates signaling pathways involved in cell proliferation or migration [23,24] and stimulates the expression of b1-Integrin in vitro [25]. A number of cell adhesion genes that might be implicated in the embryo attachment to the endometri-um were also up-regulated in TE cells, including members of the Integrin family (ITGB5) and genes related to extracellular matrix remodeling, such as Laminins (LAMA1 and LAMC1). In humans, active steroid hormones, including progesterone that is secreted by mouse TE cells [26], are essential for implantation and mainte-nance of pregnancy. Our analysis reveals that HSD3B1, HSD17B1 and FDX1, which encode enzymes involved in the metabolism of cholesterol, were specifically up-regulated in TE cells in compar-ison to day 3 embryos (Figure S5). Moreover, PTGES (Prosta-glandin E synthase) as well as CYP11A1 and CYP19A1 (estrogen synthesis) were also up-regulated in TE cells, suggesting a central role of these steroidogenic enzymes in TE steroid biosynthesis and
Figure 2. Day 3 embryo and TE molecular signatures: Heat map of the molecular signatures in six day 3 embryos and five TE samples. Each horizontal line represents a gene and each column represents a single sample. The color intensity indicates the level of gene expression (red for up-regulation and blue for down-up-regulation) ‘‘see also Table S1 and S2’’.
metabolism. Thus, the TE joins the group of tissues with ‘‘steroidogenic’’ activity, such as brain, heart, gonads, endometri-um and placenta [27,28]. It is now important to compare the steroidogenic gene expression profiles in TE cells isolated from good and bad quality blastocysts to fully correlate specific transcriptional events with efficient TE development.
Among the models used to study trophoblast development, hESCs have emerged as a useful tool to examine the emergence and differentiation of TE cells. Particularly, the transcriptomic analysis of TE cells derived from hESCs has provided new insights into the signaling pathways and the molecular mechanisms underlying early trophoblast development. Recently, by using a microarray approach, Marchand and colleagues investigated gene expression during differentiation of hESCs into the trophoblast lineage upon addition of Bone Morphogenetic Protein 4 (BMP4) for 10 days and identified 670 genes that were up-regulated from day 0 to day 10 [29]. By intersecting these genes with those we found to be up-regulated in TE cells isolated from day 5 embryos, we found 104 common genes (see Table S5) among which there were not only trophoblast markers (for instance, GATA3 and
KRT19), but also many genes implicated in lipid metabolism and estrogen biosynthesis (i.e., CYP19A1, CYP11A1, HSD17B1, HSD3B1, PTGES, STS, HPGD, SLCO2A1, HMOX1, ABCG2, ASAH1 and SMPD1). This finding validates the importance of metabolic genes during TE specification. Aghajanova et al. [30] compared the transcriptome of embryo-derived TE cells with that of hESC-derived TE cells and found that most of the shared genes were involved in the development of receptive endometrium during implantation. Suzuki et al. [31] used human embryonic carcinoma cells (G3), which can differentiate into TE cells, as an experimental model to investigate the molecular mechanism of trophoectoderm differentiation. Thus, comparative studies using human TE and hESC or G3 cells are relevant to better understand the molecular basis of cell fate decisions and to develop models of human TE development.
The ‘‘day 3 embryo molecular signature’’ was enriched in genes from the NLRP (named NALP) family which might play a role in early embryo development [32,33]. Indeed, NLRP5, NLRP8 and NLRP9 are expressed in bovine and human pre-implantation embryos [32,34] and, in pregnant NLRP5 null female mice,
Figure 3. Gene Ontology (GO) annotations of the day 3 embryo and TE molecular signatures. We compared the GO annotations of genes specifically over-expressed in day 3 embryos and in TE cells by using the Babelomics web tool (http://babelomics.bioinfo.cipf.es/). Histograms show the percentage of genes with a specific GO annotation in day 3 embryos (white) or in TE samples (black). Only GO categories which differed significantly (p value ,0.01) between the two groups are shown.
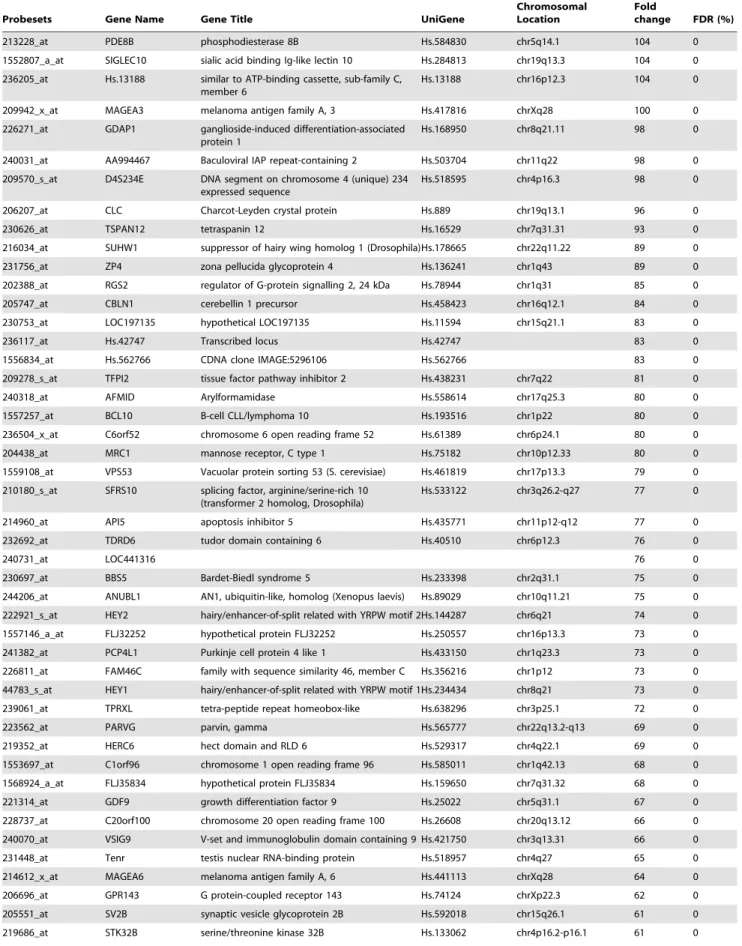
Table 1. List of the 100 genes with the highest fold change in day 3 human embryos in comparison to TE samples.
Probesets Gene Name Gene Title UniGene
Chromosomal Location
Fold
change FDR (%) 1552531_a_at NALP11 NLR family, pyrin domain containing 11 Hs.375039 chr19q13.42 1893 0 242334_at NALP4 NLR family, pyrin domain containing 4 Hs.631533 chr19q13.42 892 0 214957_at ACTL8 actin-like 8 Hs.2149 chr1p36.2-p35 755 0 1556096_s_at UNC13C unc-13 homolog C Hs.443456 chr15q21.3 663 0 207443_at NR2E1 nuclear receptor subfamily 2, group E, member 1Hs.157688 chr6q21 625 0 1553619_a_at TRIM43 tripartite motif-containing 43 Hs.589730 chr2q11.1 519 0 1552405_at NALP5 NLR family, pyrin domain containing 5 Hs.356872 chr19q13.42 448 0 209160_at AKR1C3 aldo-keto reductase family 1, member C3 Hs.78183 chr10p15-p14 431 0 1552456_a_at MBD3L2 methyl-CpG binding domain protein 3-like 2 Hs.567667 chr19p13.2 394 0 1557085_at TMEM122 placenta-specific 1-like Hs.132310 chr11q12.1 387 0 39318_at TCL1A T-cell leukemia/lymphoma 1A Hs.2484 chr14q32.1 342 0 234393_at HDAC9 histone deacetylase 9 Hs.196054 chr7p21.1 315 0 1552912_a_at IL23R interleukin 23 receptor Hs.200929 chr1p31.3 306 0 1552852_a_at ZSCAN4 zinc finger and SCAN domain containing 4 Hs.469663 chr19q13.43 282 0 226117_at TIFA TRAF-interacting protein with a
forkhead-associated domain
Hs.310640 chr4q25 275 0 222361_at LOC643224 similar to tubulin, beta 8 Hs.551805 chr9q34.3 273 0 229105_at GPR39 G protein-coupled receptor 39 Hs.432395 chr2q21-q22 255 0 225626_at PAG1 phosphoprotein associated with
glycosphingolipid microdomains 1
Hs.266175 chr8q21.13 230 0 1557544_at C10orf80 chromosome 10 open reading frame 80 Hs.253576 chr10q25.1 209 0 210634_at KLHL20 kelch-like 20 (Drosophila) Hs.495035 chr1q24.1-q24.3 206 0 206343_s_at NRG1 neuregulin 1 Hs.453951 chr8p21-p12 184 0 207213_s_at USP2 ubiquitin specific peptidase 2 Hs.524085 chr11q23.3 182 0 1563120_at Hs.623820 Homo sapiens, clone IMAGE:5528155, mRNA Hs.630724 175 0 237131_at LOC645469 hypothetical protein FLJ36032 Hs.297967 chr1q21.3 172 0 221630_s_at DDX4 DEAD (Asp-Glu-Ala-Asp) box polypeptide 4 Hs.223581 chr5p15.2-p13.1 171 0 241550_at DPPA5 developmental pluripotency associated 5 Hs.125331 chr6q13 167 0 217365_at PRAMEF5 similar to PRAME family member 6 chr1p36.21 157 0 1570337_at FIGLA folliculogenesis specific basic helix-loop-helix Hs.407636 chr2p13.3 157 0 206140_at LHX2 LIM homeobox 2 Hs.445265 chr9q33-q34.1 154 0 229738_at DNAH10 dynein, axonemal, heavy chain 10 Hs.622654 chr12q24.31 154 0 209785_s_at PLA2G4C phospholipase A2, group IVC (cytosolic,
calcium-independent)
Hs.631562 chr19q13.3 149 0 237613_at FOXR1 forkhead box R1 Hs.116679 chr11q23.3 147 0
236914_at AW080028 137 0
210467_x_at MAGEA12 melanoma antigen family A, 12 chrXq28 137 0 242128_at OTX2 orthodenticle homolog 2 (Drosophila) Hs.288655 chr14q21-q22 128 0 220535_at FAM90A1 family with sequence similarity 90, member A1 Hs.196086 chr12p13.31 128 0 215048_at SUHW2 suppressor of hairy wing homolog 2 (Drosophila)Hs.43834 chr22q11.22 127 0 207934_at RFPL1 ret finger protein-like 1 Hs.648249 chr22q12.2 127 0 209994_s_at ABCB1 ATP-binding cassette, sub-family B (MDR/TAP),
member 1
Hs.489033 chr7q21.1 125 0 207227_x_at RFPL2 ret finger protein-like 2 Hs.157427 chr22q12.3 116 0 238218_at LOC648473 hypothetical protein LOC648473 112 0 214603_at MAGEA2 melanoma antigen family A, 2 Hs.169246 chrXq28 111 0 217590_s_at TRPA1 transient receptor potential cation channel,
subfamily A, member 1
Hs.137674 chr8q13 110 0 208312_s_at PRAMEF1 PRAME family member 1 Hs.104991 chr1p36.21 109 0 223866_at ARMC2 armadillo repeat containing 2 chr6q21 106 0 216001_at LOC390999 PRAME family member 12 Hs.156406 chr1p36.21 106 0
Table 1. Cont.
Probesets Gene Name Gene Title UniGene
Chromosomal Location
Fold
change FDR (%) 213228_at PDE8B phosphodiesterase 8B Hs.584830 chr5q14.1 104 0 1552807_a_at SIGLEC10 sialic acid binding Ig-like lectin 10 Hs.284813 chr19q13.3 104 0 236205_at Hs.13188 similar to ATP-binding cassette, sub-family C,
member 6
Hs.13188 chr16p12.3 104 0 209942_x_at MAGEA3 melanoma antigen family A, 3 Hs.417816 chrXq28 100 0 226271_at GDAP1 ganglioside-induced differentiation-associated
protein 1
Hs.168950 chr8q21.11 98 0 240031_at AA994467 Baculoviral IAP repeat-containing 2 Hs.503704 chr11q22 98 0 209570_s_at D4S234E DNA segment on chromosome 4 (unique) 234
expressed sequence
Hs.518595 chr4p16.3 98 0 206207_at CLC Charcot-Leyden crystal protein Hs.889 chr19q13.1 96 0 230626_at TSPAN12 tetraspanin 12 Hs.16529 chr7q31.31 93 0 216034_at SUHW1 suppressor of hairy wing homolog 1 (Drosophila)Hs.178665 chr22q11.22 89 0 231756_at ZP4 zona pellucida glycoprotein 4 Hs.136241 chr1q43 89 0 202388_at RGS2 regulator of G-protein signalling 2, 24 kDa Hs.78944 chr1q31 85 0 205747_at CBLN1 cerebellin 1 precursor Hs.458423 chr16q12.1 84 0 230753_at LOC197135 hypothetical LOC197135 Hs.11594 chr15q21.1 83 0 236117_at Hs.42747 Transcribed locus Hs.42747 83 0 1556834_at Hs.562766 CDNA clone IMAGE:5296106 Hs.562766 83 0 209278_s_at TFPI2 tissue factor pathway inhibitor 2 Hs.438231 chr7q22 81 0 240318_at AFMID Arylformamidase Hs.558614 chr17q25.3 80 0 1557257_at BCL10 B-cell CLL/lymphoma 10 Hs.193516 chr1p22 80 0 236504_x_at C6orf52 chromosome 6 open reading frame 52 Hs.61389 chr6p24.1 80 0 204438_at MRC1 mannose receptor, C type 1 Hs.75182 chr10p12.33 80 0 1559108_at VPS53 Vacuolar protein sorting 53 (S. cerevisiae) Hs.461819 chr17p13.3 79 0 210180_s_at SFRS10 splicing factor, arginine/serine-rich 10
(transformer 2 homolog, Drosophila)
Hs.533122 chr3q26.2-q27 77 0 214960_at API5 apoptosis inhibitor 5 Hs.435771 chr11p12-q12 77 0 232692_at TDRD6 tudor domain containing 6 Hs.40510 chr6p12.3 76 0
240731_at LOC441316 76 0
230697_at BBS5 Bardet-Biedl syndrome 5 Hs.233398 chr2q31.1 75 0 244206_at ANUBL1 AN1, ubiquitin-like, homolog (Xenopus laevis) Hs.89029 chr10q11.21 75 0 222921_s_at HEY2 hairy/enhancer-of-split related with YRPW motif 2Hs.144287 chr6q21 74 0 1557146_a_at FLJ32252 hypothetical protein FLJ32252 Hs.250557 chr16p13.3 73 0 241382_at PCP4L1 Purkinje cell protein 4 like 1 Hs.433150 chr1q23.3 73 0 226811_at FAM46C family with sequence similarity 46, member C Hs.356216 chr1p12 73 0 44783_s_at HEY1 hairy/enhancer-of-split related with YRPW motif 1Hs.234434 chr8q21 73 0 239061_at TPRXL tetra-peptide repeat homeobox-like Hs.638296 chr3p25.1 72 0 223562_at PARVG parvin, gamma Hs.565777 chr22q13.2-q13 69 0 219352_at HERC6 hect domain and RLD 6 Hs.529317 chr4q22.1 69 0 1553697_at C1orf96 chromosome 1 open reading frame 96 Hs.585011 chr1q42.13 68 0 1568924_a_at FLJ35834 hypothetical protein FLJ35834 Hs.159650 chr7q31.32 68 0 221314_at GDF9 growth differentiation factor 9 Hs.25022 chr5q31.1 67 0 228737_at C20orf100 chromosome 20 open reading frame 100 Hs.26608 chr20q13.12 66 0 240070_at VSIG9 V-set and immunoglobulin domain containing 9 Hs.421750 chr3q13.31 66 0 231448_at Tenr testis nuclear RNA-binding protein Hs.518957 chr4q27 65 0 214612_x_at MAGEA6 melanoma antigen family A, 6 Hs.441113 chrXq28 64 0 206696_at GPR143 G protein-coupled receptor 143 Hs.74124 chrXp22.3 62 0 205551_at SV2B synaptic vesicle glycoprotein 2B Hs.592018 chr15q26.1 61 0 219686_at STK32B serine/threonine kinase 32B Hs.133062 chr4p16.2-p16.1 61 0
embryo development is arrested at the two-cell stage [35]. Remarkably, many genes of the day 3 signature belong to the Melanoma Antigen family and the Ret finger protein-like family. Most of their functions remain largely unknown, but some of them are thought to regulate, respectively, placenta and early embryo development [36,37]. Mouse data suggest that two other day 3 embryo-specific genes (MBD3L2 and ZSCAN4) might regulate early embryo development. In mouse embryos, MBD3L2 expres-sion coincides with EGA [38] and ZSCAN4 (zinc finger and SCAN domain containing 4) is important for the progression from the 2-cell to 4-2-cell stage [39]. ZSCAN4 plays also a key role in defying cellular senescence and maintaining a normal karyotype during propagation of embryonic stem cells in culture [40]. Additionally, the expression levels of DPPA5, DPPA2 and the stemness factor NANOG were much higher in day 3 embryos than in TE samples. The reciprocal pattern of expression of Nanog and the transcription factors Gata6 and Cdx2 in the mouse morula suggests that Nanog might determine ICM pluripotency by repressing Gata6 and Cdx2, which are implicated in the extra-embryonic lineage specification [41].
Our transcriptome analysis also shows that the TE molecular signature includes many genes that are annotated as ‘‘membrane’’, demonstrating a strong bias towards genes involved in cell-to-cell communication processes. Conversely, genes specifically expressed by day 3 embryos are largely ‘‘nuclear’’. Additionally, we categorized the genes that were up-regulated during the MII-day 3 transition according to their molecular and cellular function using the GO annotations and found that they were mainly associated with nuclear localization. This is in line with previously published data showing that proteins produced by the most up-regulated genes during the MII-day 2 embryo transition are mainly localized in the nucleus [11] and that hESC-specific genes are significantly depleted in extracellular signaling components [7]. One assumption that can be inferred from these findings is that the determinants of the MII-embryo transition and pluripo-tency may be regulated by intrinsic factors.
Apoptotic cell death has been observed in human and other mammalian pre-implantation embryos [42]. The expression profile of apoptosis-related genes in day 3 embryos suggests that the balance between anti- (BCL2L10 and BIRC2) and pro-apoptotic factors (BCL2L11 and BIK) might be critical at this stage of development. As the onset of EGA occurs at day 3 post-fertilization in humans, embryos that fail to accurately activate their genome might be committed to death by default. In contrast to mouse blastocysts where apoptosis occurs predominantly in
ICM cells [43], apoptotic nuclei have been detected in both ICM and TE cells in human blastocysts [44]. Accordingly, we show that some molecular actors of apoptosis signaling are up-regulated in human TE cells (i.e. Caspase 6, MCL-1).
The expression of some DNA repair genes has been detected in mammalian embryos at different stages of development [45]. Our data show that two ‘‘DNA damage sensor’’ genes (RFC1 and PCNA1) and two ‘‘base excision repair’’ genes (UNG and UNG2 (now named as CCNO)) are up-regulated in human day 3 embryos, in line with previous works [46], and three ‘‘Double strand break repair’’ genes (BRCA1, XRCC5 and XRCC6) are over-expressed in TE cells. In homozygous Brca15–6mouse mutants, in which exons 5 and 6 of Brca1 were deleted, the development of the extra-embryonic region was abnormal and diploid trophoblast cells were absent [47]. This may indicate that the ‘‘Double strand break repair’’ activity may be important for TE specification.
Epigenetic mechanisms, including DNA methylation, are key elements for controlling gene expression during the embryo-TE transition. In mouse blastocysts, DNA methyltransferase expres-sion is restricted to the ICM, in which nuclei are highly methylated [48], whereas in human and bovine blastocysts, DNA methylation is higher in TE than ICM cells [49]. Here we report a strong expression of DNA (cytosine-5) methyltransferases (DNMT3A, DNMT3B, DNMT1 and DNMT3L) in human TE cells (Figure 5). DNMT3A and DNMT3B are de novo enzymes that establish methylation patterns. DNMT1 is a maintenance enzyme involved in preserving already acquired methylation patterns. DNMT3L lacks a catalytic domain, but can interact with the de novo enzymes [50], stimulating their activity [51]. Comparison with other samples including MII oocytes and hESCs suggests that DNMT3L is specifically up-regulated in TE cells (Figure S4). However, DNA methylation levels have been described to be globally low in extra-embryonic tissues in both mouse and human embryos [52,53]. In these tissues, DNA (cytosine-5) methyltrans-ferases enzymes are expressed only transiently and do not contribute to adult tissues maintenance, thus long-term epigenetic reprogramming may not be critical for extra-embryonic tissues. Moreover, the high expression of different epigenetic regulators in human TE cells could be a consequence of in vitro embryo culture. Studies in animal models have demonstrated that under certain in vitro culture conditions, DNA methylation profiles can be altered [54]. In another hand, the association between in vitro culture conditions during assisted reproduction and increased risk of some epigenetic disorders has been reported, clearly indicating that epigenetic deregulation must be considered when examining in Table 1. Cont.
Probesets Gene Name Gene Title UniGene
Chromosomal Location
Fold
change FDR (%) 230645_at FRMD3 FERM domain containing 3 Hs.127535 chr9q21.32 60 0 1555396_s_at LOC340602 similar to CG32656-PA Hs.97053 chrXp11.22 59 0 237464_at IMAA SLC7A5 pseudogene Hs.448808 chr16p12.2 58 0 212158_at SDC2 syndecan 2 (heparan sulfate proteoglycan 1, cell
surface-associated, fibroglycan)
Hs.1501 chr8q22-q23 57 0 220657_at KLHL11 kelch-like 11 (Drosophila) Hs.592134 chr17q21.2 57 0 223883_s_at STK31 serine/threonine kinase 31 Hs.309767 chr7p15.3 57 0 222925_at DCDC2 doublecortin domain containing 2 Hs.61345 chr6p22.1 56 0 210148_at AF305239 homeodomain interacting protein kinase 3 Hs.201918 chr11p13 56 0 doi:10.1371/journal.pone.0039306.t001
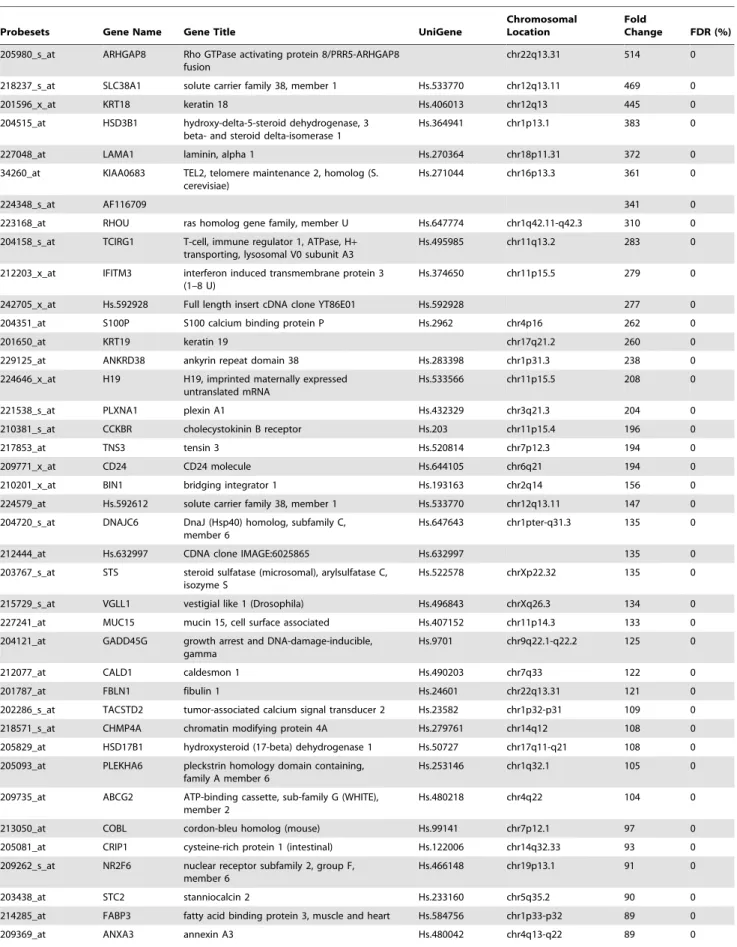
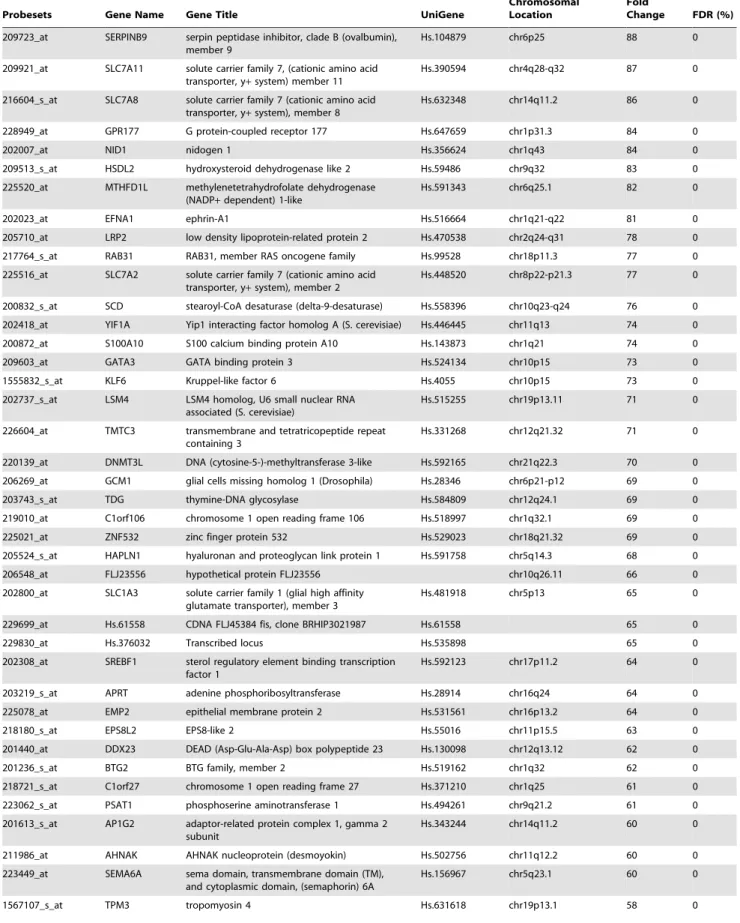
Table 2. List of the 100 genes with the highest fold change in TE samples in comparison to day 3 embryos.
Probesets Gene Name Gene Title UniGene
Chromosomal Location
Fold
Change FDR (%) 205980_s_at ARHGAP8 Rho GTPase activating protein 8/PRR5-ARHGAP8
fusion
chr22q13.31 514 0 218237_s_at SLC38A1 solute carrier family 38, member 1 Hs.533770 chr12q13.11 469 0 201596_x_at KRT18 keratin 18 Hs.406013 chr12q13 445 0 204515_at HSD3B1 hydroxy-delta-5-steroid dehydrogenase, 3
beta- and steroid delta-isomerase 1
Hs.364941 chr1p13.1 383 0 227048_at LAMA1 laminin, alpha 1 Hs.270364 chr18p11.31 372 0 34260_at KIAA0683 TEL2, telomere maintenance 2, homolog (S.
cerevisiae)
Hs.271044 chr16p13.3 361 0
224348_s_at AF116709 341 0
223168_at RHOU ras homolog gene family, member U Hs.647774 chr1q42.11-q42.3 310 0 204158_s_at TCIRG1 T-cell, immune regulator 1, ATPase, H+
transporting, lysosomal V0 subunit A3
Hs.495985 chr11q13.2 283 0 212203_x_at IFITM3 interferon induced transmembrane protein 3
(1–8 U)
Hs.374650 chr11p15.5 279 0 242705_x_at Hs.592928 Full length insert cDNA clone YT86E01 Hs.592928 277 0 204351_at S100P S100 calcium binding protein P Hs.2962 chr4p16 262 0
201650_at KRT19 keratin 19 chr17q21.2 260 0
229125_at ANKRD38 ankyrin repeat domain 38 Hs.283398 chr1p31.3 238 0 224646_x_at H19 H19, imprinted maternally expressed
untranslated mRNA
Hs.533566 chr11p15.5 208 0 221538_s_at PLXNA1 plexin A1 Hs.432329 chr3q21.3 204 0 210381_s_at CCKBR cholecystokinin B receptor Hs.203 chr11p15.4 196 0 217853_at TNS3 tensin 3 Hs.520814 chr7p12.3 194 0 209771_x_at CD24 CD24 molecule Hs.644105 chr6q21 194 0 210201_x_at BIN1 bridging integrator 1 Hs.193163 chr2q14 156 0 224579_at Hs.592612 solute carrier family 38, member 1 Hs.533770 chr12q13.11 147 0 204720_s_at DNAJC6 DnaJ (Hsp40) homolog, subfamily C,
member 6
Hs.647643 chr1pter-q31.3 135 0 212444_at Hs.632997 CDNA clone IMAGE:6025865 Hs.632997 135 0 203767_s_at STS steroid sulfatase (microsomal), arylsulfatase C,
isozyme S
Hs.522578 chrXp22.32 135 0 215729_s_at VGLL1 vestigial like 1 (Drosophila) Hs.496843 chrXq26.3 134 0 227241_at MUC15 mucin 15, cell surface associated Hs.407152 chr11p14.3 133 0 204121_at GADD45G growth arrest and DNA-damage-inducible,
gamma
Hs.9701 chr9q22.1-q22.2 125 0 212077_at CALD1 caldesmon 1 Hs.490203 chr7q33 122 0 201787_at FBLN1 fibulin 1 Hs.24601 chr22q13.31 121 0 202286_s_at TACSTD2 tumor-associated calcium signal transducer 2 Hs.23582 chr1p32-p31 109 0 218571_s_at CHMP4A chromatin modifying protein 4A Hs.279761 chr14q12 108 0 205829_at HSD17B1 hydroxysteroid (17-beta) dehydrogenase 1 Hs.50727 chr17q11-q21 108 0 205093_at PLEKHA6 pleckstrin homology domain containing,
family A member 6
Hs.253146 chr1q32.1 105 0 209735_at ABCG2 ATP-binding cassette, sub-family G (WHITE),
member 2
Hs.480218 chr4q22 104 0 213050_at COBL cordon-bleu homolog (mouse) Hs.99141 chr7p12.1 97 0 205081_at CRIP1 cysteine-rich protein 1 (intestinal) Hs.122006 chr14q32.33 93 0 209262_s_at NR2F6 nuclear receptor subfamily 2, group F,
member 6
Hs.466148 chr19p13.1 91 0 203438_at STC2 stanniocalcin 2 Hs.233160 chr5q35.2 90 0 214285_at FABP3 fatty acid binding protein 3, muscle and heart Hs.584756 chr1p33-p32 89 0 209369_at ANXA3 annexin A3 Hs.480042 chr4q13-q22 89 0
Table 2. Cont.
Probesets Gene Name Gene Title UniGene
Chromosomal Location
Fold
Change FDR (%) 209723_at SERPINB9 serpin peptidase inhibitor, clade B (ovalbumin),
member 9
Hs.104879 chr6p25 88 0 209921_at SLC7A11 solute carrier family 7, (cationic amino acid
transporter, y+ system) member 11
Hs.390594 chr4q28-q32 87 0 216604_s_at SLC7A8 solute carrier family 7 (cationic amino acid
transporter, y+ system), member 8
Hs.632348 chr14q11.2 86 0 228949_at GPR177 G protein-coupled receptor 177 Hs.647659 chr1p31.3 84 0 202007_at NID1 nidogen 1 Hs.356624 chr1q43 84 0 209513_s_at HSDL2 hydroxysteroid dehydrogenase like 2 Hs.59486 chr9q32 83 0 225520_at MTHFD1L methylenetetrahydrofolate dehydrogenase
(NADP+ dependent) 1-like
Hs.591343 chr6q25.1 82 0 202023_at EFNA1 ephrin-A1 Hs.516664 chr1q21-q22 81 0 205710_at LRP2 low density lipoprotein-related protein 2 Hs.470538 chr2q24-q31 78 0 217764_s_at RAB31 RAB31, member RAS oncogene family Hs.99528 chr18p11.3 77 0 225516_at SLC7A2 solute carrier family 7 (cationic amino acid
transporter, y+ system), member 2
Hs.448520 chr8p22-p21.3 77 0 200832_s_at SCD stearoyl-CoA desaturase (delta-9-desaturase) Hs.558396 chr10q23-q24 76 0 202418_at YIF1A Yip1 interacting factor homolog A (S. cerevisiae) Hs.446445 chr11q13 74 0 200872_at S100A10 S100 calcium binding protein A10 Hs.143873 chr1q21 74 0 209603_at GATA3 GATA binding protein 3 Hs.524134 chr10p15 73 0 1555832_s_at KLF6 Kruppel-like factor 6 Hs.4055 chr10p15 73 0 202737_s_at LSM4 LSM4 homolog, U6 small nuclear RNA
associated (S. cerevisiae)
Hs.515255 chr19p13.11 71 0 226604_at TMTC3 transmembrane and tetratricopeptide repeat
containing 3
Hs.331268 chr12q21.32 71 0 220139_at DNMT3L DNA (cytosine-5-)-methyltransferase 3-like Hs.592165 chr21q22.3 70 0 206269_at GCM1 glial cells missing homolog 1 (Drosophila) Hs.28346 chr6p21-p12 69 0 203743_s_at TDG thymine-DNA glycosylase Hs.584809 chr12q24.1 69 0 219010_at C1orf106 chromosome 1 open reading frame 106 Hs.518997 chr1q32.1 69 0 225021_at ZNF532 zinc finger protein 532 Hs.529023 chr18q21.32 69 0 205524_s_at HAPLN1 hyaluronan and proteoglycan link protein 1 Hs.591758 chr5q14.3 68 0 206548_at FLJ23556 hypothetical protein FLJ23556 chr10q26.11 66 0 202800_at SLC1A3 solute carrier family 1 (glial high affinity
glutamate transporter), member 3
Hs.481918 chr5p13 65 0 229699_at Hs.61558 CDNA FLJ45384 fis, clone BRHIP3021987 Hs.61558 65 0 229830_at Hs.376032 Transcribed locus Hs.535898 65 0 202308_at SREBF1 sterol regulatory element binding transcription
factor 1
Hs.592123 chr17p11.2 64 0 203219_s_at APRT adenine phosphoribosyltransferase Hs.28914 chr16q24 64 0 225078_at EMP2 epithelial membrane protein 2 Hs.531561 chr16p13.2 64 0 218180_s_at EPS8L2 EPS8-like 2 Hs.55016 chr11p15.5 63 0 201440_at DDX23 DEAD (Asp-Glu-Ala-Asp) box polypeptide 23 Hs.130098 chr12q13.12 62 0 201236_s_at BTG2 BTG family, member 2 Hs.519162 chr1q32 62 0 218721_s_at C1orf27 chromosome 1 open reading frame 27 Hs.371210 chr1q25 61 0 223062_s_at PSAT1 phosphoserine aminotransferase 1 Hs.494261 chr9q21.2 61 0 201613_s_at AP1G2 adaptor-related protein complex 1, gamma 2
subunit
Hs.343244 chr14q11.2 60 0 211986_at AHNAK AHNAK nucleoprotein (desmoyokin) Hs.502756 chr11q12.2 60 0 223449_at SEMA6A sema domain, transmembrane domain (TM),
and cytoplasmic domain, (semaphorin) 6A
Hs.156967 chr5q23.1 60 0 1567107_s_at TPM3 tropomyosin 4 Hs.631618 chr19p13.1 58 0
vitro fertilized embryos. Our findings suggest that epigenetic modifiers cooperate with transcription factors and DNA repair genes to regulate the whole gene expression profile in TE cells (Figure 5). Disruption of this epigenetic regulatory circuit might lead to alterations of the normal physiological functions. There-fore, a comprehensive elucidation of this regulatory network would be highly beneficial for understanding TE anomalies and for improving assisted reproduction procedures. Moreover, a better knowledge on the TE-specific genes and the transcriptional networks operative in TE cells and day 3 embryos might led to the identification of new biomarkers that might be used as diagnostic tools to monitor the health, viability and competence of embryos in assisted reproduction programs.
Limitations
As the day 3 embryos and the day 5 embryos used to isolate TE cells were donated from infertile women who underwent IVF treatments, the gene expression profiles could be have been influenced by the controlled ovarian stimulation (COS) carried out during IVF and thus they might not completely reflect the physiological situation under natural cycles. Moreover, due to the bioethics law that regulates the research on human embryos in France, the number of embryos donated for research is smaller. In view of these limitations, we optimized our technique to obtain transcriptome data for each single embryo and trophectoderm sample, respectively.
Materials and Methods
Specimen Collection and Processing
Human day 3 (post-fertilization) embryos and day 5 blastocysts were donated for research by infertile couples undergoing IVF treatment. All patients signed informed consent forms and the protocol for collecting human embryos and TE was approved by the Ethical Committee of the French National Agency of Biomedicine.
Day 3 embryos. 9 embryos from 6 different couples were used for microarray analyses (n = 6) and qRT-PCR validation (n = 3). Day 3 embryos were all 6–8 cells with ,20% fragmen-tation. Each embryo was individually transferred in a tube containing extraction buffer and frozen at 280uC for subsequent RNA extraction.
Trophectoderm biopsy. 8 day 5 blastocysts were used for TE isolation for microarray analyses (n = 5) and qRT–PCR validation (n = 3). Blastocysts were fully expanded with a well-defined ICM and TE was scored according to Gardner [55]. After removal of the zona pellucida, TE was mechanically dissected from ICM. All TE samples were immediately transferred in tubes containing RLT lysis buffer and frozen at 280uC.
Mature MII oocytes and hESCs. After informed consent, unfertilized MII oocytes were collected 24 or 48 hours post-insemination as previously described [56]. Briefly, three pools of 16 MII oocytes (6 patients), 21 MII oocytes (8 patients) and 24 MII Table 2. Cont.
Probesets Gene Name Gene Title UniGene
Chromosomal Location
Fold
Change FDR (%) 208659_at CLIC1 chloride intracellular channel 1 Hs.414565 chr6p22.1-p21.2 57 0 202546_at VAMP8 vesicle-associated membrane protein 8
(endobrevin)
Hs.534373 chr2p12-p11.2 57 0 227042_at LOC150223 hypothetical protein LOC150223 Hs.355952 chr22q11.21 57 0 202625_at LYN v-yes-1 Yamaguchi sarcoma viral related
oncogene homolog
Hs.651186 chr8q13 56 0
235436_at BE503800 55 0
223839_s_at Hs.597496 PRO1933 Hs.597496 55 0
202830_s_at SLC37A4 solute carrier family 37 (glycerol-6-phosphate transporter), member 4
Hs.132760 chr11q23.3 54 0 228834_at TOB1 transducer of ERBB2, 1 Hs.649528 chr17q21 54 0 210589_s_at GBA glucosidase, beta; acid (includes
glucosylceramidase)
Hs.282997 chr1q21 53 0 208683_at CAPN2 calpain 2, (m/II) large subunit Hs.350899 chr1q41-q42 53 0 201428_at CLDN4 claudin 4 Hs.647036 chr7q11.23 52 0 217775_s_at RDH11 retinol dehydrogenase 11 (all-trans/9-cis/11-cis) Hs.226007 chr14q24.1 51 0 208613_s_at FLNB filamin B, beta (actin binding protein 278) Hs.476448 chr3p14.3 49 0
230204_at AU144114 49 0
209710_at GATA2 GATA binding protein 2 Hs.367725 chr3q21.3 48 0 215464_s_at TAX1BP3 Tax1 (human T-cell leukemia virus type I) binding
protein 3
Hs.12956 chr17p13 47 0 1559266_s_at FLJ45187 hypothetical protein LOC387640 Hs.350848 chr10p12.31 47 0 202090_s_at UQCR ubiquinol-cytochrome c reductase, 6.4 kDa
subunit
Hs.534521 chr19p13.3 47 0 209652_s_at PGF placental growth factor, vascular endothelial
growth factor-related protein
Hs.252820 chr14q24-q31 47 0 232164_s_at EPPK1 epiplakin 1 Hs.200412 chr8q24.3 47 0 doi:10.1371/journal.pone.0039306.t002
oocytes (8 patients) provided from couples referred to our center for conventional IVF for tubal infertility or for ICSI for male infertility were used for microarray analyses and qRT-PCR validation. The three hESC lines (HD83, HD90 and HD129) were derived by our group. Briefly, derivation of these lines was carried out using mechanical extraction of the inner cell mass [57]. The culture medium used for hESC derivation and culture consisted of 80% KO-DMEM, 20% Knockout serum replacement (KO-SR), 0.1 mM non-essential amino acids, 2 mM L-Glutamine, 0.5 mM b-mercaptoethanol and 10 ng/mL of bFGF. Passaging was performed mechanically by cutting the colony using a #15 scalpel under microscope. Mitotically inactivated (by irradiation) human foreskin fibroblasts (HFF) were used as feeder cells. HFFs were cultured in 85% DMEM, 15% FBS. HD83, HD90 and HD129 hESC lines were used for microarray analyses and HD90, HD129 and HS181 (imported from the Karolinska Institute (Stockholm, Sweden)) hESC lines were used for qRT–PCR validation.
RNA extraction. The RNeasy Micro kit (Qiagen) was used to isolate total RNA from TE samples and the Picopure RNA isolation kit (Arcturus Reagents/Molecular Devices, KIT0204, USA) for day 3 embryos, according to the manufacturers’ recommended protocols. The quantity and purity of the total RNAs were determined by using a NanoDropH ND-1000 spectrophotometer (NanoDrop ND-Thermo Fisher Scientific, Wilmington, DE, USA) and their integrity by using the Agilent 2100 Bioanalyzer (Agilent Technologies, Palo Alto, CA, http:// www.agilent.com).
Complementary RNA (cRNA) Preparation and Microarray Processing
Total day 3 embryo RNA samples (from 450 pg to 855 pg) were subjected to three rounds of linear amplification and total TE RNA samples (between 50 and 100 ng) were twice amplified to
Figure 4. Differential expression of apoptosis and stemness-related genes in day 3 embryos and TE samples. (A) Histograms show the microarray signal values for apoptosis-related genes in day 3 embryos (black) and TE samples (white). (B) The mean expression level of 48 stemness genes in six day 3 embryos and five TE samples was plotted on a logarithmic scale in a radar graph. Asterisks indicate a statistically significant difference (P,0.05) between TE and day 3 embryos (Mann-Whitney test).
doi:10.1371/journal.pone.0039306.g004
Figure 5. Up-regulated genes that are related to theNANOGpathway, or to metabolic and epigenetic functions in day 3 human embryos and TE samples. (A) The interaction network was generated with the Ingenuity software and shows that many genes from the NANOG pathway are up-regulated (red) in day 3 embryos. (B) Top-ranked functional networks in which are involved transcription factors (GATA2 and GATA3), or genes that regulate steroidogenesis (including HSD1B3), DNA repair (TDG and BRCA1) or epigenetic modifications (including DNMT3L) and that are up-regulated in TE samples. The color intensity indicates their degree of up-regulation. Uncolored genes were identified as not differentially expressed by our analysis, but were, nevertheless, integrated into the computationally generated networks on the basis of the evidence stored in the IPA knowledge memory indicating a relevance to this network. In each network, nodes indicate genes, a plain line indicates direct interaction, a dashed line indicates indirect interaction; a line without arrowhead indicates binding only; a line with an arrowhead indicates ‘‘acts on’’. doi:10.1371/journal.pone.0039306.g005
generate suitable quantity of labeled cRNA for hybridization to HG-U133 plus 2.0 GeneChip arrays (Affymetrix, Santa Clara, CA, USA) as described in [9] and following the standard Affymetrix instructions. Briefly, RNA was amplified from individ-ual human embryos using the RiboAmpH HS Kit according to manufacturer’s instructions (Arcturus Bioscience). During the first strand synthesis reaction, cDNA that incorporates a T7 promoter sequence is produced. This cDNA was then used as a template for the in vitro-transcription reaction driven by the T7 promoter to synthesize antisense RNA (aRNA), which was used as input for the second round of amplification. cRNA was then transcribed into cDNA and the T7 promoter was used to drive the second round of in vitro transcription. The double-stranded cDNA was then subjected to three rounds of linear amplification. The amplified aRNA was labeled with biotin using the Turbo Labeling Kit (Arctutus) and fragmented. Finally, fifteen micrograms of each labeled sample were hybridized to the HG-U133plus2 GeneChip array (Affymetrix). The microarray data were obtained in agreement with the Minimal Information about Microarray Experiment (MIAME) recommendations [58]. All data are accessible at the US National Center for Biotechnology Informa-tion, Gene Expression Omnibus (GEO) repository http://www. ncbi.nlm.nih.gov/geo through the provisional accession series number GSE33025.
Data Processing and Visualization
After image processing using the Affymetrix Microarray Suite 5.0, the cell files were analyzed using the Affymetrix Expression Console software and normalized with the MAS5 algorithm by scaling each array to a target value of 100 using the global scaling method to obtain an intensity value signal for each probe set. Gene annotation was performed using NetAffx (http://www.affymetrix. com; March 2009). Genes with significant differential expression profiles were identified using the two-class Significance Analysis of Microarray (SAM) algorithm (http://www-stat.stanford.edu/ ,tibs/SAM/) with the Wilcoxon test and sample label permuta-tion (n = 300). Briefly, the algorithm assigns a score to each gene based on differences in expression between conditions relative to the standard deviation of repeated measurements. The false discovery rate (FDR) is determined using permutations of the repeated measurements to estimate the percentage of genes identified by chance. The algorithm was applied to each dataset separately using FDR,1%. Subsequently, only the genes marked as significantly up-regulated or down-regulated were considered as differentially expressed in TE or embryos compared with the other samples. For hierarchical clustering, data were log-transformed, median-centered and processed with the CLUSTER and TREE-VIEW software packages [59]. To cluster the samples according to the similarity of their gene expression patterns, we performed an unsupervised principal component analysis (PCA) with the RAGE bioinformatics platform [http://rage.montp.inserm.fr/] to project samples onto three-dimensional spaces that were further visualized to see the constellation of all samples using all the detected genes. The expression of selected genes in the panel of samples that includes germinal, stem cells and adult tissues, were retrieved through our ‘‘Amazonia!’’ database (http://amazonia.montp. inserm.fr/). The Ingenuity Pathways Analysis (IPA) system (Ingenuity Systems, Redwood City, CA, USA) was used to identify networks related to the genes that were differentially expressed in day 3 embryos and TE samples.
Gene Ontologies (GO) Classification
Gene Ontology (GO) annotation analysis was carried out using the Fatigo+ tool http://babelomics.bioinfo.cipf.es [60] to identify
biologically relevant themes among the genes that were differen-tially expressed in day 3 embryos and TE cells. Briefly, Fatigo+ performs a functional enrichment analysis by comparing two lists of genes by means of the Fisher’s Exact Test. Gene modules used in the test are defined in different ways that include functional criteria (GO, KEGG, Biocarta, etc.). Also user-defined gene modules can be imported and used for functional enrichment.
Validation of Microarray Data by Quantitative RT–PCR Amplification
Gene expression profiles derived from microarray analyses were confirmed quantitatively by real-time qRT-PCR analysis using RNAs from three TE samples, three day 3 embryos, three MII oocytes and three hESC samples. The primer sequences are shown in Table S3. Briefly, cDNA was reverse transcribed following the manufacturer’s instructions using 500 ng of total RNA in a 20ml reaction that contained Superscript II (Invitrogen), oligo dT primer, dNTP mixture, MgCl2 and RNase inhibitor. Aliquots of cDNA (1/25 of the RT reaction) were diluted in 50ml reaction volume. Q-PCR was performed using a LightCycler 480 apparatus with the LC480 SYBR Green I Master kit (Roche Diagnostics, Mannheim, Germany) containing 2ml cDNA and 0.6 mMol primers in a total volume of 10ml. After 10 min of activation at 95uC, cycling conditions were 10 s at 95uC, 30 s at 63uC and 1 s at 72uC for 50 cycles. Gene expression levels were normalized to GAPDH using the following formula 100/2DDCt where DDCt = DCt unknown - DCt positive control. Statistical comparisons were carried out using the Student’s t test and the SPSS software. P values less than or equal to 0.05 were considered significant.
Supporting Information
Figure S1 Scatter plots showing the comparative distri-bution of transcripts in mature MII oocytes, day 3 embryos, TE and hESC samples. Each sample was plotted against all the other samples to visualize expression variations. The blue areas highlight a greater than two-fold gene expression difference (up-regulated) between the X-axis and Y-axis samples. The orange areas indicate a greater than two-fold gene expression difference (down-regulated) between the X-axis and Y-axis samples. The yellow areas highlight a 0.5- to 2-fold gene expression difference between the X-axis and Y-axis samples. For each couple of samples, the Pearson’s correlation coefficient was computed (r).
(TIF)
Figure S2 Quantitative RT–PCR validation of the mi-croarray results: All qRT–PCR results were normalized to the expression of GAPDH in each sample and are the mean 6 SEM of individual day 3 embryos (n = 3), TE (n = 3), pooled MII oocyte (n = 3) and hESC (n = 3) samples analyzed in duplicate. *P,0.05 was considered significant
(TIF)
Figure S3 IPA results showing the network of DNA repair genes that are up-regulated in TE samples from day 5 human blastocysts and day 3 embryos.
(TIF)
Figure S4 Venn diagram representing the number of genes in each comparison and the overlaps between the three main comparison groups. The day 3 embryo/MII oocyte/hESC signatures were defined as the intersection of the day 3 embryo signature (genes over-expressed in day3 embryos compared with TE samples; 1714 genes), the MII oocytes
signature (genes over-expressed in MII oocytes compared with TE cells; 4444 genes ) and the hESC signature (genes up-regulated in hESC compared to TE samples, 5502 genes). The TE/MII oocyte/hESC signature were defined as the intersection of the TE signature (genes over-expressed in TE compared with day 3 embryos; 2196 genes), the MII oocyte signature (genes over-expressed in MII oocytes compared with day 3 embryos; 3198 genes ) and the hESC signature (genes over-expressed in hESCs compared with day 3 embryos; 8584 genes). The comparison between categories were generated by using the SAM software with a fold change $2 and FDR ,1%.
(TIF)
Figure S5 Expression of selected genes, which were up-regulated either in TE cells (HSD3B1, HSD17B1, FDX1, PTGS and DNMT3L) or day 3 embryos (NANOG, MBD3L2, ZSCAN4, RFPL2 and DPPA2), and of beta-Actin in the panel of samples that includes MII oocytes and hESCs using the Amazonia! gene atlas explorer (http:// www.amazonia.transcriptome.eu). Abbreviations: hESC, human embryonic stem cell; hiPS, human induced pluripotent stem cells; TE, Trophectoderm; hFF, human foreskin fibroblasts; CNS, central nervous system; DT, digestive tract; H & L, Heart and muscle; HEMATO, various hematopoietic tissues; End, Endometrium; PL, placenta.
(TIF)
Table S1 List of the 1,714 transcripts specific to the day 3 embryo molecular signature.
(XLS)
Table S2 List of the 2,196 transcripts specific to the TE molecular signature.
(XLS)
Table S3 Primer pairs used for validating the array data by qRT-PCR.
(DOC)
Table S4 List of the transcripts included in the signatures analyzed in this manuscript. (a) Day 3 embryo/MII oocyte signature, (b) Day 3 embryo/hESC signature, (c) TE/MII oocyte signature, (d) TE/hESC signature, (e) specific day 3 embryo signature and (f) specific TE signature.
(XLS)
Table S5 List of the 104 genes that were up-regulated both in TE cells obtained by hESCs differentiation in the presence of BMP4 for 10 days (transcriptome analysis by Marchand et al, [29]) and in TE cells isolated from day 5 embryos (this study). (XLS)
Acknowledgments
We thank the direction of the University-Hospital of Montpellier and the ART/PGD teams for their support and Dr. Robert Feil for insightful discussions and critical review of the manuscript. We thank Genevrier and Ferring Pharmaceutical Companies for their support.
Author Contributions
Conceived and designed the experiments: SA SH. Performed the experiments: SA IB. Analyzed the data: SA. Contributed reagents/ materials/analysis tools: SA IB DH CM HD IJK SH. Wrote the paper: SA SH. Final approval: SH.
References
1. Dobson AT, Raja R, Abeyta MJ, Taylor T, Shen S, et al. (2004) The unique transcriptome through day 3 of human preimplantation development. Hum Mol Genet 13: 1461–1470.
2. Niakan KK, Han J, Pedersen RA, Simon C, Pera RA (2012) Human pre-implantation embryo development. Development 139: 829–841.
3. Galan A, Montaner D, Poo ME, Valbuena D, Ruiz V, et al. (2010) Functional genomics of 5- to 8-cell stage human embryos by blastomere single-cell cDNA analysis. PLoS One 5: e13615.
4. Home P, Ray S, Dutta D, Bronshteyn I, Larson M, et al. (2009) GATA3 is selectively expressed in the trophectoderm of peri-implantation embryo and directly regulates Cdx2 gene expression. J Biol Chem 284: 28729–28737. 5. Jones GM, Cram DS, Song B, Kokkali G, Pantos K, et al. (2008) Novel strategy
with potential to identify developmentally competent IVF blastocysts. Hum Reprod 23: 1748–1759.
6. Shalon D, Smith SJ, Brown PO (1996) A DNA microarray system for analyzing complex DNA samples using two-color fluorescent probe hybridization. Genome Res 6: 639–645.
7. Assou S, Le Carrour T, Tondeur S, Strom S, Gabelle A, et al. (2007) A meta-analysis of human embryonic stem cells transcriptome integrated into a web-based expression atlas. Stem Cells 25: 961–973.
8. Assou S, Boumela I, Haouzi D, Anahory T, Dechaud H, et al. (2011) Dynamic changes in gene expression during human early embryo development: from fundamental aspects to clinical applications. Hum Reprod Update 17: 272–290. 9. Assou S, Cerecedo D, Tondeur S, Pantesco V, Hovatta O, et al. (2009) A gene expression signature shared by human mature oocytes and embryonic stem cells. BMC Genomics 10: 10.
10. Hamatani T, Carter MG, Sharov AA, Ko MS (2004) Dynamics of global gene expression changes during mouse preimplantation development. Dev Cell 6: 117–131.
11. Zhang P, Zucchelli M, Bruce S, Hambiliki F, Stavreus-Evers A, et al. (2009) Transcriptome profiling of human pre-implantation development. PLoS One 4: e7844.
12. Irizarry RA, Warren D, Spencer F, Kim IF, Biswal S, et al. (2005) Multiple-laboratory comparison of microarray platforms. Nat Methods 2: 345–350. 13. Wang QT, Piotrowska K, Ciemerych MA, Milenkovic L, Scott MP, et al. (2004)
A genome-wide study of gene activity reveals developmental signaling pathways in the preimplantation mouse embryo. Dev Cell 6: 133–144.
14. Wood RD, Mitchell M, Lindahl T (2005) Human DNA repair genes, 2005. Mutat Res 577: 275–283.
15. Boyer LA, Lee TI, Cole MF, Johnstone SE, Levine SS, et al. (2005) Core transcriptional regulatory circuitry in human embryonic stem cells. Cell 122: 947–956.
16. Darr H, Benvenisty N (2006) Factors involved in self-renewal and pluripotency of embryonic stem cells. Handb Exp Pharmacol: 1–19.
17. Wu Z, Zhang W, Chen G, Cheng L, Liao J, et al. (2008) Combinatorial signals of activin/nodal and bone morphogenic protein regulate the early lineage segregation of human embryonic stem cells. J Biol Chem 283: 24991–25002. 18. Bai Q, Assou S, Haouzi D, Ramirez JM, Monzo C, et al. (2011) Dissecting the
First Transcriptional Divergence During Human Embryonic Development. Stem Cell Rev.
19. Xu RH, Chen X, Li DS, Li R, Addicks GC, et al. (2002) BMP4 initiates human embryonic stem cell differentiation to trophoblast. Nat Biotechnol 20: 1261– 1264.
20. Yagi R, Kohn MJ, Karavanova I, Kaneko KJ, Vullhorst D, et al. (2007) Transcription factor TEAD4 specifies the trophectoderm lineage at the beginning of mammalian development. Development 134: 3827–3836. 21. Cheng YH, Aronow BJ, Hossain S, Trapnell B, Kong S, et al. (2004) Critical
role for transcription factor AP-2alpha in human trophoblast differentiation. Physiol Genomics 18: 99–107.
22. Adjaye J, Huntriss J, Herwig R, BenKahla A, Brink TC, et al. (2005) Primary differentiation in the human blastocyst: comparative molecular portraits of inner cell mass and trophectoderm cells. Stem Cells 23: 1514–1525.
23. Daulhac L, Kowalski-Chauvel A, Pradayrol L, Vaysse N, Seva C (1999) Src-family tyrosine kinases in activation of ERK-1 and p85/p110-phosphatidylino-sitol 3-kinase by G/CCKB receptors. J Biol Chem 274: 20657–20663. 24. Todisco A, Takeuchi Y, Urumov A, Yamada J, Stepan VM, et al. (1997)
Molecular mechanisms for the growth factor action of gastrin. Am J Physiol 273: G891–898.
25. Cayrol C, Clerc P, Bertrand C, Gigoux V, Portolan G, et al. (2006) Cholecystokinin-2 receptor modulates cell adhesion through beta 1-integrin in human pancreatic cancer cells. Oncogene 25: 4421–4428.
26. Peng L, Payne AH (2002) AP-2 gamma and the homeodomain protein distal-less 3 are required for placental-specific expression of the murine 3 beta-hydroxysteroid dehydrogenase VI gene, Hsd3b6. J Biol Chem 277: 7945–7954. 27. Aghajanova L, Hamilton A, Kwintkiewicz J, Vo KC, Giudice LC (2009) Steroidogenic enzyme and key decidualization marker dysregulation in endometrial stromal cells from women with versus without endometriosis. Biol Reprod 80: 105–114.
28. Kayes-Wandover KM, White PC (2000) Steroidogenic enzyme gene expression in the human heart. J Clin Endocrinol Metab 85: 2519–2525.
29. Marchand M, Horcajadas JA, Esteban FJ, McElroy SL, Fisher SJ, et al. (2011) Transcriptomic signature of trophoblast differentiation in a human embryonic stem cell model. Biol Reprod 84: 1258–1271.
30. Aghajanova L, Shen S, Rojas AM, Fisher SJ, Irwin JC, et al. (2011) Comparative Transcriptome Analysis of Human Trophectoderm and Embryonic Stem Cell-Derived Trophoblasts Reveal Key Participants in Early Implantation. Biol Reprod.
31. Suzuki N, Yamada T, Matsuoka K, Hiraoka N, Iwamaru Y, et al. (1999) Functional expressions of fms and M-CSF during trophoectodermal differen-tiation of human embryonal carcinoma cells. Placenta 20: 203–211. 32. Zhang P, Dixon M, Zucchelli M, Hambiliki F, Levkov L, et al. (2008) Expression
analysis of the NLRP gene family suggests a role in human preimplantation development. PLoS One 3: e2755.
33. Hamatani T, Falco G, Carter MG, Akutsu H, Stagg CA, et al. (2004) Age-associated alteration of gene expression patterns in mouse oocytes. Hum Mol Genet 13: 2263–2278.
34. Ponsuksili S, Brunner RM, Goldammer T, Kuhn C, Walz C, et al. (2006) Bovine NALP5, NALP8, and NALP9 genes: assignment to a QTL region and the expression in adult tissues, oocytes, and preimplantation embryos. Biol Reprod 74: 577–584.
35. Tong ZB, Gold L, Pfeifer KE, Dorward H, Lee E, et al. (2000) Mater, a maternal effect gene required for early embryonic development in mice. Nat Genet 26: 267–268.
36. Jungbluth AA, Silva WA, Jr., Iversen K, Frosina D, Zaidi B, et al. (2007) Expression of cancer-testis (CT) antigens in placenta. Cancer Immun 7: 15. 37. Suzumori N, Burns KH, Yan W, Matzuk MM (2003) RFPL4 interacts with
oocyte proteins of the ubiquitin-proteasome degradation pathway. Proc Natl Acad Sci U S A 100: 550–555.
38. Telford NA, Watson AJ, Schultz GA (1990) Transition from maternal to embryonic control in early mammalian development: a comparison of several species. Mol Reprod Dev 26: 90–100.
39. Falco G, Lee SL, Stanghellini I, Bassey UC, Hamatani T, et al. (2007) Zscan4: a novel gene expressed exclusively in late 2-cell embryos and embryonic stem cells. Dev Biol 307: 539–550.
40. Zalzman M, Falco G, Sharova LV, Nishiyama A, Thomas M, et al. (2010) Zscan4 regulates telomere elongation and genomic stability in ES cells. Nature 464: 858–863.
41. Rossant J (2004) Lineage development and polar asymmetries in the peri-implantation mouse blastocyst. Semin Cell Dev Biol 15: 573–581.
42. Boumela I, Assou S, Aouacheria A, Haouzi D, Dechaud H, et al. (2011) Involvement of BCL2 family members in the regulation of human oocyte and early embryo survival and death: gene expression and beyond. Reproduction 141: 549–561.
43. Handyside AH, Hunter S (1984) A rapid procedure for visualising the inner cell mass and trophectoderm nuclei of mouse blastocysts in situ using polynucleotide-specific fluorochromes. J Exp Zool 231: 429–434.
44. Hardy K, Handyside AH, Winston RM (1989) The human blastocyst: cell number, death and allocation during late preimplantation development in vitro. Development 107: 597–604.
45. Jaroudi S, SenGupta S (2007) DNA repair in mammalian embryos. Mutat Res 635: 53–77.
46. Jaroudi S, Kakourou G, Cawood S, Doshi A, Ranieri DM, et al. (2009) Expression profiling of DNA repair genes in human oocytes and blastocysts using microarrays. Hum Reprod 24: 2649–2655.
47. Hakem R, de la Pompa JL, Sirard C, Mo R, Woo M, et al. (1996) The tumor suppressor gene Brca1 is required for embryonic cellular proliferation in the mouse. Cell 85: 1009–1023.
48. Watanabe D, Suetake I, Tada T, Tajima S (2002) Stage- and cell-specific expression of Dnmt3a and Dnmt3b during embryogenesis. Mech Dev 118: 187– 190.
49. Fulka H, Mrazek M, Tepla O, Fulka J, Jr. (2004) DNA methylation pattern in human zygotes and developing embryos. Reproduction 128: 703–708. 50. Ooi SK, Qiu C, Bernstein E, Li K, Jia D, et al. (2007) DNMT3L connects
unmethylated lysine 4 of histone H3 to de novo methylation of DNA. Nature 448: 714–717.
51. Suetake I, Shinozaki F, Miyagawa J, Takeshima H, Tajima S (2004) DNMT3L stimulates the DNA methylation activity of Dnmt3a and Dnmt3b through a direct interaction. J Biol Chem 279: 27816–27823.
52. Kokalj-Vokac N, Zagorac A, Pristovnik M, Bourgeois CA, Dutrillaux B (1998) DNA methylation of the extraembryonic tissues: an in situ study on human metaphase chromosomes. Chromosome Res 6: 161–166.
53. Chapman V, Forrester L, Sanford J, Hastie N, Rossant J (1984) Cell lineage-specific undermethylation of mouse repetitive DNA. Nature 307: 284–286. 54. Mann MR, Lee SS, Doherty AS, Verona RI, Nolen LD, et al. (2004) Selective
loss of imprinting in the placenta following preimplantation development in culture. Development 131: 3727–3735.
55. Gardner DK, Schoolcraft WB, Wagley L, Schlenker T, Stevens J, et al. (1998) A prospective randomized trial of blastocyst culture and transfer in in-vitro fertilization. Hum Reprod 13: 3434–3440.
56. Assou S, Anahory T, Pantesco V, Le Carrour T, Pellestor F, et al. (2006) The human cumulus–oocyte complex gene-expression profile. Hum Reprod 21: 1705–1719.
57. Strom S, Inzunza J, Grinnemo KH, Holmberg K, Matilainen E, et al. (2007) Mechanical isolation of the inner cell mass is effective in derivation of new human embryonic stem cell lines. Hum Reprod 22: 3051–3058.
58. Brazma A, Hingamp P, Quackenbush J, Sherlock G, Spellman P, et al. (2001) Minimum information about a microarray experiment (MIAME)-toward standards for microarray data. Nat Genet 29: 365–371.
59. Eisen MB, Spellman PT, Brown PO, Botstein D (1998) Cluster analysis and display of genome-wide expression patterns. Proc Natl Acad Sci U S A 95: 14863–14868.
60. Al-Shahrour F, Minguez P, Vaquerizas JM, Conde L, Dopazo J (2005) BABELOMICS: a suite of web tools for functional annotation and analysis of groups of genes in high-throughput experiments. Nucleic Acids Res 33: W460– 464.