HAL Id: inserm-00542902
https://www.hal.inserm.fr/inserm-00542902
Submitted on 3 Dec 2010HAL is a multi-disciplinary open access archive for the deposit and dissemination of sci-entific research documents, whether they are pub-lished or not. The documents may come from teaching and research institutions in France or abroad, or from public or private research centers.
L’archive ouverte pluridisciplinaire HAL, est destinée au dépôt et à la diffusion de documents scientifiques de niveau recherche, publiés ou non, émanant des établissements d’enseignement et de recherche français ou étrangers, des laboratoires publics ou privés.
MR-guided adaptive focusing of ultrasound.
Benoît Larrat, Mathieu Pernot, Gabriel Montaldo, Mathias Fink, Mickaël
Tanter
To cite this version:
Benoît Larrat, Mathieu Pernot, Gabriel Montaldo, Mathias Fink, Mickaël Tanter. MR-guided adaptive focusing of ultrasound.. IEEE Transactions on Ultrasonics, Ferroelectrics and Frequency Control, Institute of Electrical and Electronics Engineers, 2010, 57 (8), pp.1734-7. �inserm-00542902�
MR-Guided Adaptive Focusing of Ultrasound
B. Larrat, M. Pernot, G. Montaldo, M. Fink, M. Tanter
Institut Langevin, ESPCI ParisTech, CNRS UMR 7587, INSERM U979, Université Paris VII Laboratoire Ondes et Acoustique, 10 rue Vauquelin, 75 231 Paris Cedex 05, France
Adaptive focusing of ultrasonic waves under the guidance of a Magnetic Resonance (MR) system is demonstrated for medical applications. This technique is based on the maximization of the ultrasonic wave intensity at one targeted point in space. The wave intensity is indirectly estimated from the local tissue displacement induced at the chosen focus by the acoustic radiation force of ultrasonic beams. Coded ultrasonic waves are transmitted by an ultrasonic array and an MRI scanner is used to measure the resulting local displacements through a motion sensitive MR sequence. After the transmission of a set of spatially encoded ultrasonic waves, a non iterative inversion process is employed to accurately estimate the spatial-temporal aberration induced by the propagation medium and to maximize the acoustical intensity at the target. Both programmable and physical aberrating layers introducing strong distortions (up to
radians) were recovered within acceptable errors (<0.8 rad). This non invasive technique is shown to accurately correct phase aberrations in a phantom gel with negligible heat deposition and limited acquisition time. These refocusing performances demonstrate a major potential in the field of MR-Guided Ultrasound Therapy in particular for transcranial brain HIFU.
keywords: Adaptive focusing, Hadamard, MR Acoustic Radiation Force Imaging, MR guided HIFU, phase aberrations.
Introduction
Adaptive focusing of ultrasonic waves is a challenging problem in the field of medical ultrasound. The heterogeneities of biological tissues in terms of speed of sound, density or ultrasonic absorption induce a distortion of the ultrasonic wavefield that can result in a partial destruction of the focusing pattern. In order to restore the focusing quality, adaptive focusing relies on the use of ultrasonic arrays to correct the distortions induced by the propagation medium. This correction is performed by estimating and applying different time shifts (or phase shifts for monochromatic waves) on each element of the array. In some situations, when the ultrasonic array relies both on transmit and receive channels, it may be possible to rely on the echoes of a bright reflector or a point like active
source located inside the biological tissues. From the signals received on the array, the so called Green‟s function, one has to time reverse the wavefield (or phase conjugate for monochromatic signals) to focus back on the initial position. For example, time reversal focusing [1], [2] has encountered a significant success in the ultrasound community because piezoelectric transducers enable the exact recording and transmitting of broadband signals (i.e. transmission and recording of both amplitude and phase of the wavefield). Time reversal focusing was also extended to heterogeneous and dissipative media by applying the concept of spatio-temporal inverse filter [3]-[5]. In a weak scattering medium with no strong reflector which is the case in many biological tissues, it is also possible to take advantage of the spatial coherence of the backscattered signals to estimate the time shifts induced by a thin aberrator with slow spatial variations [6]-[8].
However, the direct measurement of the Green‟s function between the target location and the ultrasonic array is not always possible. In some configurations, echoes backscattered by the medium heterogeneities are too weak to be recorded by the array. For example, focusing ultrasound in the brain for therapeutic or imaging purposes has long been limited by the strong heterogeneities of the skull bone [9]. The large discrepancy between the high speed of sound of the skull (up to 4000m/s) and the low speed of sound of brain tissues (about 1500 m/s) completely destroys the focusing pattern in the brain. The strong attenuation from the skull also makes backscattered signals from brain tissues unusable [10]. Similar issues are found, to a less extent, in other deep organs located under strong aberrating tissue layers such as the liver which is partially covered by the ribs [11], [12]. In other configurations, the ultrasonic array can only be used in transmission and no receive channels are available to record backscattered echoes. This is very often the case in High Intensity Focused Ultrasound (HIFU) where the therapeutic array is only devoted to therapy and consequently is driven by electronic channels working only in the transmit mode. One can no more rely on ultrasonic echoes carrying information about the aberrations of the propagation medium.
For such configurations, we have recently introduced a novel method called energy-based adaptive focusing [13]. The general principle, which can be applied to any kind of waves in physics,
relies on the indirect estimation of the wave intensity at the target for different coded excitations in order to obtain the time shifts (or phase shifts) information correcting the aberrations. By transmitting Hadamard-coded signals with an array of transducers and estimating the beam intensity at the target, this approach was shown to achieve a direct and accurate phase aberration correction without any phase measurement. In medical ultrasound, this idea is particularly interesting because ultrasonic waves interact with biological tissues through physical effects linked to the wave intensity such as the acoustic radiation force or tissue heating due to the absorption of ultrasound. Thus, the quantitative measurement of tissue displacement or temperature elevation [14] at the target can be used for the indirect estimation of the local beam intensity.
The use of tissue displacements induced by the acoustic radiation force of the ultrasonic beams for energy-based adaptive focusing was validated by Herbert et al [13]. Due to the transfer of momentum from the acoustic wave to the medium [15], the radiation force induced by a short burst of ultrasound (~100µs) generates a local tissue displacement of several tens of micrometers at the focus of the ultrasound beam [16]. Small displacements (typically tens of microns) can be easily detected by ultrasonic means while remaining under the safety norms for medical ultrasound imaging. The use of this acoustic radiation force as a source of shear vibrations is currently used in clinical applications for the estimation of local stiffness [17]-[19]. In our previous study [13], tissue displacement was estimated using speckle tracking obtained from pulse echo ultrasound sequences which provided quantitative and real time measurements of tissue displacement. The ultrasonic array was able both to transmit the ultrasonic coded excitations and to estimate the resulting displacements at the targeted location for a complete auto-correction of the aberrations. However, although ultrasound-based motion estimation was possible in this “proof of concept” experiment, ultrasound imaging cannot be used accurately through very strong phase aberrating medium. Indeed, beam distortions dramatically degrade the efficacy of speckle tracking at the target location. Moreover, in complex cases such as transcranial focusing, one cannot even rely on ultrasonic backscattered echoes due to the strong attenuation of the skull bone. In such cases, another imaging modality is required to provide an indirect estimation of the beam energy at the target.
We propose here to use Magnetic Resonance (MR) imaging to guide the energy-based adaptive focusing of the ultrasonic beam. Although conventional MR systems cannot image the very small displacement (on the order of 1 nm) induced by ultrasound at high frequency (~ 1MHz), MR imaging can be used to map larger displacement (on the order of 1µm) induced by the acoustic radiation force of ultrasonic longer bursts (typically some hundreds of microseconds) at a much lower frequency (< 1kHz). In recent studies, MR motion sensitive sequences have been developed to map displacements induced by the acoustic radiation force in biological tissues [16], [20]-[22]. By synchronizing the short ultrasound bursts at precise timings of the MR sequence it is possible to detect small tissue displacements on the order of one micrometer with millimeter spatial resolution. To our knowledge, the experiments presented in this paper correspond to the first demonstration of MRI adaptive focusing of ultrasonic beams.
This approach is particularly interesting for HIFU applications with therapeutic arrays used only in transmit mode as many HIFU therapeutic applications are already being performed under MR guidance, such as uterine fibroids [23], breast tumor [24] or brain tumor ablation [25]. Although not widely available clinically yet, these treatments currently use MR to target the ablation zone and monitor the temperature elevation. In this paper, we demonstrate that MR guidance of HIFU therapy can also be used to achieve the adaptive focusing of the ultrasound beam prior to the treatment. This technique could potentially improve the focusing quality in all HIFU applications [26]. In the case of transcranial brain therapy, this technique could have even more importance. In practical clinical configurations, it could potentially become a very efficient and fast way to provide non invasive adaptive focusing of the ultrasonic beam through the skull, just before the treatment.
A theoretical framework of the energy-based adaptive focusing is first developed in the Material and Methods section and the link between energy based and time reversal focusing is illustrated. The experimental setup and the MR motion sensitive sequences are then presented. In the second section, the results of the phase aberration corrections obtained through strong aberrating
layers are shown. The performance of the aberration correction process is investigated as a function of the motion encoding duration and of the number of available independent channels. Finally, the limitations and potential applications are discussed in the last section.
Materials and Methods
A – Theory
As explained above, MR systems are not sensitive enough and do not provide a sufficient temporal resolution to detect the very small displacements (nm) at ultrasonic frequencies (MHz) but can detect larger displacements (some µm) as those generated by the radiation pressure. By focusing a long burst of ultrasound focused at a given location, it is possible to create a volumic radiation force inside a dissipative medium at relatively low frequency (low kHz range). This force is due to the momentum transfer from the acoustic wave to the medium, caused by dissipation or reflection of the acoustic wave [15]. In medical applications, dissipation remains the dominant term in the radiation force and micrometric displacements can easily be induced in tissues with limited acoustic intensities. For a dissipative medium, it is common to write that the radiation pressure is a volumetric force proportional to the acoustic intensity:
e I c e c P F 2 2 2 0 2 , (1)
where P,cand are respectively the pressure, the velocity and the attenuation of ultrasound, being the mass density of the medium. eis the direction of ultrasonic propagation and I P2/(2c) is the local acoustic intensity. This force will generate bulk and shear waves propagating in the medium with their respective speeds, depending on the elastic properties of the medium. The spatio-temporal distribution of the displacement field generated by this force is complex and depends on many
parameters such as the size and shape of the radiating focal spot and the viscoelastic properties of the medium [27]. The maximum displacement is found to be linearly linked to the intensity.
As monochromatic signals are considered here, it is convenient for sake of clarity to use the Fourier transform of the signals. Indeed, in the Fourier domain, the wave propagation between the ultrasonic array and the focal plane can be described very simply in a matrix formalism. For more details, the reader can refer to [3]. Working with monochromatic waves, the transmit signal of each transducer Xi (1 i N) can be expressed by a complex number ei describing the amplitude and the
phase of the emission. The total pressure received at the desired focus can be expressed as a complex number p containing the phase and amplitude of the local monochromatic field:
N i i ie g p ... 1 , (2)where gi are complex coefficients that relate the emission signal ei on each element Xi with its
resulting field at the focal point. In the Fourier domain, these coefficients are formally describing the Green‟s function between the positions of the transducers xi and focal point rF,gi=GrF,xi().
In a compact notation, an emission vector e [e1..eN]t, and a „propagation‟ vector
] .. [g1 gN
g can be introduced and equation (2) becomes:
g.e
p . (3)
In the proposed technique, the pressure at the focus is maximized by adjusting the phases and amplitudes of the emission signals. This maximization has to be done using only the information on the intensity (i.e. the displacement) at the focal point.
The most straightforward method [28] consists in a two-transducer optimization. If one considers a configuration where the first transducer (working as a reference transducer) transmits simultaneously with another transducer that is phase shifted relatively to the reference, the emission
vector corresponds to e [1,0..0,ej,0..0]. The pressure fields generated by both transducers interfere at the desired focal point. It is possible to tune the phase until the optimal phase is found which maximize the intensity in the desired focal point. The procedure must be repeated with each transducer of the array.
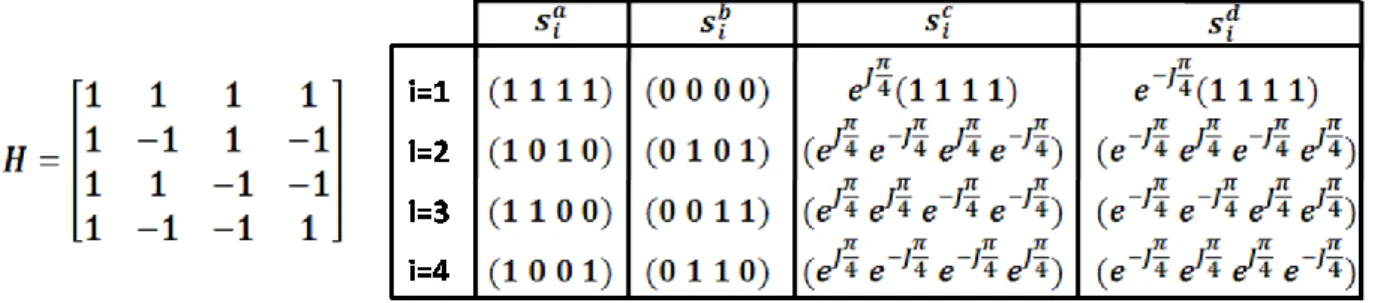
However, the radiation force generated by two single elements of the array is not sufficient to induce a displacement detectable by the MRI system. To solve this problem, Herbert et al. proposed to apply the same optimization principle to large sets of elements, the so-called “virtual transducers”, instead of applying it to two single elements. The phase shift between the emissions of those two virtual transducers is then optimized. In practice, all elements can be used to build different virtual transducers. Indeed, an elegant set of independent emission vectors is given by the Hadamard‟s matrix,H [h1,h2..hn], where each column hi of the matrix represents an emission vector (see Figure 1). The pressure obtained at the focus from the emission of hion the whole set of array
elements is i H i
p g.h . Defining a pressure vector pH [p1,..pn] describing the field received at focus for all the successive N emissions hi, one can write:
g.H
pH . (4)
The goal of the aberration process is to estimate the vector g that describes the propagation from the array to the focal point. The knowledge of g will provide us a direct way to correct for the aberrations. For this purpose, the phase of each emission set hihas to be optimized relatively to the
reference virtual transducerh1. To do that, the intensity resulting of the interferences between the reference emission h1 and each of the others emission signals hiis measured. A practical method to
recover the amplitude and phase of piH is to perform the following four particular combined
) ( ) ( ) ( ) ( 1 2 2 1 2 2 1 2 1 1 2 1 i d i i c i i b i i a i j j h h s h h s h h s h h s . (5)
These emissions present the advantage of giving enough displacement to be measured by the MRI system because almost half of the transducers of the array are used simultaneously. Another interest is that the relative amplitude level required from each transducer is always 0 or 1 (see example in fig.1) and the electronic channel does only control the relative phase between the transducers. This simplification has an important impact in terms of electronics complexity. Indeed, this kind of transmit codes can be provided even by HIFU hardware systems that do not allow variable transmit voltage on each individual electronic channel.
Figure 1. Example of the Hadamard matrix for N=4 elements and the signals si used for the
optimization process with a total of 16 ultrasonic transmissions. The amplitude of si is always 0 or 1.
The pressure at desired focus for the emission sai is
a i a i
p g.s and the intensity
is c I a i a i 2 2 g.s
. So, intensities generated by the four different excitations described above are:
) /( ) ( ) /( ) ( ) /( ) ( ) /( ) (
]
[
]
[
]
[
]
[
c p p imag p p I c p p imag p p I c p p real p p I c p p real p p I H i H H i H d i H i H H i H c i H i H H i H b i H i H H i H a i 2 2 2 2 1 2 2 1 2 1 2 1 1 2 2 1 2 1 2 1 1 2 1 2 4 1 2 1 4 1 1 2 1 2 4 1 2 1 4 1 . (6)The pressure field at the focal point is deduced from this system of equations: ) ( ) ( ) ( ) ( c i d i H i H b i a i H i H I I c p p imag I I c p p real 1 1 2 . (7) As H
p1 is the reference signal obtained at the focus, we can consider arbitrarily that the phase of H
p1 is 0 and its relative amplitude can be obtained as (2cI1 a
)1/2 by using hi h1 in equation (6). Finally, the different pressures received at focus are:
) /( ) ( ) ( / ) ( ) ( H c i d i H i H b i a i H i p I I p imag p I I p real 1 1 2 (8)
These values of piH can be estimated and used in equation (4). By inversing the Hadamard matrix (H
-1
=Ht), the propagation vector (both in amplitude and phase) describing the Green‟s function between the array and the desired focal spot is finally:
t H
.H p
g . (9)
Once the Green‟s function is estimated, it is very simple to correct for the aberrations. It was shown that the optimal way to maximize the ratio between the acoustic intensity received at focus and the total acoustic intensity delivered by the array is to use the time reversed version of the Green‟s function [3]. This consists in inverting the phase and using the amplitude information of the Green‟s function as a transmission signal. Indeed, time reversal focusing performs both a spatial and temporal matched filter for the propagation operator [3].
Regarding temporal focusing, this demonstration is straightforward and is recalled here. For a set of transmitted signals s, the ratio R between the acoustic intensity received at focus and the total acoustic intensity delivered by the array is given by :
2 2 2 2 2 g s gs s p R . (10)
Thanks to Cauchy-Schwartz relation, ratio R becomes maximal when the transmission signal s is proportional to the conjugate of the Green‟s function:
i i F
i G r X g
s ( , ) (11)
The same kind of arguments can be proposed both for space and time and the interested reader can refer to [3] for a complete demonstration. Applying an amplitude gi and a phase value -
gi oneach element i will maximize the ratio R and thus the efficiency of the acoustic deposit at the focus. It corresponds to the solution provided by the well known time reversal approach [3]. One can also decide to reduce the aberration correction to a single phase compensation (by applying the same amplitude on each element of the array and only inverting the phase of the Green‟s function). This approach increases the amount of energy deposit at focus but could result in undesired heat deposit along the travel path in highly absorbing areas.
B – Experimental setup
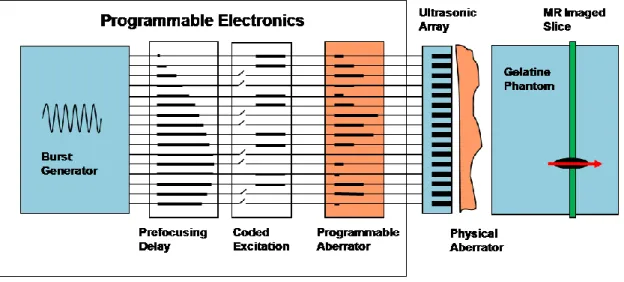
Figure 2 shows the experimental setup. A 128-element linear phased array (Vermon, France) operating at 6MHz (spatial pitch 0.3 mm) was used inside a 7T MRI scanner (Bruker, Germany). The array is controlled by a fully programmable electronic system (Lecoeur Electronics, France) able to emit independent signals on 64 US channels. We thus used only one half of the 128-element array. The ultrasonic emissions were directly triggered by the MR scanner itself. It allowed an accurate synchronization of the US emissions with the MR acquisition. The ultrasonic waves propagated inside a tissue mimicking phantom made of 4% gelatin. An aberrator was placed between the array and the phantom. Depending on the experiment, the phase aberration was either “virtual" using a programmable aberrator or “real” using a physical aberrator. The programmable aberrator consisted of additional programmable delays placed at the emission stage in the US electronics. The physical aberrator consisted of two stripes of PolyDiMethylSiloxane (PDMS) or various thickness and width
placed between the array and the gelatin phantom. This material was chosen for its low attenuation and its speed of sound (approximately 1080 m/s) which is significantly lower than in the phantom.
Figure 2. Experimental setup. Fully programmable electronics are able to send independant signals on all channels. Three different phase delays are numerically added via a dedicated control software. 1) Constant prefocusing delays are used to transmit the signals in phase at the target. 2) Then coded emissions are needed for the aberration correction procedure; 3) Last, programmable delays are used in some experiments. A physical aberrator may alternatively be placed between the ultrasonic array and the gelatine medium.
A burst of ultrasound of typically 400µs generates displacements in the medium through the radiation force effect. These displacements are relatively moderate (a few µm) and as soon as ultrasounds are switched off, the medium gets back to its original position while a radiated shear wave propagates in the elastic gel within a few ms.
C – Motion sensitive MR sequences
As recently published [16], [20]-[22], ultrasound induced tissue displacements can be mapped via MRI. To image these displacements, the combined MRI/ultrasonics sequence must take into
account two important points: it must be sensitive enough to detect a micrometric displacement and it must be fast enough to image it before shear wave propagation occurs. Shear wave propagation degrades the spatial localization of the detailed focusing pattern and makes mechanical energy appear where no radiation force is present. The sequence is schematized in Figure 3. A spin echo MR sequence was modified to encode for motion (TE=15ms/TR=500ms). This consisted in adding 2 periods of sinusoidal gradients symmetrically positioned before and after the 180° radiofrequency pulse of the sequence. A frequency of 600Hz was chosen for the gradients with maximum amplitude of 300mT/m. As detailed latter, this choice maximized the sensitivity to motion while minimizing the US emission duration. The displacements were mapped in one slice oriented transversely to the US beam. The slice was positioned to contain the chosen point where the aberration correction is to be performed. The motion sensitizing gradients (MSG) were placed on the slice selection axis to be sensitive to the displacement along the US beam. The radiation force induced displacement at the focus was assumed to be mostly oriented along that direction. The displacement field was mapped in a 32*256 voxel matrix with an in-plane resolution of 300µm*200µm and a slice thickness of 3mm. The sensitivity to motion was about one micron.
Two 400µs ultrasound bursts were emitted at the beginning of the second half period of each MSG. Such a configuration avoids any motion during the first lobes of the MSG which would destroy motion encoding. We found it to be the best configuration both in term of motion encoding and in term of signal to noise ratio. The acoustic duty cycle remained below 0.2% which ensured the safety of the US transducer as well as the absence of heat deposition in the phantom.
Figure 3. Proposed MR sequence for radiation force imaging at 7T. Two 600Hz sinusoidal gradients are added on the slice selection axis of a standard spin echo sequence. Two 400µs US pulses are triggered to the second lobe of each of the MSG.
The MR phase ΔΦ is linked to the spatiotemporal displacement profile u(r,t) via the following relationship:
, (12)
where is the proton gyromagnetic constant and G the motion sensitizing gradient magnetic field.
D – Adaptive focusing process
In this work, only 64 adjacent channels were used to keep the acquisition time reasonable. Furthermore, the focal plane was located around 2.5cm away from the array. Given the directivity of the transducers and the pitch of the array, very little signal would be emitted from the lateral elements if more than 64 channels were used and thus the phase correction would become difficult for those elements.
The three delays described in Figure 2 enabled to decompose the total delay applied to each channel during the acquisitions. Starting with a plane wave, a prefocusing cylindrical delay was added to target one chosen point in space where the correction is to be performed. This prefocusing delay generated a sharp focus at the target. Then, as shown in the theoretical part the adaptive focusing procedure implied to emit coded emissions. This consisted of using only some of the channels with additional phase delays for some of them according to equation 5. Then a phase aberrator was either programmed (see section Results - C) and added numerically to the previous delays or physically placed between the ultrasonic array and the gelatine medium (see section Results - D).
The excitation-imaging sequence (see Figure 3) was repeated 4*64 times corresponding to the four emissions (sa, sb, sc and sd) in equation (5) for the 64 Hadamard vectors. The emission amplitude was set to the maximum value deliverable by the electronics for all acquisitions (80V peak to peak). For the 256 emissions, the whole acquisition lasted around 2.5 hours. The obtained MR phase maps were unwrapped. A reference image acquired without ultrasound was subtracted to each image to get real displacement weighted data and quantify the acoustic power at the focus. The set of time delays and amplitudes to be applied on each element of the US array for the optimal focusing was then recovered by the direct inversion of equation 9. It is to be noticed that the MR phase was recorded over a 2D plane while the sole knowledge of the acoustic intensity at the targeted point was really needed. The 2D imaging capability, although time consuming could be used in different manners as discussed later.
In a first experiment, an aberrating phase profile with strong phase shifts was programmed in the transmitted US beam. The recovered phase correction was compared to the programmed input. In a second experiment, a physical aberrator was placed between the array and the phantom, in this case, the recovered phase correction was compared to the Green‟s function of the targeted point as measured via a pulse echo experiment with an acoustic reflector placed at the target.
E – Simulations
Simulations of the elastic response of the gel were also performed in order to determine the influence of the duration of motion encoding on the phase correction. The theoretical visco-elastic Green‟s function was computed using the method developed by Bercoff et al. [27]. The freely available ultrasound simulation program Field II [29]-[30] was used to simulate the pressure field generated by the linear array in monochromatic regime (6MHz). The resulting acoustic radiation force was computed over a 4x4x4 mm3 grid with a spatial step of 0.25 mm.
Then, a dedicated code [27] was used to simulate the viscoelastic displacement response u(r,t) of the gel submitted to a 400µs sonication. This method is based on an explicit derivation of the 3D Green's function in a viscoelastic medium taking into account shear, bulk, and coupling waves. The acoustic radiation force was used as the volumic shear source. The shear wave speed of the medium was taken as 1.5m/s as measured on 4% gelatin gels via the Supersonic Shear Imaging technique [31]. The shear viscosity was neglected. The mass density was taken as 1kg/m3 and the speed of sound 1540m/s.
Finally, the complete spatio-temporal viscoelastic displacement response u(r,t) was used to simulate the MR motion encoding. The MR phase was computed using equation 12 with sinusoidal MSG gradients of varying frequency. It allowed studying the influence of the speed of motion encoding (i.e. the frequency of the MSG) on the resulting recovered phase. The MR phase was then discretized over a grid composed of voxel of 0.25x0.25x3 mm3. The influence of the number of channels used for the acquisition was studied numerically.
Results
A – Experimental verification of the relation between MR signal and acoustic intensity
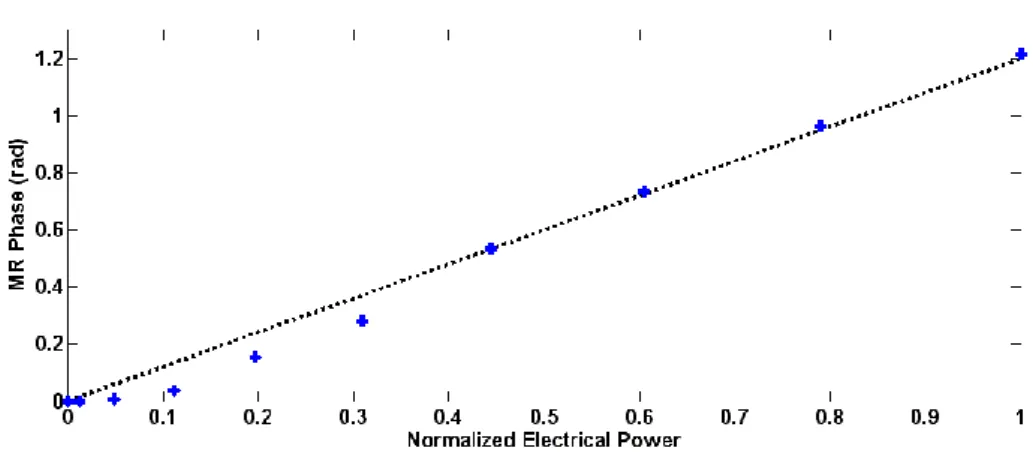
An important assumption of the energy based adaptive focusing method is that the measured signal at the targeted point is linearly linked to the acoustic intensity. This is verified through the recording of the viscoelastic response of the phantom for different amplitudes of the emitted ultrasonic signal. This relationship was measured prior to all experiments and the displacement was found to rise with the applied voltage U according to a quadratic law as shown on Figure 4 for an experiment with a physical aberrator in front of the array (see Results-C). From the integration over time in equation (12), the MR phase at the targeted point is linearly linked to the acoustic intensity I so that ΔΦ~U²~I.
On Figure 4, the relatively poor fit of the data at low emitted power is explained by the limited signal to noise ratio of the MR phase images.
Figure 4. Calibration curve obtained with a PDMS physical aberrator in front of the linear array. The MR phase is plotted as a function of the normalized electrical power together with the best linear fit. All subsequent acquisitions were performed at maximum power.
B – Simulations
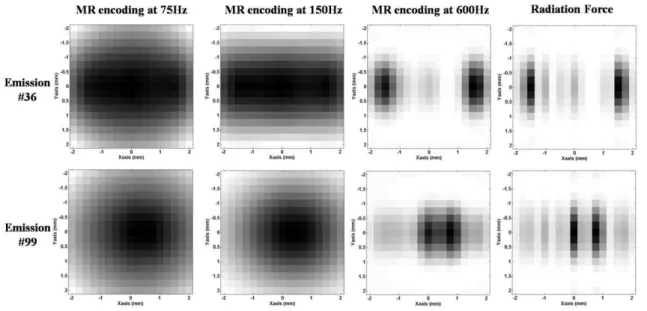
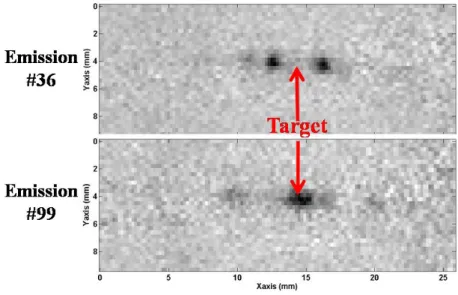
In order to demonstrate the feasibility of the experiment and to determine the influence of the frequency of the MSG on the results, the whole experiment was simulated. The prefocusing delay was chosen to target a point located 30mm deep in the medium. The pressure field was simulated in 3D for each of the 256 emissions with 0.25mm*0.25mm*0.25mm resolution using the Field II software. The corresponding viscoelastic responses were obtained for a 400µs ultrasonic burst. The MR motion encoding step was simulated for 3 different sinusoidal MSG frequencies assuming that the US bursts were emitted at the beginning of the second half periods on Figure 3. Figure 5 shows the simulated MR phase maps obtained for two different ultrasonic emission phase profiles. As both the emission delays are Hadamard-coded transmissions and the ultrasonic beam propagates through the aberrator, the ultrasonic beam is not sharply focused at the target. The spatial distribution of the pressure field (and the acoustic radiation force) is complex and presents several important lobes as shown on the right column of Figure 5. Figure 5 shows that for some emission phase profiles such as emission #36,
the spatial peak of the radiation force distribution is not even located at the target. In order to estimate the correct beam intensity at the target, the tissue displacement should reproduce well enough the spatial distribution of the acoustic radiation force. This assumption is correct only during a very short time at the beginning of the mechanical excitation. However, for long excitations, the spatial distribution of tissue displacement evolves rapidly due to the viscoelastic response of the medium. Figure 5 compares three different MSG frequencies (with identical sonication durations). Only the 600Hz MSG is short enough to reproduce correctly the acoustic radiation force distribution. At lower MSG frequencies, the evolution of the spatial and temporal distribution of tissue displacements resulting from the shear wave propagation introduces a mis-estimation of the acoustic radiation force at focus. The displacement estimated by the motion encoding MR sequence is no more directly proportional to the ultrasonic intensity at the focus. If not carefully taken into consideration, this bias would affect the inversion process and thus the complete adaptive focusing approach.
Figure 5. Normalized simulated MR phase maps in XY plane with encoded displacement in the focal plane direction (X is parallel to the linear array). Three different MSG frequencies are compared: 75Hz (left column), 150Hz (middle left column) and 600Hz (middle right column) for two different arbitrary US emissions (#36 and 99) over the 256 calculated. For comparison, the normalized radiation force distributions are given in the last column.
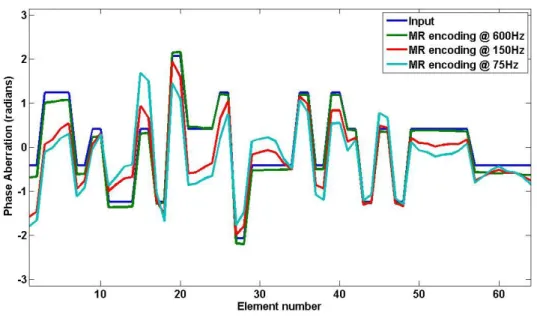
The complete adaptive focusing process was simulated. The phase aberrations were numerically introduced in the computation of the pressure field. An arbitrary aberration was chosen for each of the 64 elements between –π and π. From the simulated MR phase, a simple inversion of the Hadamard matrix gave the recovered phase profile. Figure 6 shows the profile of the phase aberration along the linear array. The recovered phase profiles for MSG at 75Hz, 150Hz and 600Hz are plotted on the same graph. Because of the propagation of the shear waves in the gel, a slow encoding result in a misevaluation of the radiation force at the targeted point [32]. In fact, the measured intensity at this point is polluted by the propagation from the neighboring lobes as shown on Figure 5 for two different Hadamard emissions.
Figure 6. Numerical phase aberrations along the 64 elements linear array: input values (blue curve), recovered values for the simulated experiment with MSG frequency at 600Hz (green), 150Hz (red) and 75Hz (light blue).
These fully simulated experiments demonstrate the feasibility of the proposed phase recovery procedure via MRI and show the importance of the choice of the duration of motion encoding. From this preliminary work, a frequency of 600Hz corresponding to an encoding duration of 833µs should give very good results and was adopted for the following experiments. In theory an even shorter duration should further improve the results for a 400µs burst assuming an infinite signal to noise ratio
on the MRI acquisitions. However, in 4% gelatin gels and given the available acoustic power, 600Hz appeared to be the experimental limit to get a reliably quantifiable MR phase image. In general, the choice of the MSG frequency remains a compromise between shear wave propagation and MR motion sensitivity.
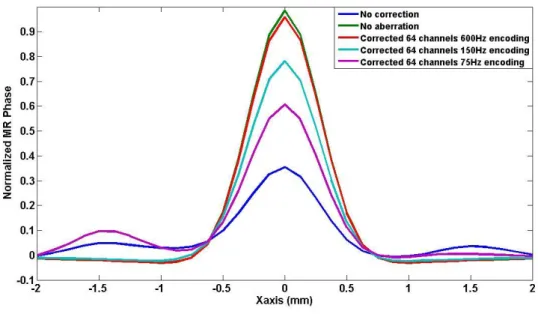
Finally, the focusing pattern recovered after adaptive focusing correction for different encoding speed was compared to the ideal focusing pattern. As shown on figure 7, the simulation at 600Hz is very close to the ideal case whereas the focus quality is strongly destroyed with increasing encoding duration.
Figure 7. Simulated profile of the focal spot in the X direction (along the array) measured with the proposed sequence. MR phase signals obtained using the correcting phase values recovered from the virtual experiments with MSG at 600Hz (red curve), 150Hz (light blue curve) and 75Hz (purple curve) are compared with ideally corrected (green curve) and not corrected (blue curve) ones.
From those simulations, a frequency of 600Hz was chosen as a good compromise between encoding speed and signal to noise ratio.
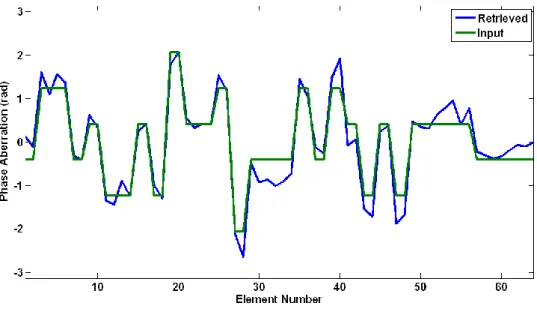
Using programmable delays (see Figure 2) the presence of a known phase aberrator between the array and the propagating medium is simulated. The difference with a real physical aberrator is that the phase aberration layer is infinitely thin and has no attenuation. MR imaging allowed accurate estimation of the acoustic power at the focus of the array. Two examples of MR phase maps recorded for the Hadamard coded emissions number 36 and 99 are given on Figure 8. After the complete 256 transmit experiment, the proposed adaptive focusing method was able to recover the spatial distribution of phase aberrations in gelatin phantoms for the same numerical phase aberrating layer as the one previously used for simulations. The programmable phase aberration profile is shown together with the recovered phases on Figure 9. A low error was found on the non invasive phase aberration estimation (standard deviation of 0.30 radians).
Figure 8. Example MR phase images for two Hadamard coded emissions (#36 and #99) in the presence of a programmed aberration in front of the ultrasonic array.
Figure 9. Numerical phase aberrations along the 64 elements linear array: programmable phase aberrations (green curve) and recovered values for the MR guided experiment with MSG frequency at 600Hz (blue curve).
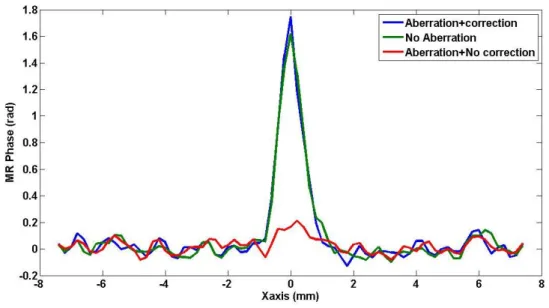
A refocusing test was done after phase correction to compare the technique with an ideally focused beam. An estimate of the acoustic power at the focus was mapped using MR with and without phase correction and an increase of a factor of 10 was found. Figure 10 shows the measured MR phase along the X axis for the non aberrated focusing phase profile, the aberrated phase profile and the corrected phase profile. It is to be noticed that the focal spot after phase correction had a slightly greater energy than with a perfect non aberrated focusing law. This may be caused by the unexpected presence of a small physical additional phase aberrations in front of the array (bubbles, impurities, transducer defects) which were also corrected by the adaptive focusing procedure.
Figure 10. Retrieved MR displacement weighted signal at the target along the axis of the US array for the corrected ultrasound beam (blue curve) as compared with the signal obtained without correction (red curve) and with no aberration (green curve).
D – Experiments with a physical Aberrator
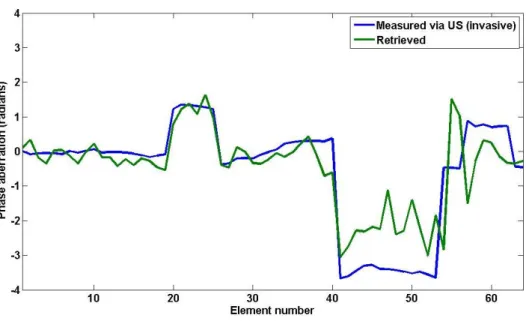
The same procedure was employed with two PDMS stripes placed against the linear array (see Figure 11). The aberration profile recovered along the 64 elements after phase correction is given on Figure 12. The effect of the two stripes of different widths is clearly visible. To evaluate the actual phase aberration, the whole setup was taken outside of the magnet and a strong reflector (thin iron bar) was inserted in the gel at the approximate targeted point. A pulse echo ultrasonic experiment gave the Green‟s function of the target on the 64 elements used for the MR guided adaptive focusing experiment. This aberration is also plotted on figure 12. A good accordance was found between both measurements (standard deviation of the difference equal to 0.83 radians).
Figure 11. Picture of the ultrasonic linear array with two PolyDiMethylSiloxane stripes positioned in front of it to generate strong aberrations.
Figure 12. Phase correction obtained with the proposed method for 2 physical aberrating stripes placed in front of elements number 23 and 48 of the 64 element US array (blue curve). The phase measured by a pulse echo US experiment is overlaid in green.
The procedure also gives a calculated profile for the amplitude aberration. The calculated correction for the amplitude shows very weak energy transmission in the region of the strongest aberration (elements on the right side of the array). This amplitude aberration explains the relatively high error on the estimation of the phase correction in that area. The proposed adaptive focusing procedure is capable of recovering the optimal amplitude to emit on each transducer in order to avoid
absorbing and aberrating structures and maximize the energy at the focus. In this study, however, no amplitude correction was performed and the maximum emitted power was maintained identical on all 64 channels. Only the phase was corrected.
In order to assess the quality of the correction, the MR phase signal at the focus was measured after phase correction and an increase of a factor of 5 was found. Side lobes have disappeared. Figure 13 shows the measured MR phase in the focal plane along the direction of the array (X) for the aberrated phase profile and the corrected phase profile. Figure 14 shows the corresponding MR phase maps in the focal plane (XY).
Figure 13. Measured MR phase in the focal plane along the direction of the array (X) for the non corrected (green) and the corrected phase profile (blue) in the presence of a PDMS aberrator in front of the US array.
Figure 14. Measured MR phase maps in the focal plane (XY) prior any correction (left) and after the adaptive focusing procedure (right).
E – Influence of the number of channels
The performance of the adaptive focusing method was investigated as a function of the number of independent channels. The complete adaptive focusing process was simulated with the previous programmable phase aberrator. The whole dataset corresponding to the 64 transducers elements (i.e. 4*64 simulated MR phase images) was first considered. Then, this dataset was truncated to select the 4*32 emissions corresponding to an adaptive procedure performed with only 32 transducers elements of twice the width of the previous individual elements. They corresponded to the Hadamard vectors for which 2 neighboring elements of the array always emitted the same signals. Finally, in the same way, a second truncation was performed to simulate the procedure for N=16 transducer elements. In this case, the 64 elements were coupled by groups of 4 consecutive elements. In this way, the total aperture of the array did not change but the spatial sampling was degraded.
Figure 15.a presents the phase aberration profile recovered from the full 64 elements simulated experiment and from the degraded 32 and 16 elements experiments. The result with 32 elements of double width is identical to the one obtained with all the single 64 elements whereas the results with
16 independent channels is highly degraded. This is due to the spatial spectrum of the chosen phase profile. The actual spatial fluctuations of the aberration profile do not contain high frequencies since every element has the same phase as one of its neighbor. The aberration profile can be written as a linear combinaison of the 32 most slowly fluctuating Hadamard vectors among the 64 vectors used in the full procedure. This means that for this particular aberrator, the optimal result could be reached with only 4*32 independent coded excitations as they will be sufficient to describe the full aberrations. This is of particular importance as the adaptive focusing procedure would require half the full acquisition time. The reduction from 64 elements to 32 elements of doubled size corresponds to a reduction of the inversion process to a lower rank in terms of independent spatial frequencies. As the results were unchanged here, the particular aberrator chosen for the experiment does not contain very high spatial frequencies. In other words, the correlation length characterizing the spatial distribution of the aberrations is higher than the doubled element size. This result clearly emphasizes the interest of studying the spatial frequency content of the aberrating medium along the array aperture.
Figure 15 a) Recovered phase aberration profiles from simulated experiments: input, recovered with 64, 32 and 16 independent channels. b) Recovered spatial profiles of the simulated MR phase without any correction, with no aberration, with corrected phase profiles obtained from the full 4*64 emissions acquisition and from the decimated acquisition to 32 or 16 independent channels.
The previous example implies that the knowledge of the spectrum of a given aberration on the Hadamard‟s vectors basis determines the number of independent spatial frequencies needed for an optimal correction. In this context, the use of the Walsh decomposition of the aberration is highly informative in order to optimize the experimental acquisition. Indeed, Walsh‟s vectors are equal to Hadamard‟s vectors but are ordered from low frequencies to highly fluctuating signals. The decomposition of a given aberration profile on the Walsh basis gives its spatial frequency content as
the first vectors of the Walsh basis correspond to low spatial frequency profiles and the last ones correspond to high frequency spatial fluctuations. This information is valuable because it enables to determine the optimal number of degree of freedom required in the array aperture to fully correct the aberrations.
The Walsh “spectrum” of the proposed numerical aberrator was calculated for the 64 channels and the degraded 32 and 16 channels simulated experiments (see Figure 16). As expected, it showed no peak over Walsh‟s vector number 32 for the input aberration. This gives the minimum number of independent channels needed for the adaptive focusing in this special case. To evaluate the effects of the degraded acquisition, the recovered corrected focal spots using the phase corrections obtained with 64, 32 and 16 channels were compared (Figure 15.b). On the same plot, the simulated MR phase profile in the focal plane is given for the cases without aberrations and without any correction. The curves for 64 and 32 channels are strictly identical.
It is interesting to notice that the recovered phase profile for the 16 channels case has a Walsh spectrum which is more rich than a simple low pass truncation of the spectrum of the complete aberration (Fcut=16). The proposed physically based adaptive focusing procedure retrieves the best possible phase correction given the limited available information. This is suggested when comparing the energy at the focus for the 16 channels decimated acquisition with the one obtained from a theoretical phase correction given by a low pass truncation of the spectrum of the aberrator. The decimated acquisition gives better results.
Figure 16. Walsh spectrum of the programmed aberrator together with the spectra of the aberrators retrieved from the simulated experiments with 64 0.3mm width elements, 32 0.6mm width elements and 16 1.2mm width elements.
Discussion
In this work, a new adaptive focusing technique is employed to correct the phase distortions of an ultrasonic wave beam. It is based on the measurement of the acoustic radiation force via MRI. The technique is successfully employed in simulations and real experiments for both programmable and physical aberrations with phase shifts up to 2π. The restored energy at the targeted point is measured and the maximum acoustic intensity is reached after correction. A sharp focus is restored and the intensity is increased by a factor of 5. Although the proof of concept of MR-guided adaptive ultrasonic focusing is illustrated using a 1D linear array performing the aberration correction in the 2D imaging plane of the ultrasonic array, this concept is straightforwardly applicable to any kind of 2D ultrasonic arrays.
The simulation work demonstrates the importance of motion encoding on the final result: due to shear wave propagation, the US bursts as well as the MR motion encoding must be as short as
possible to keep an accurate mapping of the radiation force at the target. The stiffer the medium, the more significant this effect becomes. The experimental limitation comes from the MR sensitivity to motion which is related to the signal to noise ratio and to the motion encoding gradients of the sequence. At 7T, in relatively soft gelatin gels, the compromise was found for 400µs bursts and 600Hz MSG. In the perspective of applying the proposed technique to transcranial adaptive focusing for brain HIFU, a gel with an elasticity of about 1.5m/s was employed. This value roughly corresponds to the published value in the brain over the same range of excitation frequencies [33].
In the present work, we reached a very good correction with a limited US duty cycle. Short bursts of 400µs were transmitted during the MR imaging sequence and the US duty cycle was kept below 0.2 % during the full acquisition time of 150 minutes. With such a low duty cycle, the temperature elevation at the end of the procedure was not significant which ensures the safety of this method.
The precision of the phase correction depends on the SNR of the displacement detection for all the coded transmissions. The retrieved delays can become erroneous for those of the elements which are much attenuated (amplitude aberration). This limit must be evaluated for each particular application. It has to be noticed that in such cases, the technique also finds that low amplitude signals have to be emitted by those attenuated channels.
This new adaptive focusing method should be applicable to clinical HIFU treatments in a whole body MR magnet. A major application of the proposed MR-guided approach should be transcranial brain HIFU. In this perspective, Table 1 sums up the values of the main technical parameters in a clinical system as compared with the one used in the present work. The ultrasound frequency is an important parameter to consider. Because the lateral dimension of the focal zone and the distance between the side lobes is the same order of magnitude than the ultrasound wavelength, the visco-elastic response of the medium requires more time to destroy the initial displacement pattern. Therefore, the motion encoding duration can be increased when the US frequency decreases without significant blurring of the displacement maps due to wave propagation. This roughly compensates the
lower available MSG strength at 1.5T and enables to reach similar sensitivity to motion in both cases. The use of lower gradient strength for motion encoding is required for in vivo application considering MR safety guidelines [34]. Moreover, the pressure amplitude required to induce micrometric displacements through the human skull bone at typical HIFU treatment frequencies (around 1 MHz) is of the order of some MPa and corresponds to typical acoustic intensities used in transcranial HIFU [10], [35-36]. Moreover, the absence of skull displacement in the case of a stereotactic approach will ensure that the aberration correction can be performed without being degraded by motion artifacts. Effects of the blood flow on displacement data are expected to be small and partly cancelled out by a systematic difference between Hadamard coded MR phase signals and zero emission signal.
In the framework of HIFU brain therapy, the aberrations introduced by the skull bone are similar than the ones corrected in the present experiments. The performances reached in the present study should thus be sufficient to correct aberrations from the skull in an acceptable manner. A common criterion states that 0.8 radians is an acceptable residual phase delays after correction [37]. Here, we are below this limit in most cases.
Magnetic field 7T 1.5T
US probe 64 channels diagnostic linear array
512 channels HIFU spherical array
Medium Gelatine 4% Brain tissue
US frequency 6MHz 1MHz
MSG Gradients strength 300mT/m 40mT/m
Motion sensitivity ~ 1 µm ~ 1 µm
Table 1. Comparison of the main technical parameters in the perspective of a transposition of the technique at 1.5T.
The acquisition time was not optimized in this work and the complete adaptive focusing sequence was lasting around 2.5 hours for 64 channels. This was mainly due to technical limitations of the electronics which enforced us to load at low transfer rate one US emission on the electronic boards at a time. This roughly doubled the total acquisition duration. Another limitation derives from the obligation to image a 2D plane with at least 32 lines with the available motion sensitive sequence. Using a line scan approach is feasible with an orthogonal orientation for the excited and the refocused slices in the spin echo scheme. This will result in a significant time reduction of a factor 32. Shorter TR may also be used, especially in the brain where the MR signal is good. Last, 3N emissions should be theoretically sufficient to perform the proposed technique and recover the phase aberrator without loss in precision. All things considered, a time reduction factor of roughly 300 can be reasonably envisaged resulting in a 4 minutes acquisition time for the full adaptive focusing with 512 channels in a clinical MRI. Such a short acquisition time is totally compatible with clinical therapeutic transcranial ultrasound applications. In particular, time constrained applications become possible. For instance, ultrasonic treatment of stroke that requires a fast therapeutic response (<4 hours after the event) could be envisioned with such an adaptive focusing procedure [38].
In addition, the 2D imaging capability, although time consuming at first sight could be exploited to learn the correcting delays to properly focus at several different locations in parallel. For instance, it should be possible to focus at 2 different points in the same imaged plane with 2 sub-arrays resulting in 2 restored focusing capabilities, one with each half of the array. Even further, if the MRI is sensitive enough to motion, the array could emit a non pre-focused wave. After the transmission of all coded emissions, the knowledge of the acoustic energy at any specific point in the imaged plane should allow to find the right focusing law for this point.
Moreover, the Walsh analysis of the aberration gives another mean of optimizing the acquisition. For instance, it is possible to start the acquisition with the slow spatial phase fluctuations and determine a cutoff frequency over which no further correction is needed. This approach could help optimizing the acquisition time. It could also be used to perform a two step optimization with a rough low frequency correction followed by a refined high frequency one.
When some information is known on the spatial distribution profile of the aberrating layer, the adaptive focusing procedure can be accelerated as the number of required coded excitations is decreased. The example of transribs HIFU is a good illustration of this point. In transribs ultrasonic focusing, most of the aberration correction consists in shutting down the array elements that are located in front of each rib so that the ultrasonic beam only propagates in the intercostal spacing. As this intercostal spacing can be estimated before the treatment, the aberration profile could be potentially described by a limited number of Hadamard vectors and thus results in a short number of data acquisitions.
Finally, an important aspect of this adaptive focusing technique is related to safety issues in HIFU treatments. As the optimization process is based on the direct measurement of local displacements at the desired focus, it also provides a direct control of the efficacy of the adaptive beam correction process. The displacement field measured using the motion sensitive sequence can be used to check before the treatment that the correction is correctly maximizing the acoustic intensity delivered at the targeted focus.
References
[1] M. Fink, “Time reversal of ultrasonic fields. I. Basic Principles,” IEEE Trans Ultrason Ferroelectr Freq Control. 1992;39(5):555-66.
[2] F. Wu, JL Thomas, M Fink, “Time reversal of ultrasonic fields. Il. Experimental results,” IEEE Trans Ultrason Ferroelectr Freq Control. 1992;39(5):567-78.
[3] M. Tanter, J.-L. Thomas, and M. Fink, “Time reversal and the inverse filter,” J. Acoust. Soc. Amer., 108(1):223–234, Jul. 2000.
[4] M. Tanter, J.-F. Aubry, J. Gerber, J.-L. Thomas, and M. Fink, “Optimal focusing by spatio-temporal inverse filter. I. Basic principles,” J. Acoust. Soc. Am., 110(1):37–47, Jul. 2001.
[5] J.-F. Aubry, M. Tanter, J. Gerber, J.-L. Thomas, and M. Fink. “Optimal focusing by spatio-temporal inverse filter. II. Experiments. Application to focusing through absorbing and reverberating media,” J. Acoust. Soc. Am., 110(1): 48-58, Jul. 2001.
[6] M. O‟Donnell, and S. W. Flax, “Phase aberration measurements in medical ultrasound: Human studies,” Ultrasonic Imaging, 10(1):1–11, Jan. 1988.
[7] R. Mallart, and M. Fink, “Adaptive focusing in scattering media through sound-speed inhomogeneities: The van Cittert Zernike approach and focusing criterion,” J. Acoust. Soc. Am., 96(6): 3721–3732, Dec. 1994.
[8] J. P. Astheimer, W. C. Pilkington, and R. C. Waag, “Reduction of variance in spectral estimates for correction of ultrasonic aberration,” IEEE Trans. Ultrason. Ferroelect. Freq. Contr., 53(1):79-89, Jan. 2006.
[9] F. J. Fry, and J. E. Barger, “Acoustical properties of the human skull,” J. Acoust. Soc. Am. 63:1576–90, 1978.
[10] M. Pernot, J.-F. Aubry, M. Tanter, J. L. Thomas, and M. Fink, “High power transcranial beam steering for ultrasonic brain therapy,” Phys. Med. Biol., 48(3):2577–2589, Aug. 2003.
[11] J.-F. Aubry, M. Pernot, F. Marquet, M. Tanter, and M. Fink, “Transcostal high-intensity-focused ultrasound: adaptive focusing feasibility study,” Phys. Med. Biol. 53(11):2937-2951, Jun. 2008.
[12] J. Ballard, A. Casper, Y. Wan, and E. Ebbini. “Adaptive Transthoracic Refocusing of Dual-Mode Ultrasound Arrays,” IEEE Trans. Biomed. Eng. 2009 JUL.
[13] E. Herbert, M. Pernot, G. Montaldo, M. Fink, and M. Tanter, “Energy based adaptive focusing: application to non invasive aberration correction of ultrasonic wavefield,” IEEE Trans. Ultrason. Ferroelect. Freq. Contr., to be published.
[14] B. D. de Senneville, B. Quesson, and C. T. Moonen.”Magnetic resonance temperature imaging,” Int. J. Hypertherm., 21(6):515-31. Review. Sep. 2005.
[15] G. R. Torr, “The acoustic radiation force,” Am. J. Phys., 52(5):402–408, 1984.
[16] A. P. Sarvazyan, O. V. Rudenko, S. D. Swanson, J. B. Fowlkes, and S. Y. Emelianov, “Shear wave elasticity imaging: a new ultrasonic technology of medical diagnostics,” Ultrasound Med. Biol., 24(9):1419-35. Nov. 1998.
[17] K. Nightingale, M. S. Soo, R. Nightingale, and G. Trahey, “Acoustic radiation force impulse imaging: In vivo demonstration of clinical feasibility,” Ultrasound Med. Biol., 28(2): 227–235, Feb. 2002.
[18] M. Tanter, J. Bercoff, A. Athanasiou, T. Deffieux, J.-L. Gennisson, G. Montaldo, M. Muller, A. Tardivon, and M. Fink. “Quantitative Assessment of Breast Lesion Viscoelasticity: Initial Clinical Results Using Supersonic Shear Imaging,” Ultrasound Med. Biol., 34(9): 1373-1386. Sep. 2008. [19] M. Muller, J.-L. Gennisson, T. Deffieux, M. Tanter, and M. Fink, “Quantitative Viscoelasticity Mapping Of Human Liver Using Supersonic Shear Imaging: Preliminary In Vivo Feasability Study,” Ultrasound Med. Biol., 35(2): 219-229, Feb. 2009.
[20] R. Sinkus, M. Tanter, J. Bercoff, K. Siegmann, M. Pernot, A. Athanasiou, and M. Fink, “Potential of MRI and Ultrasound Radiation Force in Elastography: Applications to Diagnosis and Therapy,” Proceedings of the IEEE, 96(3):490-499. 2008.
[21] R. Souchon, R. Salomir, O. Beuf, L. Milot, D. Grenier, D. Lyonnet, J. Y. Chapelon, and O. Rouvière, “Transient MR Elastography (t-MRE) using ultrasound radiation force: Theory, safety, and initial experiments in vitro,” Magn. Reson. Med., 60(4):871–881. Oct. 2008.
[22] N. McDannold, and S. E. Maier, “Magnetic resonance acoustic radiation force imaging,” Med. Phys. 35(8), Aug 2008.
[23] F. M. Fennessy, and C. M. Tempany, “A review of magnetic resonance imaging-guided focused ultrasound surgery of uterine fibroids,” Topics in Magnetic Resonance Imaging, 17(3):173-179. Jun. 2006.
[24] E. C. Gombos, D. F. Kacher, H. Furusawa, and K. Namba, “Breast focused ultrasound surgery with magnetic resonance guidance,” Topics in Magnetic Resonance Imaging, 17(3):181-188. Jun. 2006.
[25] K. Hynynen, N. McDannold, G. Clement, J. A. Jolesz, E. Zadicario, R. Killiany, T. Moore, and D. Rosen, “Pre-clinical testing of a phased array ultrasound system for MRI-guided noninvasive surgery of the brain-a primate study,” European Journal of Radiology. 59(2):149-56. Aug. 2006. [26] J. E. Kennedy, G. R. ter Haar, and D. Cranston, “High intensity focused ultrasound: surgery of the future?,” British Journal Of Radiology.76(909).pp590-599. Sep. 2003.
[27] J. Bercoff, M. Tanter, M. Muller, and M. Fink. “The role of viscosity in the impulse diffraction field of elastic waves induced by the acoustic radiation force,” IEEE Trans. Ultrason. Ferroelect. Freq. Contr., 51(11):1523-36. Nov. 2004.
[28] M. W. Urban, M. Bernal, and J. F. Grenleaf, “Phase aberration correction using ultrasound radiation force and vibrometry optimization,” IEEE Trans. Ultrason. Ferroelect. Freq. Contr., 54(6): 1142-1153, Jun. 2007.
[29] J. A. Jensen, and N. B. Svendsen, “Calculation of pressure fields from arbitrarily shaped, apodized, and excited ultrasound transducers,” IEEE Trans. Ultrason. Ferroelect. Freq. Contr., 39(2): 262-267, Mar. 1992.
[30] J. A. Jensen, “Field: A Program for Simulating Ultrasound Systems,” paper presented at the 10th Nordic-Baltic Conference on Biomedical Imaging Published in Medical & Biological Engineering & Computing, 34:351-353, Supplement 1, Part 1, 1996.
[31] J. Bercoff, M. Tanter, and M. Fink, “Supersonic shear imaging: a new technique for soft tissue elasticity mapping,” IEEE Trans. Ultrason. Ferroelect. Freq. Contr., 51(4):396-409. Apr. 2004. [32] S. Calle, J. P. Remenieras, O. B. Matar, M. E. Hachemi, and F. Patat, “Temporal analysis of tissue displacement induced by a transient ultrasound radiation force,” J. Acoust. Soc. Am., 118(5):2829-40, Nov. 2005.
[33] S. Nicolle, M. Lounis, R. Willinger, and J. F. Palierne, “Shear linear behavior of brain tissue over a large frequency range,” Biorheology. 42(3): 209-223. 2005.
[34] “Medical Electrical Equipment – Part 2-33: Particular requirements for the safety of magnetic resonance equipment for medical diagnosis,” International Standard, IEC 60601-2-33, 2nd
edition 2002-05.
[35] M. Pernot, J.-F. Aubry, M. Tanter, A.-L. Boch, F. Marquet, M. Kujas, D. Seilhan, and M. Fink, “In vivo transcranial brain surgery with an ultrasonic time reversal mirror,” Journal Of Neurosurgery, 106(6),1061-1066, Jun. 2007.
[36] M. Tanter, M. Pernot, J.-F. Aubry, G. Montaldo, F. Marquet, and M. Fink, “Compensating for bone interfaces and respiratory motion in high-intensity focused ultrasound,” Int. J. of Hyperthermia, 23(2), 141-151, Mar. 2007.
[37] J. W. Goodman, “Statistical Optics”, ed. Wiley, Hoboken (NJ). 1985.
[38] C. A. Molina, A. D. Barreto, G. Tsivgoulis, P. Sierzenski, M. D. Malkoff, M. Rubiera, N. Gonzales, R. Mikulik, G. Pate, J. Ostrem, W. Singleton, G. Manvelian, E. C. Unger, J. C. Grotta, P. D. Schellinger, and A. V. Alexandrov, “Transcranial ultrasound in clinical sonothrombolysis (TUCSON) trial,” Ann. Neurol., 66(1):28-38. Jul. 2009.