HAL Id: hal-02624977
https://hal.inrae.fr/hal-02624977
Submitted on 26 May 2020
HAL is a multi-disciplinary open access
archive for the deposit and dissemination of sci-entific research documents, whether they are pub-lished or not. The documents may come from teaching and research institutions in France or abroad, or from public or private research centers.
L’archive ouverte pluridisciplinaire HAL, est destinée au dépôt et à la diffusion de documents scientifiques de niveau recherche, publiés ou non, émanant des établissements d’enseignement et de recherche français ou étrangers, des laboratoires publics ou privés.
Distributed under a Creative Commons Attribution - NonCommercial| 4.0 International License
MIFlowCyt-EV: a framework for standardized reporting
of extracellular vesicle flow cytometry experiments
Joshua A. Welsh, Edwin van der Pol, Ger J. A. Arkesteijn, Michel Bremer,
Alain Brisson, Frank Coumans, Francoise Dignat-George, Erika Duggan,
Ionita Ghiran, Bernd Giebel, et al.
To cite this version:
Joshua A. Welsh, Edwin van der Pol, Ger J. A. Arkesteijn, Michel Bremer, Alain
Bris-son, et al.. MIFlowCyt-EV: a framework for standardized reporting of extracellular vesicle
flow cytometry experiments. Journal of Extracellular Vesicles, Taylor & Francis, 2020, 9 (1), �10.1080/20013078.2020.1713526�. �hal-02624977�
Journal of Extracellular Vesicles
ISSN: (Print) 2001-3078 (Online) Journal homepage: https://www.tandfonline.com/loi/zjev20
MIFlowCyt-EV: a framework for standardized
reporting of extracellular vesicle flow cytometry
experiments
Joshua A. Welsh, Edwin Van Der Pol, Ger J.A. Arkesteijn, Michel Bremer, Alain
Brisson, Frank Coumans, Françoise Dignat-George, Erika Duggan, Ionita
Ghiran, Bernd Giebel, André Görgens, An Hendrix, Romaric Lacroix, Joanne
Lannigan, Sten F.W.M. Libregts, Estefanía Lozano-Andrés, Aizea
Morales-Kastresana, Stephane Robert, Leonie De Rond, Tobias Tertel, John Tigges,
Olivier De Wever, Xiaomei Yan, Rienk Nieuwland, Marca H.M. Wauben, John
P. Nolan & Jennifer C. Jones
To cite this article: Joshua A. Welsh, Edwin Van Der Pol, Ger J.A. Arkesteijn, Michel Bremer,
Alain Brisson, Frank Coumans, Françoise Dignat-George, Erika Duggan, Ionita Ghiran, Bernd Giebel, André Görgens, An Hendrix, Romaric Lacroix, Joanne Lannigan, Sten F.W.M. Libregts, Estefanía Lozano-Andrés, Aizea Morales-Kastresana, Stephane Robert, Leonie De Rond, Tobias Tertel, John Tigges, Olivier De Wever, Xiaomei Yan, Rienk Nieuwland, Marca H.M. Wauben, John P. Nolan & Jennifer C. Jones (2020) MIFlowCyt-EV: a framework for standardized reporting of extracellular vesicle flow cytometry experiments, Journal of Extracellular Vesicles, 9:1, 1713526, DOI: 10.1080/20013078.2020.1713526
To link to this article: https://doi.org/10.1080/20013078.2020.1713526
© 2020 The Author(s). Published by Informa UK Limited, trading as Taylor & Francis Group on behalf of The International Society for Extracellular Vesicles.
View supplementary material
Published online: 03 Feb 2020.
Submit your article to this journal
Article views: 2807
Full Terms & Conditions of access and use can be found at
MIFlowCyt-EV: a framework for standardized reporting of extracellular vesicle
flow cytometry experiments
Joshua A. Welsh a, Edwin Van Der Polb,c,d, Ger J.A. Arkesteijn e, Michel Bremerf, Alain Brissong, Frank Coumansb,c,d,
Françoise Dignat-Georgeh,i, Erika Dugganj, Ionita Ghiran k, Bernd Giebelf, André Görgensf,l,m, An Hendrix n,
Romaric Lacroix h,i, Joanne Lannigano, Sten F.W.M. Libregtse,p, Estefanía Lozano-Andrés e, Aizea
Morales-Kastresana a, Stephane Robertm, Leonie De Rondb,c,d, Tobias Tertelf, John Tiggesk,q, Olivier De Wevern,
Xiaomei Yan r, Rienk Nieuwlandc,d, Marca H.M. Wauben e, John P. Nolanjand Jennifer C. Jones a
aTranslational Nanobiology Section, Laboratory of Pathology, Center for Cancer Research, National Cancer Institute, National
Institutes of Health, Bethesda, MD, USA; bBiomedical Engineering and Physics, Amsterdam UMC, University of Amsterdam,
Amsterdam, The Netherlands;cLaboratory Experimental Clinical Chemistry, Amsterdam UMC, University of Amsterdam, Amsterdam,
The Netherlands; dVesicle Observation Center, Amsterdam UMC, University of Amsterdam, Amsterdam, The Netherlands; eDepartment of Biochemistry and Cell Biology, Faculty of Veterinary Medicine, Utrecht University, Utrecht, The Netherlands; fInstitute for Transfusion Medicine, University Hospital Essen, University of Duisburg-Essen, Essen, Germany;gUMR-5248-CBMN,
CNRS-University of Bordeaux-IPB, Pessac, France;hCenter of Cardiovascular Research and Nutrition (C2VN) UMR-INSERM INRA 1263,
Aix-Marseille Université, INSERM, Marseille, France; iHematology and Vascular Biology Department, CHU La Conception, Assistance
Publique-Hôpitaux de Marseille, Marseille, France; jScintillon Institute, San Diego, CA, USA; kDepartment of Medicine, Beth Israel
Deaconess Medical Center, Harvard Medical School, Boston, MA, USA;lClinical Research Center, Department for Laboratory
Medicine, Karolinska Institutet, Stockholm, Sweden;mEvox Therapeutics Ltd, Oxford, UK; nLaboratory of Experimental Cancer
Research, Department of Human Structure and Repair, Ghent University Hospital, Ghent, Belgium;oFlow Cytometry Core, School of
Medicine, University of Virginia, Charlottesville, VA, USA;pNIHR Cambridge BRC Cell Phenotyping Hub, Department of Medicine,
University of Cambridge, Cambridge, UK;qFlow Cytometry Core, Beth Israel Deaconess Medical Center, Boston, MA, USA;rMOE Key
Laboratory of Spectrochemical Analysis & Instrumentation, Key Laboratory for Chemical Biology of Fujian Province, Department of Chemical Biology, College of Chemistry and Chemical Engineering, Xiamen University, Xiamen, People’s Republic of China
ABSTRACT
Extracellular vesicles (EVs) are small, heterogeneous and difficult to measure. Flow cytometry (FC) is a key technology for the measurement of individual particles, but its application to the analysis of EVs and other submicron particles has presented many challenges and has produced a number of controversial results, in part due to limitations of instrument detection, lack of robust methods and ambiguities in how data should be interpreted. These complications are exacerbated by the field’s lack of a robust reporting framework, and many EV-FC manuscripts include incomplete descriptions of methods and results, contain artefacts stemming from an insufficient instrument sensitivity and inappropriate experimental design and lack appropriate calibration and standar-dization. To address these issues, a working group (WG) of EV-FC researchers from ISEV, ISAC and ISTH, worked together as an EV-FC WG and developed a consensus framework for the minimum information that should be provided regarding EV-FC. This framework incorporates the existing Minimum Information for Studies of EVs (MISEV) guidelines and Minimum Information about a FC experiment (MIFlowCyt) standard in an EV-FC-specific reporting framework (MIFlowCyt-EV) that supports reporting of critical information related to sample staining, EV detection and measure-ment and experimeasure-mental design in manuscripts that report EV-FC data. MIFlowCyt-EV provides a structure for sharing EV-FC results, but it does not prescribe specific protocols, as there will continue to be rapid evolution of instruments and methods for the foreseeable future. MIFlowCyt-EV accommodates this evolution, while providing information needed to evaluate and compare different approaches. Because MIFlowCyt-EV will ensure consistency in the manner of reporting of EV-FC studies, over time we expect that adoption of MIFlowCyt-EV as a standard for reporting EV- FC studies will improve the ability to quantitatively compare results from different laboratories and to support the development of new instruments and assays for improved measurement of EVs.
ARTICLE HISTORY Received 8 May 2019 Revised 16 December 2019 Accepted 17 December 2019 KEYWORDS
Extracellular vesicles; flow cytometry; framework; reporting; standardization
CONTACT Joshua A. Welsh [email protected]; Jennifer C. Jones [email protected] Translational Nanobiology Section, Laboratory of Pathology, Center for Cancer Research, National Cancer Institute, National Institutes of Health, Bethesda, MA 20892, USA; Rienk Nieuwland [email protected] Laboratory Experimental Clinical Chemistry, Amsterdam UMC, University of Amsterdam, Meibergdreef 9, Amsterdam, The Netherlands; Marca H.M. Wauben [email protected] Department of Biochemistry and Cell Biology, Faculty of Veterinary Medicine, Utrecht University, Utrecht, The Netherlands; John P. Nolan [email protected] Scintillon Institute, San Diego, CA, USA
Supplemental data for this article can be accessedhere. 2020, VOL. 9, 1713526
https://doi.org/10.1080/20013078.2020.1713526
© 2020 The Author(s). Published by Informa UK Limited, trading as Taylor & Francis Group on behalf of The International Society for Extracellular Vesicles.
This is an Open Access article distributed under the terms of the Creative Commons Attribution-NonCommercial License (http://creativecommons.org/licenses/by-nc/4.0/), which permits unrestricted non-commercial use, distribution, and reproduction in any medium, provided the original work is properly cited.
Introduction
Extracellular vesicles (EVs) have tremendous potential value as biomarkers and therapeutic targets [1,2]. However, EVs are small, heterogeneous and therefore difficult to measure. Sensitive and reproducible methods for single EV analysis are essential to understand the biogenesis, diversity and fate of EVs and to apply this understanding to improve human health. Flow cytometry (FC) is a powerful method that provides accurate and precise enumeration of single cells and measurement of their molecular components. For these reasons there is an interest in applying FC to the measurement of individual EVs. However, most commercial flow cytometers, and the assays that employ them, (i) were designed for the analysis of cells that are orders of magnitude larger than EVs, (ii) are not readily adapted to the measurement of EVs and (iii) generate data which can only be interpreted if all experimental details are reported. Limitations in instru-ment sensitivity, assay specificity and a general failure to adequately report experimental details together have pro-duced a scientific literature that is rife with artefacts.
General guidelines regarding methods and data reporting have been developed for both flow cytometry (Minimum Information about a Flow Cytometry experi-ment, MIFlowCyt) [3] and EV research (Minimum Information for the Study of EVs, MISEV) [4,5]. In addition, the EV-TRACK initiative provides an open access platform for documenting essential information for EV publications [6]. However, these resources do not comprehensively address reporting component allowing full interpretation of FC data on EVs, which is critical for the validation and improvement of flow cyto-metry-based EV analysis. Here, a group of researchers active in the International Society of Extracellular Vesicles (ISEV), International Society for Advancement of Cytometry (ISAC) and/or International Society for Thrombosis and Haemostasis (ISTH) Vascular Biology Scientific Standardization Committee, have been working to develop a framework for reporting EV FC methods and results, named MIFlowCyt-EV. Consensus about what to report was reached by discussions spanning sev-eral years within the WG by teleconferences and by speaking and presenting ideas to the wider community satellite meetings at ISEV, ISAC and ISTH conferences.
MIFlowCyt-EV is intended to complement the MIFlowCyt and MISEV documents by providing a fundamental reporting structure, with seven cate-gories, each with clearly defined specific components, that should be considered and reported for EV FC studies. MIFlowCyt-EV has been developed to account for the wide variety of protocols currently used. MIFlowCyt-EV will be refined and revised periodically,
as EV-related technologies and applications develop, as is the case for the MIFlowCyt and MISEV guidelines. MIFlowCyt-EV is structured for researchers to simply document which of the seven categories and sub-components were considered, performed and recorded in the studies. The WG feel that currently there is not a gold-standard EV flow cytometry workflow, and the field will continue to struggle to identify robust meth-ods until EV researchers adopt a standardized frame-work for reporting data in a consistent, benchmarked manner.
As well as a reporting framework, MIFlowCyt-EV can also serve as a guide for the development of educational resources for researchers desiring to measure EVs. We expect that this framework will support the development and validation of new technologies for EV analysis.
MIFlowCyt-EV structure and utilization
MIFlowCyt-EV utilizes the MISEV guidelines from ISEV for reporting preanalytical variables [4,5], and the MIFlowCyt guidelines from ISAC for reporting FC experimental design and general variables related to FC [3]. The proposed framework for MIFlowCyt-EV integrates and extends these two established societal guidelines to promote more standardized reporting of single EV analyses using FC.
The MIFlowCyt-EV framework addresses seven areas: 1) preanalytical variables and experimental design, 2) sample preparation, 3) assay controls, 4) instrument calibration and data acquisition, 5) EV characterization, 6) FC data reporting, 7) FC data
shar-ing.Figure 1 shows an overview of the framework and
its components, whereas Table 1 provides a table for completion of the framework. This framework should be used for all work where FC is used for the analysis of single EVs. A template table for the MIFlowCyt-EV framework can be downloaded from www.evflowcyto
metry.organd is found in Supplementary Table 1. The
component for each category states:“the rationale” for reporting and “what to report”. Table 2 provides a “brief example” of the reporting component and is not intended as “gold standards”. The hypothetical examples provided for each component are not exhaus-tive in detail and are not intended to promote the use of a single particular methodology, but instead to pro-vide the manner in which each component should be reported.
Generally, if researchers have performed any of the components mentioned in this framework, it should be elaborated upon. However, it is not a requirement to complete all the framework components. Depending
upon the design of an experiment, it may be sufficient to state why completion of a component was not necessary. It is at the reviewer’s discretion to examine the completed reporting framework and decide if the level of detail and utilized controls were sufficiently conducted and reported.
Preanalytical variables and experimental design
Pre-analytical factors include the method of sample col-lection, isolation and storage before measuring. These preanalytical factors are critical determinants of experi-mental reproducibility. Isolation steps include proce-dures to enrich, fractionate and/or concentrate EVs relative to other sample components. Relevant pre-analytical factors have been described extensively in the literature, leading to the development of the MISEV guidelines, the EV-TRACK platform and other relevant guidelines from international societies including: ISEV,
ISAC and ISTH [4–9]. We recommend that pre-analytical variables are reported according to the MISEV guidelines [4]. Furthermore, we recommend that the ISAC MIFlowCyt guidelines checklist is com-pleted and reported for all EV-FC experiments, as well as to report experimental preanalytical variables related to basic flow cytometric equipment and reagents [3].
Report preanalytical variables conforming to MISEV guidelines
Rationale
Preanalytical variables affect the purity and yield of EVs but vary depending on the sample sources. Preanalytical variables for clinical samples may include: needle gauge, collection tube type, sample handling and EV isolation/enrichment. Furthermore, accounting for donor-associated variables, such as source, age, sex or fasting status, may substantially alter biofluid EV characteristics and therefore the statistical associations
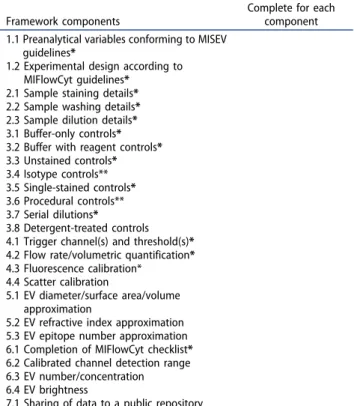
Figure 1.Overview of the MIFlowCyt EV Reporting Framework. The left column shows each category of the reporting framework and the middle column shows the components within each category, the right-hand column shows the broad objective of each row. *Highlights the component that are broadly applicable to the majority of single-EV analysis experiments regardless of design or instrumentation. **Highlights the components that are only applicable in cases where certain reagents or protocols are used.
of a study. For non-clinical samples, such as tissue culture-derived samples, pre-analytical variables may include: culture container, culture medium, incubation time, growth factors and EV isolation procedures. ISEV periodically updates the MISEV guidelines to incorpo-rate consensus on preanalytical variables for a wide range of sample types and highlights position papers that detail best-practices for sample collection from different biological fluids [4,5]. EV-FC experiments should be reported with information that states what guidelines or customized procedures were followed. Report
Preanalytical variables relating to EV sample including source, collection, isolation, storage and any others relevant and available in the performed study.
Report experimental design according to MIFlowCyt guidelines
Rationale
Providing a clear purpose of the performed experi-ments and a concise and detailed description of the variables of an FC experiment(s) allows the reader to understand and interpret the subsequent data of the performed experiment(s).
Report
EV-FC manuscripts should provide a brief description of the experimental aim, keywords and variables for the performed FC experiment(s) using MIFlowCyt check-list components: 1.1, 1.2 and 1.3, respectively [3]. Completion of the entire MIFlowCyt checklist at this point is also advised here, in order to address subse-quent MIFlowCyt checklist components that are inte-gral to the MIFlowCyt-EV framework components, such as Components 2.1, 4.1 and 6.1, below.
Sample preparation
The sample preparation components allow for the reporting of variables that pertain to the sample stain-ing, washing and dilution for flow cytometric analysis and do not include preanalytical variables about the sample listed in Category 1.
Sample staining Rationale
A number of variables affect the labelling efficacy of a sample, including: EV concentration, label concentra-tion, incubation time, temperature, conjugation efficiency, label-type (and clone if monoclonal antibodies are used) and light exposure. A particularly critical reporting com-ponent of these is the final concentration of a label in appropriate units, for example mole L−1 or µg mL−1. There are cases where antibody concentration is not pro-vided or where antibodies are self-conjugated. In these cases, antibody concentration should be approximated with a spectrophotometer and the methods reported appropriately. Self-conjugated antibodies should provide the conjugation kit catalogue number and lot number. Report
State any steps relating to the staining of samples. Along with the method used for staining, provide relevant reagent descriptions as listed in MIFlowCyt guidelines (Component 2.4 Fluorescence Reagent(s) Descriptions).
Sample washing Rationale
Wash steps can affect FC sample measurements by decreasing the concentration of excess label, thereby increasing the signal-to-noise ratio. Depending on how these steps are performed, wash steps may also dilute or alter the characteristics of the sample being measured. Reporting details of any wash steps allows improved reproducibility of FC data.
Table 1.MIFlowCyt-EV framework.
Framework components
Complete for each component 1.1 Preanalytical variables conforming to MISEV
guidelines*
1.2 Experimental design according to MIFlowCyt guidelines*
2.1 Sample staining details* 2.2 Sample washing details* 2.3 Sample dilution details* 3.1 Buffer-only controls* 3.2 Buffer with reagent controls* 3.3 Unstained controls* 3.4 Isotype controls** 3.5 Single-stained controls* 3.6 Procedural controls** 3.7 Serial dilutions* 3.8 Detergent-treated controls 4.1 Trigger channel(s) and threshold(s)* 4.2 Flow rate/volumetric quantification* 4.3 Fluorescence calibration*
4.4 Scatter calibration
5.1 EV diameter/surface area/volume approximation
5.2 EV refractive index approximation 5.3 EV epitope number approximation 6.1 Completion of MIFlowCyt checklist* 6.2 Calibrated channel detection range 6.3 EV number/concentration 6.4 EV brightness
7.1 Sharing of data to a public repository
*Highlights the components that are broadly applicable to the majority of single-EV analysis experiments regardless of design or instrumentation. **Highlights the components that are only applicable in cases where certain reagents or protocols are used.
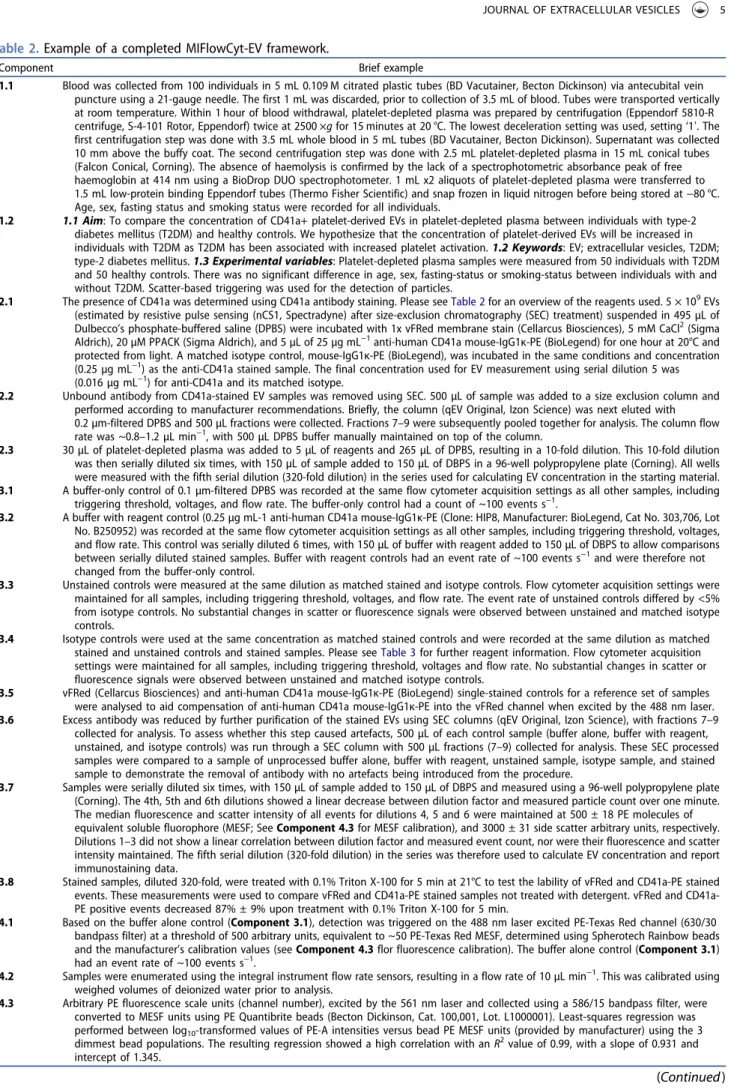
Table 2.Example of a completed MIFlowCyt-EV framework.
Component Brief example
1.1 Blood was collected from 100 individuals in 5 mL 0.109 M citrated plastic tubes (BD Vacutainer, Becton Dickinson) via antecubital vein puncture using a 21-gauge needle. The first 1 mL was discarded, prior to collection of 3.5 mL of blood. Tubes were transported vertically at room temperature. Within 1 hour of blood withdrawal, platelet-depleted plasma was prepared by centrifugation (Eppendorf 5810-R centrifuge, S-4-101 Rotor, Eppendorf) twice at 2500 ×g for 15 minutes at 20 °C. The lowest deceleration setting was used, setting‘1ʹ. The first centrifugation step was done with 3.5 mL whole blood in 5 mL tubes (BD Vacutainer, Becton Dickinson). Supernatant was collected 10 mm above the buffy coat. The second centrifugation step was done with 2.5 mL platelet-depleted plasma in 15 mL conical tubes (Falcon Conical, Corning). The absence of haemolysis is confirmed by the lack of a spectrophotometric absorbance peak of free haemoglobin at 414 nm using a BioDrop DUO spectrophotometer. 1 mL x2 aliquots of platelet-depleted plasma were transferred to 1.5 mL low-protein binding Eppendorf tubes (Thermo Fisher Scientific) and snap frozen in liquid nitrogen before being stored at−80 °C. Age, sex, fasting status and smoking status were recorded for all individuals.
1.2 1.1 Aim: To compare the concentration of CD41a+ platelet-derived EVs in platelet-depleted plasma between individuals with type-2 diabetes mellitus (T2DM) and healthy controls. We hypothesize that the concentration of platelet-derived EVs will be increased in individuals with T2DM as T2DM has been associated with increased platelet activation.1.2 Keywords: EV; extracellular vesicles, T2DM; type-2 diabetes mellitus.1.3 Experimental variables: Platelet-depleted plasma samples were measured from 50 individuals with T2DM and 50 healthy controls. There was no significant difference in age, sex, fasting-status or smoking-status between individuals with and without T2DM. Scatter-based triggering was used for the detection of particles.
2.1 The presence of CD41a was determined using CD41a antibody staining. Please seeTable 2for an overview of the reagents used. 5 × 10⁹EVs
(estimated by resistive pulse sensing (nCS1, Spectradyne) after size-exclusion chromatography (SEC) treatment) suspended in 495 µL of Dulbecco’s phosphate-buffered saline (DPBS) were incubated with 1x vFRed membrane stain (Cellarcus Biosciences), 5 mM CaCl2(Sigma
Aldrich), 20 µM PPACK (Sigma Aldrich), and 5 µL of 25 µg mL−1anti-human CD41a mouse-IgG1κ-PE (BioLegend) for one hour at 20°C and protected from light. A matched isotype control, mouse-IgG1κ-PE (BioLegend), was incubated in the same conditions and concentration (0.25 µg mL−1) as the anti-CD41a stained sample. The final concentration used for EV measurement using serial dilution 5 was (0.016 µg mL−1) for anti-CD41a and its matched isotype.
2.2 Unbound antibody from CD41a-stained EV samples was removed using SEC. 500 µL of sample was added to a size exclusion column and performed according to manufacturer recommendations. Briefly, the column (qEV Original, Izon Science) was next eluted with 0.2 µm-filtered DPBS and 500 µL fractions were collected. Fractions 7–9 were subsequently pooled together for analysis. The column flow rate was ~0.8–1.2 µL min−1, with 500 µL DPBS buffer manually maintained on top of the column.
2.3 30 µL of platelet-depleted plasma was added to 5 µL of reagents and 265 µL of DPBS, resulting in a 10-fold dilution. This 10-fold dilution was then serially diluted six times, with 150 µL of sample added to 150 µL of DBPS in a 96-well polypropylene plate (Corning). All wells were measured with the fifth serial dilution (320-fold dilution) in the series used for calculating EV concentration in the starting material. 3.1 A buffer-only control of 0.1 µm-filtered DPBS was recorded at the same flow cytometer acquisition settings as all other samples, including
triggering threshold, voltages, and flow rate. The buffer-only control had a count of ~100 events s−1.
3.2 A buffer with reagent control (0.25 µg mL-1 anti-human CD41a mouse-IgG1κ-PE (Clone: HIP8, Manufacturer: BioLegend, Cat No. 303,706, Lot No. B250952) was recorded at the same flow cytometer acquisition settings as all other samples, including triggering threshold, voltages, and flow rate. This control was serially diluted 6 times, with 150 µL of buffer with reagent added to 150 µL of DBPS to allow comparisons between serially diluted stained samples. Buffer with reagent controls had an event rate of ~100 events s−1and were therefore not changed from the buffer-only control.
3.3 Unstained controls were measured at the same dilution as matched stained and isotype controls. Flow cytometer acquisition settings were maintained for all samples, including triggering threshold, voltages, and flow rate. The event rate of unstained controls differed by <5% from isotype controls. No substantial changes in scatter or fluorescence signals were observed between unstained and matched isotype controls.
3.4 Isotype controls were used at the same concentration as matched stained controls and were recorded at the same dilution as matched stained and unstained controls and stained samples. Please seeTable 3for further reagent information. Flow cytometer acquisition settings were maintained for all samples, including triggering threshold, voltages and flow rate. No substantial changes in scatter or fluorescence signals were observed between unstained and matched isotype controls.
3.5 vFRed (Cellarcus Biosciences) and anti-human CD41a mouse-IgG1κ-PE (BioLegend) single-stained controls for a reference set of samples were analysed to aid compensation of anti-human CD41a mouse-IgG1κ-PE into the vFRed channel when excited by the 488 nm laser. 3.6 Excess antibody was reduced by further purification of the stained EVs using SEC columns (qEV Original, Izon Science), with fractions 7–9
collected for analysis. To assess whether this step caused artefacts, 500 µL of each control sample (buffer alone, buffer with reagent, unstained, and isotype controls) was run through a SEC column with 500 µL fractions (7–9) collected for analysis. These SEC processed samples were compared to a sample of unprocessed buffer alone, buffer with reagent, unstained sample, isotype sample, and stained sample to demonstrate the removal of antibody with no artefacts being introduced from the procedure.
3.7 Samples were serially diluted six times, with 150 µL of sample added to 150 µL of DBPS and measured using a 96-well polypropylene plate (Corning). The 4th, 5th and 6th dilutions showed a linear decrease between dilution factor and measured particle count over one minute. The median fluorescence and scatter intensity of all events for dilutions 4, 5 and 6 were maintained at 500 ± 18 PE molecules of equivalent soluble fluorophore (MESF; SeeComponent 4.3 for MESF calibration), and 3000 ± 31 side scatter arbitrary units, respectively. Dilutions 1–3 did not show a linear correlation between dilution factor and measured event count, nor were their fluorescence and scatter intensity maintained. The fifth serial dilution (320-fold dilution) in the series was therefore used to calculate EV concentration and report immunostaining data.
3.8 Stained samples, diluted 320-fold, were treated with 0.1% Triton X-100 for 5 min at 21°C to test the lability of vFRed and CD41a-PE stained events. These measurements were used to compare vFRed and PE stained samples not treated with detergent. vFRed and CD41a-PE positive events decreased 87% ± 9% upon treatment with 0.1% Triton X-100 for 5 min.
4.1 Based on the buffer alone control (Component 3.1), detection was triggered on the 488 nm laser excited PE-Texas Red channel (630/30 bandpass filter) at a threshold of 500 arbitrary units, equivalent to ~50 PE-Texas Red MESF, determined using Spherotech Rainbow beads and the manufacturer’s calibration values (see Component 4.3 flor fluorescence calibration). The buffer alone control (Component 3.1) had an event rate of ~100 events s−1.
4.2 Samples were enumerated using the integral instrument flow rate sensors, resulting in a flow rate of 10 µL min−1. This was calibrated using weighed volumes of deionized water prior to analysis.
4.3 Arbitrary PE fluorescence scale units (channel number), excited by the 561 nm laser and collected using a 586/15 bandpass filter, were converted to MESF units using PE Quantibrite beads (Becton Dickinson, Cat. 100,001, Lot. L1000001). Least-squares regression was performed between log10-transformed values of PE-A intensities versus bead PE MESF units (provided by manufacturer) using the 3
dimmest bead populations. The resulting regression showed a high correlation with an R2value of 0.99, with a slope of 0.931 and intercept of 1.345.
Report
State any steps relating to the washing of samples.
Sample dilution Rationale
The concentration of EVs in the starting material (body fluid, culture media) is a highly reported statistic from EV-FC data but is affected by sample dilution. Sample dilution can occur from the addition of buffers, reagents and wash steps. Accounting for all dilution steps that occurred from sample collection to analysis is therefore crucial.
Report
All methods and steps relating to sample dilution.
Assay controls
Due to the unique challenges of EV-FC several controls may be required that are typically not used when analysing cells or other micron-sized particles. We
recommend reporting whether the following controls have been included in an experiment: buffer alone, buffer with added reagents but without EVs, proce-dural controls, detergent-treatment of samples and demonstration of single particle detection.
Buffer-only Rationale
Flow cytometer background noise depends on several factors across the instrument’s optics, electronics and fluidics. The acquisition of a buffer-only control provides a measure of the instrument’s background event rate at the same settings used to analyse EV samples and further controls [10]. Flow cytometers tend to use water or buf-fered saline solution as sheath buffer. Differences between sample solution and sheath buffer can contribute to back-ground in flow cytometric analysis [11]. The effects of sample solution on background signals are well known in cellular FC, for example analysis of cells in media solution containing phenol red, can contribute to elevated fluores-cence and may interfere with the analysis of “staining”
Table 2.(Continued).
Component Brief example
4.4 Side scatter calibration was performed using Mie modelling software, taking into account the wavelength (405 nm) and polarization state (perpendicular to detection) of the laser, the light collection geometry (side scatter, numerical aperture 1.2), and the particle diameter and refractive index. Least square fitting was used to relate the median signal of each National Institute of Standards and Technology (NIST)-traceable polystyrene bead population to the theory, resulting in a linear scaling factor of 11.3 and an R2of 0.99. The limiting side scatter collection angle range of the instrument was determined to be 38-142°, based on the flow cell dimensions. Scatter calibration was shown by plotting modelled vs acquired polystyrene bead data.
5.1 EV diameter was approximated using the fluorescence intensity of a membrane intercalating dye; vFRed. The vFRed cytometer collection channel was calibrated using vFRed-stained liposomes of known population diameter (median 100 nm, range ~50–150 nm) and surface area distributions, determined using nanoparticle tracking analysis (NTA) and resistive pulse sensing (RPS). To calibrate flow cytometer fluorescence intensity in terms of equivalent surface area, a least-squares linear regression was performed between the liposome population surface area and vFRed fluorescence intensity distributions.
5.2 Particle refractive index was derived from the ratio of side and forward scatter signal (i.e. Flow-SR). NIST traceable polystyrene beads with known size and refractive index (Exometry, Netherlands) were used to create a mathematical model of the optical configuration of the flow cytometer using FCMPASSsoftware. Using this model, a Flow-SR versus diameter lookup table was calculated, which allows
determination of the particle diameter from the measured Flow-SR. The determined diameter was subsequently used to derive the refractive index from a lookup table of side scatter versus diameter. Lookup tables were calculated for diameters ranging from 10 to 1000 nm, with step sizes of 1 nm, and refractive indices from 1.35 to 1.80 with step sizes of 0.001.
5.3 Anti-mouse antibody capture beads (ABC) (Quantum simply cellular, Bangs Laboratories, Cat No. 100,001, Lot No. L1000001) were incubated with 5 µL of 25 µg mL−1anti-CD41a mouse-IgG1κ-PE (Clone: HIP8, Manufacturer: BioLegend, Cat No. 303,706, Lot No. B250952) for 15 min at 20°C and protected from light. The PE channel units were converted to ABC units by performing regression between PE-A and ABC number using the 3 dimmest bead populations. Regression showed a high correlation with an R2value of 0.99.
6.1 The MIFlowCyt checklist v1.0.0 has been completed and attached in the Supplementary Information.
6.2 The median intensity of the unstained EV population was 200 PE MESF units. The maximum channel number (218), when scaled to MESF, was 592,435 PE MESF units. Positive events on PE were assumed to be two standard deviations above the unstained EV population, 240 PE MESF units. The detection range of the PE channel used for PE-positive events was therefore 320 to 592,435 PE MESF units. 6.3 The detected concentration of CD41a-PE positive EVs between calibrated detection range (240 and 592,435 PE MESF units) was 5.62 × 10⁸
particle mL-1. Flow cytometer acquisition settings were maintained for all samples, including triggering threshold, voltages and flow rate. 6.4 EV brightness was compared using the median (25th, 75thpercentile) PE MESF intensity, due to the non-parametric distribution of EV
staining. Unstained platelet-derived EVs from healthy patients and T2DM patients had a median fluorescence intensity of 240 (290, 120) PE MESF. CD41a-positive platelet-derived EVs from healthy patients had a median fluorescence intensity of 535 (800, 205) PE MESF units. CD41a-positive platelet-derived EVs from T2DM patients had a median fluorescence intensity of 560 (890, 250) PE MESF units. 7.1 FC files and the analysis workspace have been uploaded FlowRepository and can also be obtained by contacting the corresponding author. This example is of a hypothetical experiment. The WG does not currently believe there exists a“gold-standard” methodology or endorse any particular
purification methods, reagents, assays or equipment. At the time of publication, no literature exists on the described hypothetical experiment. This hypothetical experiment was designed purely to require that every component of the framework be utilized and need a moderate level of detail. In many assays, every component of the framework may not need to be completed in detail if it is not relevant to the assay. In the case of a component not be relevant to an assay, a brief explanation as to why any specific component was not required should be reported. This completed example is purely a reference to the type of details that are relevant for each component and to the extent they should be discussed.
with a fluorophore that has spectral overlap. When ana-lysing small particles at the limits of a flow cytometer’s sensitivity, it is important to provide a reference of the recorded event rate from a sample which contains only the buffer used for diluting EV-containing samples. Report
State whether a buffer-only control was analysed at the same settings and during the same experiment as the samples of interest. If utilized it is recommended that all samples be recorded for a consistent set period of time, for example 5 min, rather than stopping analysis at a set recorded event count, for example 100,000 events. This allows comparisons of total particle counts between controls and samples.
Buffer with reagents Rationale
To demonstrate if the background signal is altered, for example buffer with reagent control shows events that appear positive for fluorescence and light scatter in the absence of EV-containing samples. This control is a direct comparison to the buffer-only control (Component 3.1). The appearance or change of a population allows the identification of reagent-related effects that could affect the analysis of EV-stained samples [12]. When unbound labels or aggregates of labels are not removed, some instruments are able to detect the signal of these mole-cules which may be artifactually interpreted as EVs [10,13–15].
Report
State whether a buffer with reagent control was ana-lysed at the same settings, same concentrations and during the same experiment as the samples of interest. If used state what the results were.
Unstained controls Rationale
Unstained controls provide an estimate of the background events and/or signal that may be expected with isotype and/or stained samples. These controls are a useful tool to compare between other samples and controls for the event rate, signal intensity and gating strategies.
Report: State whether unstained control samples were analysed at the same settings and during the same experiment as stained samples. If used, state what the results were, preferably in standard units.
Table 3. Summary of reagents used for FC experiments. Characteristic(s) being measured Analyte Analyte detector Reporter Isotype Clone Final concentration Manufacturer Cat. number Lot number Lipid Membrane Lipid membrane vFRed vFRed NA NA Staining = 1x Serial Dilution 5 = 0.064x Cellarcus Biosciences CBS4 190,415 Cell surface protein Human CD41a Anti-human CD41 antibody PE Mouse IgG1 κ HIP8 Staining = 0.25 µg mL-1, Serial Dilution 5 = 0.016 µg mL − 1 BioLegend 303,706 B250952 Non-specific binding of antibody NA NA PE Mouse IgG1 κ MOPC-21 Staining = 0.25 µg mL-1, Serial Dilution 5 = 0.016 µg mL − 1 BioLegend 400,112 B227349
Isotype controls Rationale
The effect of isotype controls compared to unstained controls and stained samples can provide a useful method of identifying confounding effects related to antibody specificity. Along with the buffer with reagent control and procedural controls, isotype controls may also helpful to identify false-positive expression of mar-kers due to the presence of high-amounts of unbound antibodies [16].
Report
The use of isotype controls is applicable to immuno-fluorescence labelling only. State whether isotype con-trols were analysed at the same settings and during the same experiment as stained samples. If utilized, state which antibody they are matched to, the concentration used and what the results were (Component 4.2, 4.3, 4.4). Due to conjugation differences between manufac-turers if should be stated if the isotype controls are from the same manufacturer as the matched antibodies.
Single-stained controls Rationale
FC experiments often use multiple fluorescent reagents. Therefore, it is important to be able to assess whether a fluorescent reagent’s spectrum is affecting the mea-surements in the detection parameter of another fluor-escent reagent. Single stained controls may also be useful for compensation, validating compensation by other means such as compensation beads, or identify-ing potential confoundidentify-ing factors from stainidentify-ing, for example fluorescence quenching.
Report
State whether single-stained controls were included. If used state whether the single-stained controls were recorded using the same settings, dilutions and during the same experiment as stained samples and state what the results were, preferably in standard units (Component 4.2, 4.3, 4.4).
Procedural controls Rationale
Some staining methods require further purification/ processing after labelling of EVs to remove excess dye [10,14,15,17]. In these cases, including procedural con-trols can show that no artefacts were introduced into the sample during post-staining processing. Procedural
controls would include the same buffer-only and buffer with reagent(s) controls (Component 3.1 and Component 3.2) butprepared according to the proce-dure used to further purify/process the stained samples. These controls can then be compared to controls from Component 3.1and Component 3.2 to show that the further purification/processing steps did not produce artefacts. Examples of post-staining purification/pro-cessing method that may require procedural controls include ultracentrifugation, density gradient flotation, (ultra)filtration and size-exclusion chromatogra-phy (SEC).
Report
State whether procedural controls were included. If used, state the procedure and if the procedural controls were acquired at the same settings and during the same experiment as stained samples.
Serial dilution Rationale
Serial sample dilution can assist with the evaluation of whether EVs are being detected as single particles. This is to avoid coincidence detection, also known as “swarm detection”, whereby multiple particles are present in the illuminated region of the core stream and their combined light scatter and fluorescence signals are merged into a single event [18]. Serial dilutions can also determine whether confounding factors such as background particles and unbound dyes/antibodies are affecting scatter or fluorescence signals. Serially diluting samples whilst maintaining a consistent fluorescence and/or scatter signal inten-sity and maintaining a linear particle count consistent with the dilution factor, have been used to in litera-ture to statistically demonstrate the detection of sin-gle-particles of interest [10,16,19–22]. Further gating strategies can also be applied to avoid coincidence detection.
Report
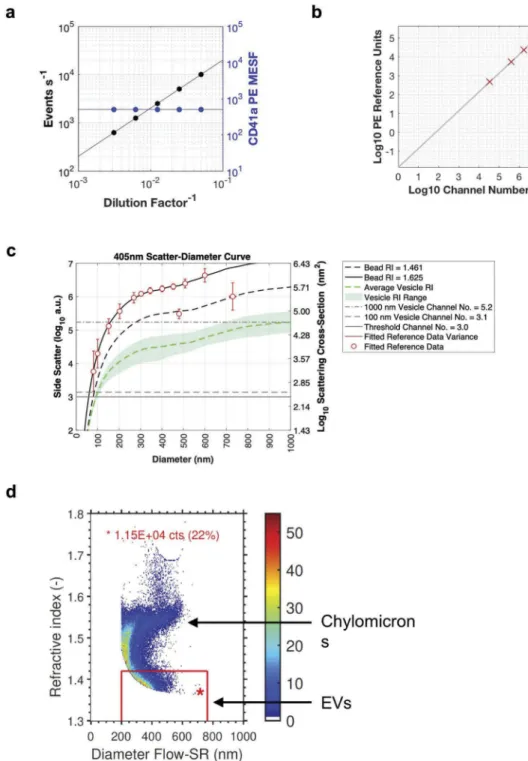
State whether serial dilutions were performed on sam-ples and note the dilution range and manner of testing. The fluorescence and/or scatter signal intensity would ideally be reported in standard units (see Component 4.3, 4.4) but arbitrary units can also be used. These data are best reported by plotting the recorded number events/concentration over a set period of time at dif-ferent sample dilution. The median fluorescence inten-sity at each of the dilutions should also ideally be plotted on the same or a separate plot. An example is shown inFigure 3(a).
Detergent-treated EV samples Rationale
Detergent controls aid in determining whether detected events are membrane-enclosed vesicles or other protein complexes. Complexes can be present when measuring heterogeneous samples such as plasma and serum, or when using reagents are used that may cause precipita-tion, such as calcium phosphate. Detergent-treatment will lyse membrane-enclosed vesicles, reducing their number and signals. Detergent resistant particles, such as protein complexes or other particulates, will persist following detergent lysis, thereby allowing dif-ferentiation from EVs [20,23–25].
Report
State whether samples were detergent treated to assess lability. If utilized, state what detergent was used, the end concentration of the detergent and what the results were of the lysis.
Instrument calibration and data acquisition
Flow cytometers have numerous operating parameters that will affect the measured events. Completing the MiFlowCyt checklist in Component 1.2 of this report-ing framework covers the reportreport-ing of many of these parameters. However, some flow cytometer parameters are conventionally set and reported in arbitrary units. To support the comparison and validation of data between experiments, instruments, laboratories and institutions, this section provides the components and rationale for reporting the settings and readouts of flow cytometers in standard units. Here, calibration refers to the conversion of arbitrary units into standard units. This relies upon interpolation and extrapolation of signals from reference particles, as summarized and referenced below. This is distinctly different from instrument configuration whereby beads may be ana-lysed to find optimal detection settings.
Trigger channel(s) and threshold(s) Rationale
Instrument trigger and threshold parameters are criti-cal in defining the instrument is and is not able to detect, and therefore the data collected for analysis. For EV-FC experiments to be reproduced, similar trig-ger and threshold settings are required, and for differ-ent investigators to reproduce these settings on different instruments, it is necessary for the settings to be able to be approximated based on standardized metrics. The reporting of trigger(s) and/or threshold(s)
is an integral element of the MIFlowCyt reporting guidelines for all FC experiments.
Report
The trigger channel(s) and threshold(s) used for event detection. Preferably, the fluorescence calibration (Component 4.3) and/or scatter calibration (Component 4.4) should be used in order to report the trigger channel(s) and threshold(s) in standardized units.
Flow rate/volumetric quantification Rationale
Calculation of the EV concentration requires a known flow rate. However, because the adjusted flow rate may deviate from the actual flow rate, it is good practice to measure the flow rate periodically. Methods for flow rate determination depend on the flow cytometer. There are various methods for monitoring flow rate, including counting beads, weighing samples before and after acquisition and integral instrument flow rate sen-sors [26,27].
Report
State if the flow rate was quantified/validated and if so, report the result and how they were obtained.
Fluorescence calibration Rationale
Flow cytometers differ in their fluorescence sensitivity and dynamic range. A number of factors can lead to changes to an instruments sensitivity and dynamic range over time and therefore results in differences between experiments. Due to differences between instru-ment sensitivities, EVs may be identified as positive on one instrument, but appear negative on another instru-ment. In order to accurately compare data between flow cytometers, whose axes are in arbitrary units, a calibration must be performed to convert data from arbitrary to standard measurement units. Calibrating fluorescence scales from arbitrary units into standardized units for reporting provides improved comparisons of results between different experimental protocols and instruments with different sensitivities and differing experimental protocols [10,16,25,28]. Fluorescence cali-bration is relatively simple to perform with protocols and reagents available from multiple manufacturers and most commercially available cytometry software capable of performing it. Put simply, the known fluorescent values of each bead population are plotted against their arbi-trary unit intensity and a regression line is drawn
through these points. The slope and intercept of the regression line are then used to convert the arbitrary values to a calibrated scale. A number of common fluor-ophores are available with molecules of equivalent solu-ble fluorophore (MESF) beads. In the absence of MESF bead availability for a specific fluorophore, it is possible to use beads with a known binding capacity for IgG (antibody bound per cell (ABC) beads) which capture the conjugated antibody being used standardized in the assay. In cases where it is not possible to use MESF or ABC beads (such as membrane dyes), equivalent refer-ence fluorophore (ERF) beads can be used. These beads have a broad emission spectrum and can standardize work on cytometers using the same filter sets. However, ERF beads are less accurate than MESF or ABC beads but are a useful method to approximate fluorescent mea-surements in a standard manner.
Report
State whether fluorescence calibration was implemen-ted, and if so, report the materials and methods used, catalogue numbers, lot numbers and supplied reference units for the standards. Fluorescence parameters may be reported in standardized units of MESF, ERF or ABC beads. The type of regression used and the result-ing scatter plot of arbitrary data versus standard data for the reference particles should be supplied. An example plot is shown inFigure 3(b).
Light scatter calibration Rationale
Light scatter signals are complex to standardize across different FC platforms. This is because the amount of light scatter detected from any given particle is depen-dent on a number of variables, including its diameter, its composition and refractive index, the refractive index of the suspension medium and the range of angles and geometry of light collected by a FC platform [18]. Due to these differences, the use of polystyrene beads alone does not result in a calibrated scatter detector, nor can it be used to compare instrument resolution and sensitivity for particles other than polystyrene beads. Thus, a gating strategy based on polystyrene beads alone is not a sound standardization methodology [18,29]. The calibration of any scattering channel (FSC, SSC, MALS, etc.) from arbitrary units to standard units requires the use of Mie modelling software [18,22,30–32]. Light scatter calibra-tion provides informacalibra-tion that is essential for any cross-platform interpretation and will allow reproducibility of EV measurements performed on instruments with dif-ferent optical configurations and settings. The use of modelling also provides a method of displaying
instrument light scatter sensitivity independently or refractive index (Figure 3(c)) [18,22,31,32].
Report
State whether and how light scatter calibration was implemented. Light scatter parameters may be reported in standardized units of nm2, along with information required to reproduce the model.
EV characterization
A number of EV characteristics can potentially be inferred from FC data, including diameter, refractive index and number of epitopes. Understanding the deri-vation of EV characteristics requires expertise as well as specific controls. Currently, the majority of the EV-FC-WG, as referees, would not expect these characteriza-tions to be performed in all or most manuscripts (Figure 2). If performed, however, these advanced deri-vations should be reported as follows.
EV diameter/surface area/volume approximation Rationale
The determination of EV diameter provides a method of normalizing data between experiments and having a quantification of instrument sensitivity. This has been demonstrated using Mie modelling of one scatter detector, by calibrating the ratio between side and forward scatter and by surface area approximation using fluorescence [24,25,30,31,33].
Report
State whether and how EV diameter, surface area and/ or volume have been calculated using FC measurements.
EV refractive index approximation Rationale
The determination of refractive index may indicate differences in EV composition (protein vs. lipid levels, cargo) or allow a method for defining gates for EV analysis or exclusion of events from analysis. Refractive index approximation using data from FC instruments has been demonstrated for EVs larger than 200 nm using the flow cytometry scatter-ratio (Flow-SR) methodology (Figure 3(d)) [33] and multi-angle scattering detection [34].
Report
State whether the EV refractive index has been approximated and how this was done.
EV epitope number approximation Rationale
EV epitope number may provide an insightful method of normalizing data between experiments. This differs from EV brightness in MESF/ERF/ABC units as it must account for further variables such as antibody valency, avidity, clone and conjugation [35,36].
Report
State whether EV epitope number has been approxi-mated, and if so, how it was approximated.
FC data reporting
Most EV-FC experiments are performed to determine what markers can be detected on individual EVs and what the concentration of those EVs is in a sample. In order to ensure that these measurements can be reproduced across labora-tories that are using different instruments with different configurations and settings, it is important that the data from these experiments are presented in a way that is standardized. These standardized measurements will, in
turn, help the research community compare available cyt-ometers and protocols for EV analysis.
Complete MIFlowCyt checklist Rationale
The MIFlowCyt checklist was developed in order to pro-vide a standardized method of reporting experimental and flow cytometer parameter pertinent to the experi-ment interpretation and reproducibility. These include the reporting of instrument settings such as laser power, detector settings and filter sets. It should be noted that many instrument settings are automatically saved to the“. fcs” -files that are generated by flow cytometers. FC soft-ware analysis packages also have built-in functions to record MIFlowCyt checklist parameters to the experi-ment workspace, which in turn can also be uploaded to public repositories such as FlowRepository. When uploaded to public repositories such as FlowRepository which read each“.fcs”-file, instrument settings are also imported and are therefore easily accessible [3,37]. Report
Complete MIFlowCyt checklist components 1 to 4 using the MIFlowCyt guidelines.
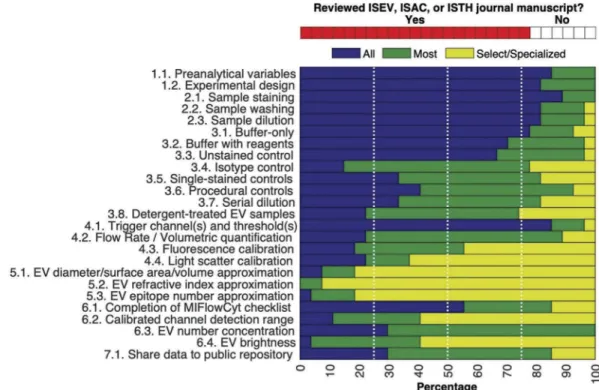
Figure 2.Summary of a poll about what extracellular vesicles (EV) flow cytometry (FCM) working group (WG) members expect to be reported in scientific manuscripts on EV-FC. The top chart shows the number of working group members who have experience reviewing manuscripts from the ISEV, ISAC, ISTH journals (red) and those that have not (white). The bottom bar graph summarizes the personal expectations of all co-authors regarding components to be reported in EV-FC manuscript published in ISEV, ISAC and ISTH journals. The expectations fall into categories of all (blue), most (green) or select/specialized (yellow) manuscripts.
Calibrated channel detection range Rationale
Flow cytometers have a limited dynamic range and are therefore only capable of detecting signals between
a set range. Stating the lower and upper limited of the detection channel range is a method of normalizing data between instruments with different sensitivity limits.
Figure 3.(a) Example plot of reporting serial dilutions data, with event count per second on the left y-axis, median PE MESF intensity of the recorded data on the right y-axis and the dilution factor on the x-axis. (b) Example plot of reporting fluorescence calibration using regression. The fluorescent intensity in arbitrary units (channel number) is on the x-axis with the related fluorescence population reference units on the y-axis. (c) Example plot of light scatter calibration at 405 nm using FCMPASSsoftware default values. (d) Example plot of refractive index and diameter determination using Flow-SR. methodology.
Report
If fluorescence or scatter calibration has been carried out, authors should state whether the upper and lower limits of a calibrated detection channel were calculated in standardized units. This can be done by converting the arbitrary unit scale to a calibrated scaled, as dis-cussed in Component 4.3 and 4.4, and providing the highest unit on this scale and the lowest detectable unit above the unstained population. The lowest unit at which a population is deemed“positive” can be deter-mined a variety of ways, including reporting the 99th percentile measurement unit of the unstained popula-tion for fluorescence. The chosen method for deter-mining at what unit an event was deemed positive should be clearly outlined.
EV number concentration Rationale
Due to flow cytometers having a varying sensitivity and a limited detection range (Component 6.2), only a portion of the full EV population may be detected. Reporting concentration as a number of detected EVs between a calibrated detection range enables standar-dized reporting and makes data reproducibility and validation possible. This detection range can take the form of MESF units, scattering units (nm2), diameter, or others [38]. Due to cytometers being unable to differentiate between very dim and negative popula-tions percentages should not be used to quantify EVs using immunophenotyping.
Report
State whether EV number/concentration has been reported. If calculated, it is preferable to report EV num-ber/concentration in a standardized manner, stating the number/concentration between a set detection range.
EV brightness Rationale
Using calibrated units to report the fluorescence and/or scatter signals as statistical summaries, histograms, or scatter plots, provides a standardized reporting method that makes data reproducibility and validation possible. Report
When applicable, state the method by which the brightness of EVs is reported in standardized units of scatter and/or fluorescence.
FC data sharing
Scientific publications have limited space for extensive figures and both journals and scientists tend not to publish many control data points. It is however impor-tant as a reader or reviewer to be able to inspect the quality of data acquisition and particularly the experi-mental controls (described in Category 3), when inter-preting a piece of published work.
Share data to public repository Rationale
Public access to published data allows other researchers to inspect control and acquired sample data. Public access to data has been found to improve the reporting accuracy in manuscripts and provides important transparency for referees and readers of published work. For these reasons many funding agencies require public release of data. All human subject’s data with Personally Identifying Information (PII) must be deidentified prior to collection or data deposition. FlowRepository was developed in tandem with the MIFlowCyt guidelines as a public data repository to support open access of data from published and unpublished work and aids the completion of the MIFlowCyt components (Component 1.2, Component 6.1) by archiving data from the FC“.fcs”-files [37]. Data repositories tailored to EV-FC data are yet to be devel-oped, but standard format (FC) data may be deposited at a number of data repositories (FlowRepository, Immport, Mendeley, Zenodo, figshare, etc.).
Report
Provide a link to the experimental data in a public data repository.
Broadly applicable experimental components of MIFlowCyt-EV
While this work aims to outline a standard reporting framework rather than set guidelines, it is clear that some components of the MIFlowCyt-EV framework are important to utilized and reported in the majority of single-EV analysis experiments regardless of design or instrumentation. These include components 1.1, 1.2, 2.1, 2.2, 2.3, 3.1, 3.2, 3.3, 3.5, 3.7, 4.1, 4.2, 4.3 and 6.1, as highlighted inTable 1 andFigure 1. The use of com-ponents 3.4 and 3.6 should also be seen as a necessity should antibody staining, or post-stain wash methods be utilized, respectively. While the other components are still applicable, the other framework components have different degrees of importance, depending on the experimental objectives and design and on the scope of
claims that are based on the reported EV FC results. For example, Component 5.1 is not relevant if work does not describe the detection limit of an instrument using diameter related claims. However, if a piece of work does make conclusions about the limit of an instrument detection using size-related claims, Component 5.1should be addressed.
Discussion
In the course of attempting to execute two sequential ISEV-ISAC-ISTH EV FCM WG Standardization Studies, with standards and samples distributed to 12–18 WG laboratories worldwide, we found that, even among EV FC groups that are at the forefront of the EV FC research field, we were not able to define a consensus guidelines for the best methods, instru-ments, controls and analytical tools to use for a simple set of reference samples. However, the WG did arrive at a consensus regarding what information would assist with the interpretation and reproducibility of results across different platforms, sample types and methods. This consensus is reflected in the MIFlowCyt-EV Framework for reporting EV FC studies.
The MIFlowCyt-EV framework stems from several years of collaborative work by an international group of researchers working together in the ISEV-ISAC-ISTH EV-FC WG. While an implied goal of these efforts is the comparison of methods and technologies for EV measurement, it quickly became clear that more complete and uniform reporting of assay methods and results would be required for this to be possible, since most members employ a diverse range of instruments and assay designs to measure a common set of repre-sentative EV samples. However, the ISEV-ISAC-ISTH EV-FC-WG also realized the importance of developing such a framework by consensus. Presentations, discus-sions and workshops taking place at the ISEV, ISAC and ISTH annual conferences have been fundamental to its development.
A poll of the active participants of the EV-FC-WG provided insight into the level of current consensus on the necessity of reporting/carrying out each of the frame-work components regardless of the EV-FC experiment being reported. This poll was not a reflection of the frame-work itself, as it was fully agreed upon by all members of the WG. The poll was instead a method to stratify the current experimental expectations of the field which was not addressed in this work. The group voted unanimously that preanalytical variables and experimental design (Category 1) should be reported in all or most manu-scripts. More than 95% of the group voted that sample preparation steps (Category 2) should be reported in all or
most manuscripts. The reporting of assay controls (Category 3) was voted to be expected in all or most EV-FC manuscripts by >80% of the WG members, with the exceptions of isotype (Component 3.4) and detergent controls (Component 3.8), which were 77% and 74%, respectively. The poll showed varied expectations for reporting of instrument data acquisition and calibration components (Category 4). The reporting of trigger channel(s) and threshold(s), and flow rate/volumetric quantification was expected to be reported in all or most EV-FC manuscripts by≧88%, while fluorescence calibra-tion and scatter calibracalibra-tion were voted for in all or most EV-FC manuscripts by 55% and 37%, respectively. The reporting of EV characterization (Category 5) in terms of diameter, refractive index and epitope number using FC was the least expected information to be required in all or most EV-FC manuscripts, voted for by ≦20%. The poll showed that the expectation for reporting of FC data (Category 6) components in all or most EV-FC manu-scripts was varied, with EV concentration reporting unan-imously expected, the completion of the MIFlowCyt checklist (85%), and the calibration of detection channel range along with reporting EV brightness expected in all or most manuscripts by 41% of the participants. Finally, the sharing of FC data (Category 7) was expected to be reported by 88% of the WG.
In summary, the majority (>50%) of WG authors would expect details pertaining to 19 of 25 framework compo-nents to be conducted/reported in manuscripts using single EV-FC, with >75% consensus on 17 of 25 of the framework components. The MIFlowCyt-EV components that the majority of WG authors would currently only expect to be conducted and reported in select/specialized manu-script, are those that utilize relatively advanced protocols and understanding, such as light scatter calibration (Component 4.4), detection channel calibration (Component 6.2), EV characterization (Component 5.1, 5.2, 5.3) and reporting of EV brightness (Component 6.4). While these topics are critical for future standardization, they are areas that involve the development of new techni-ques and where more tools, teaching and validation studies may be required before becoming widely utilized. The WG authors in this manuscript have outlined a set of compo-nents that should be broadly considered for all single-FC experiments, regardless or instrument or assay and feel the utilization of these components will aid in the development of more standardized small particle literature.
MIFlowCyt-EV has been developed specifically for the reporting of single EV-FC experiments and are generally applicable to other small particles, for example viruses. A future framework aiming at alternative bulk-EV analy-sis methods using FC, such as capture-bead assays, may also be useful. Due to the EV-field being in its infancy, the
MIFlowCyt-EV is not yet exhaustive and will likely be adapted and updated in time as the field progresses. The utilization of this reporting framework will be key in the development of: (i) standard operating procedures, (ii) reference materials (iii) and validation studies. The devel-opment of each of these is required to advance the field and further improve standardization efforts and will be supported by this WG. More information on the ISEV-ISAC-ISTH EV flow cytometry WG updates and resources can be found at:www.evflowcytometry.org.
Acknowledgments
● JAW is an International Society for Advancement of Cytometry (ISAC) Marylou Ingram Scholar 2019-2023.
● RN, FC, EvdP, LdR acknowledge funding from the Netherlands Organisation for Scientific Research-Domain Applied and Engineering Sciences (NWO-TTW), research programmes VENI 13681 (FC) and VENI 15924 (EvdP) and STW perspectief CANCER-ID 14195 (LdR).
● IG acknowledges NIH-U01-OD-019750; NIH-R01 CA218500; NIH U01-HL126497; NIH UG3 TR002881.
● AG is an International Society for Advancement of Cytometry (ISAC) Marylou Ingram Scholar 2019-2023.
● AH and ODW are supported by Fund for Scientific Research (FWO), Foundation against Cancer (STK), Stand up to Cancer (KOTK) and Special Research Fund Ghent University (BOF).
● SFWML was supported by the Dutch Technology Foundation STW (Perspectief Program Cancer ID, project 14191), which is part of the Netherlands Organization for Scientific Research (NWO) and which is partly funded by the Ministry of Economic Affairs.
● ELA is supported by the European Union’s Horizon 2020 Research and Innovation Programme under the Marie Skłodowska-Curie grant agreement No. 722148 (TRAIN-EV).
● JN acknowledges NIH R01 EB003824, UH3 TR000931; UH3 TR000891; UH3 TR000903.
● JCJ, JAW and AMK were supported by the Intramural Research Program of the National Institutes of Health (NIH), National Cancer Institute and Center for Cancer Research.
● JCJ acknowledges NIH ZIA BC011502, NIH ZIA BC011503, NIH U01 HL126497, NIH R01
CA218500, NIH UG3 TR002881 and the Prostate Cancer Foundation.
Declaration of Interest Statement
● MB, FDG, IG, BG, AH, RL, JL, SR, TT, JT, OdW declare no conflict of interest.
● The Wauben research group (MHMW, GJAA, SFWML, ELA), Utrecht University, Faculty of Veterinary Medicine, Department of Biochemistry and Cell Biology had a collaborative research agree-ment with BD Biosciences Europe, Erembodegem, Belgium, to optimize analysis of EVs with the BD Influx.
● AB is founder and CEO of Exo-Analysis
● AG is an inventor on patents and patent applica-tions related to EV analysis, and is consultant for and has equity interest in Evox Therapeutics Ltd., Oxford, UK.
● FC and EvdP are co-founder and stakeholders of Exometry B.V.
● AMC (RN, EvP, FC, LdR) and BD Biosciences Europe, Erembodegem, Belgium have a collaboration in research program STW per-spectief CANCER-ID.
● JPN and ED are inventors on patents and patent applications related to flow cytometry and have a financial interest in Cellarcus Biosciences, which offers vesicle analysis products and services.
● NCI holds a collaborative research and development agreement (CRADA) with Beckman Coulter.
● NCI authors, JCJ, AMK and JAW, are inventors on NCI patents and patent applications related to EV analysis.
● XY declares competing financial interests as a co-founder of NanoFCM Inc.
Funding
Supported by the Foundation for the National Institutes of Health [Pamela Cafritz Renal Cell Carcinoma Award]; National Cancer Institute [1ZIA-BC011502]; National Institutes of Health [NIH UG3 TR002881]; Netherlands Organisation for Scientific Research [STW perspectief CANCER-ID 14195]; ISAC [Mary Lou Ingram Scholar]; Netherlands Organisation for Scientific Research [VENI 15924]; Netherlands Organisation for Scientific Research [VENI 13681]; ISAC [Marylou Ingram Scholar]; FWO Fund for Scientific Research; NIH [U01-126497; U01-OD -019750; R01 CA218500; R01 HL1266497; NIH UG3 TR002881]; Prostate Cancer Foundation [YIA].