Design of Bulk Nanocrystalline Tungsten Alloys
via Nano-Phase Separation Sintering
MASSACHUSETTS INSTITUTE
by OF TECHNOLOLGY
JUN 17
2015
Mansoo ParkB.S., Materials Science and Engineering
LIBRARIES
Seoul National University, 2010
Submitted to the Department of Materials Science and Engineering in Partial Fulfilment of the Requirements for the Degree of Doctor of Philosophy in Materials Science and Engineering
at the
MASSACHUSETTS INSTITUTE OF TECHNOLOGY February 2015
0 2015 Massachusetts Institute of Technology. All rights reserved.
Signature redacted
Signature of Author: ... ...
Department of Materials Science and Engineering January 16, 2015
Signature redacted
C ertified by :...Christopher A. Schuh nd Vasilis Salapatas Professor of Metallurgy
/L
7/47Thesis SupervisorSignature redacted
A ccepted by:... ...
Donald Sadoway Chair, Departmental Committee for Graduate Students
Design of Bulk Nanocrystalline Tungsten Alloys
via Nano-Phase Separation Sintering
by
Mansoo Park
Submitted to the Department of Materials Science and Engineering on January 16, 2015 in Partial Fulfilment of the Requirements for the Degree of Doctor of Philosophy in Materials Science and Engineering
ABSTRACT
An accelerated sintering method called 'nano-phase separation sintering' is developed, with specific applicability to nanostructured tungsten alloys. Nanocrystalline tungsten alloys containing minority additions of chromium are produced by high-energy ball milling and then consolidated. Such alloys exhibit the onset of sintering at a very low temperature around 950 'C and a very rapid rate of densification. The mechanism of this accelerated sintering is established through understanding the role of nano-scale, solid second phase precipitation during the sintering cycle, as analyzed by thermomechanical analysis, electron microscopy and x-ray diffraction. In addition, control experiments are used to establish that the accelerated sintering is apparently accomplished from the combination of two features of the powders: (i) nanocrystallinity and (ii) alloy supersaturation. In addition to accelerating sintering, the incorporation of alloying elements and second phases are also beneficial for mitigating grain growth during a thermal cycle, so nano-phase separation sintering is thus naturally appropriate to the production of fine-grained bulk materials. Sintered compacts achieved through nano-phase separation sintering display 10~30 times smaller grain sizes at comparable densities than those produced by conventional accelerated sintering methods such as solid-state activated sintering and liquid phase sintering. The thermodynamic features and conditions for nano-phase separation sintering are further explored based on the binary phase diagram in order to generalize the concept to other alloy systems. After presenting a series of proposed alloy design rules, the consolidation of chromium with an addition of nickel is accelerated. Prospects of the technique for the development of full density bulk products in more complex alloy systems are also discussed.
Thesis Supervisor: Christopher A. Schuh
Acknowledgements
I would appreciate the members of my thesis committee, Professor Yet-Ming Chiang and
Professor Thomas Eagar for their guidance and insightful comments. I certainly believe that their comments have made my thesis stronger and more advanced.
I would like to specially thank my advisor, Professor Chris Schuh with my deepest respect for immeasurably encouraging and inspiring me. Before coming to MIT, I had been looking for an advisor whom I would admire personally as well as academically. I has been assured that he is the very one and I have always thought that I am blessed to accompany him throughout my Ph.D. journey. Although my four-year journey had not been easy and sometimes faced a big wave, I was able to overcome it and safely arrive the final destination thanks to his solid support and encouragement like a ballast to set up my central.
I am very grateful to all members in Schuh research group. They have been very kind and made my lab life so enjoyable. They have been always willing to help me out and given advice. I
learned a lot academically and personally from conversations I had with them. I would like especially thank to Tongjai who tough me everything related to experiments and research from the very beginning when I joined in this group to the end.
I would like thank KGMSE for their support and especially Donghun and Yongwoo who have enriched my life at MIT. I truly relished every moment of my life with them. And last but not least, I am forever grateful to my family for being always there for me.
Table of contents
A cknow ledgem ents ... 3
List of Figures... 6
List of Tables ... 9
C hapter 1 Introduction... 10
1.1 Tungsten sintering ... 10
1.2 Enhanced tungsten sintering... 11
1.2.1 Solid-state activated sintering ... 11
1.2.2 Liquid phase sintering ... 13
1.3 Nanocrystalline tungsten ... 15
1.3.1 Properties of nanocrystalline tungsten... 15
1.3.2 M ethodologies for the production of nanocrystalline tungsten ... 16
1.4 Research objectives and structure of thesis... 18
Chapter 2 Synthesis and Characterization of Nanocrystalline Tungsten Powders... 20
2.1 Synthesis and characterization procedures of powders ... 20
2.2 Nanocrystalline tungsten ... 22
2.3 Nanocrystalline W -Cr alloys ... 24
2.3.1 A lloying element selection... 24
2.3.2 Cr addition level and m illing tim e... 27
2.3.3 Particle and crystalline size ... 30
2.3.4 Supersaturation ... 33
2.3.5 Therm al stability...35
C hapter 3 N ano-Phase Separation Sintering... 41
3.1 Density and structure changes upon heating ... 41
3.2 Sintering mechanism and kinetics... 44
3.4 Comparison to conventional enhanced sintering... 56
3.4.1 Sintering mechanism ... 56
3 .4 .2 G ra in size ... 6 1 3.5 The effect of process variables... 63
3 .5 .1 M illin g tim e ... 64
3 .5 .2 C r co n ten t ... 6 6 3.6 Applicability to larger samples... 67
Chapter 4 G eneralization to Other System s... 69
4.1 Thermodynamic conditions for nano-phase separation sintering... 69
4.2 The Cr-Ni system ... 72
4.2.1 Characterizations of pre-sintering powders... 73
4.2.2 Characterizations of post-sintering bulk... 76
Chapter 5 Production of Nanocrystalline Bulk Tungsten Alloys ... 82
5.1 Stabilizer for suppressing grain growth... 82
5.2 Synthesis of W -Ti-Cr alloys... 84
Chapter 6 Concluding Rem arks ... 92
Chapter 7 Directions for Future W ork... 94
References ... 96
Appendix A: Information of Samples for Control Experiments in the W-Cr System... 101
Appendix B: Data and references corresponding to Figure 5.8 ... 102
List of Figures
Figure 1.1 Schematic drawing of a direct sintering furnace (1).
Figure 1.2 The nanometer thick quasi-liquid layer between tungsten particles in activated sintering (21).
Figure 1.3 Schematic of the stabilization of a nanoscale quasi-liquid layer below the bulk eutectic temperature (20).
Figure 1.4 The microstructure of W-INi- 1 Fe specimen sintered at 1460 'C for 5 hours (29). Figure 1.5 The secondary electron images after liquid phase sintering of (a) 93W-3.5Ni-1.5Fe-2.OCo alloy (30) and of (b) 93W-5.6Ni-1.4Fe (32).
Figure 1.6 (a) Optical micrograph of and (b) Scanning electron microscopy (SEM) micrograph of adiabatic shear bands in nanocrystalline tungsten (39).
Figure 1.7 Principles of SPD methods: (a) high pressure torsion (HPT), (b) equal-channel-angular-pressing (ECAP) (46).
Figure 2.9 SEM and HR-SEM micrographs of nanocrystalline W-15 at.% Cr after 20 hours of milling showing (a) micron-scale particle size. (b) Bright-field TEM micrograph of
nanocrystalline W- 15 at.% Cr exhibiting nanoscale grains with the inset of selected area diffraction pattern and (c) HR-TEM micrograph showing a grain of nanoscale dimension.
Figure 2.10 The distribution of particle and crystalline size of nanocrystalline W- 15 at.% Cr after 20 hours of milling.
Figure 2.11 (a) Dark field STEM micrograph of nanocrystalline W-15 at.% Cr after 20 hours of ball-milling with energy dispersive spectroscopy (EDS) measurements of (b) W and (c) Cr composition.
Figure 3.1 The change in relative density, Cr content in W solution, and lattice parameter of supersaturated W with increasing temperature.
Figure 3.2 Postsintering microstructures of W- 15 at.% Cr alloy. (a) SEM in back-scatter mode reveals a chromium-rich phase forming necks between the compact particles upon heating up to
1300 'C. (b) A direct visualization of a Cr-rich neck adjacent to W-rich particles is shown in the bright-field TEM image with W and Cr elemental map (superimposed on the micrograph) using
STEM-EDS.
Figure 3.4 Dark-field STEM micrographs of nanocrystalline W- 15 at.% Cr (a) before annealing, (b) at 950 'C, and (c) at 1100 0C.
Figure 3.5 A schematic for densification during nano-phase separation sintering, illustrating that chromium-rich phase provides a short-circuit diffusion pathway for tungsten atoms, which controls the kinetics of sintering.
Figure 3.6 Heating profiles of nanocrystalline W-15 at.% Cr as function of temperature with 5,
10, 15, 20 'C/min heating rates.
Figure 3.7 (a) The mean residual squares as function of sintering activation energy, (b) normalized heating profiles at three different activation energies denoted in (a).
Figure 3.9 Changes in density of milled W-15 at.% Cr and a series of control experiments upon heating.
Figure 3.10 The crystalline phase between tungsten and chromium-rich layer at 1300 'C produced by nano-phase separation sintering.
Figure 3.11 (a) The thickness of the Cr-rich layer during sintering as a function of temperature. (b) SEM micrographs in back-scatter mode of W-15 at.% Cr at various temperatures.
Figure 3.12 The comparison is illustrated with typical microstructures of (a) nano-phase separation sintering, (b) liquid phase sintering (26), and (c) solid-state activated sintering (21). Figure 3.13 (a) The SEM micrograph of W- 15 at.% Cr after sintering. (b) The change in grain size of W-15 at.% Cr as function of density.
Figure 3.14 The comparison of nano-phase separation sintering with activated sintering and liquid phase sintering with regards to grain size and relative density of sintered tungsten alloys. Figure 3.15 (a) The change in the relative density of W- 15 at.% Cr as a function of temperature for powders milled for various times. (b) The relative density at 1300 'C (black), change in lattice parameter before annealing (red), and as-milled grain size (blue) of various samples as a function of milling time.
Figure 3.16 The change in relative density of W-Cr systems with various initial Cr contents. Figure 3.17 The large size sample of W-15 at.% Cr (a) before sintering, in the as-pressed condition and (b) after pressureless sintering in a furnace and cleaning.
Figure 4.1 A model binary phase diagram showing the optimum spot and three thermodynamic conditions for nano-phase separation sintering
Figure 4.5 (a) An SEM micrograph and (b) a TEM micrograph of the as-milled Cr-15 at.% Ni powder.
Figure 4.6 The comparison of grain and particle size distribution of as milled powder of Cr-15 at.% Ni after 15 hours milling.
Figure 4.3 (a) X-ray diffraction patterns of Cr-15 at.% Ni with various milling time (b) The change in the Ni (110) peak with increasing milling time.
Figure 4.4 (a) A dark-field STEM micrograph of nanocrystalline Cr-15 at.% Ni after 15 hours of ball-milling with energy dispersive spectroscopy (EDS) measurements of (b) Cr and (c) Ni.
Figure 4.7 Changes in relative density of nanocrystalline Cr-15 at.% Ni shown with a series of control experiments upon heating.
Figure 4.8 Post-sintering microstructures of Cr- 15 at.% Ni alloy. (a) The SEM micrograph with EDS measurements of local composition of Cr and Ni reveals a nickel-rich phase forming necks between the compact particles upon heating. (b) A direct visualization of Ni-rich necks entirely enclosing Cr-rich particles is shown with Cr and Ni elemental measurement (superimposed on the SEM micrograph) using SEM-EDS.
Figure 4.9 Density-temperature profiles of nanocrystalline Cr-15 at% Ni as a function of temperature at heating rates of 3, 5, 10, 15, and 20 'C/min.
Figure 4.10 (a) The mean residual squares as a function of sintering activation energy, (b)
normalized heating profiles at different activation energies at three activation energies denoted in (a).
Figure 5.1 Pre- and postannealing grain structures of tungsten powders after one week at 11 00 C. (a) The grain size histograms reveal only a minor change in the W-20 at. % Ti alloy after prolonged annealing and an almost two-orders-of-magnitude coarsening in unalloyed W.
(b) The bright-field transmission electron microscopy (TEM) image shows a uniform distribution of nanometer-sized grains in the as-milled structure of the W-20 at. % Ti alloy, with the dark-field TEM image (inset) showing different diffracting crystallites. The postannealing structures vary with alloying: (c) a coarsened grain structure in unalloyed W, presented in a focused ion beam image, and (d) a retained nanocrystalline structure in W-20 at. % Ti, shown in a
bright-field TEM image with a dark-bright-field TEM (inset) (56).
Figure 5.4 X-ray diffraction pattern of nanocrystalline W-35 Ti-10 at.% Cr after 30 hours milling.
Figure 5.5 Particle size distribution of nanocrystalline W-35 Ti-10 at.% Cr after 30 hours of milling.
Figure 5.6 Change in relative density of nanocrystalline W-35 Ti-10 at.% Cr (blue) and W-35 at.% Ti (black).
Figure 5.7 SEM image of a bulk (6 x 4 mm right cylinder) nanocrystalline W-Ti-Cr alloy shows a grain size of about 100 nm at nearly full density.
Figure 5.8 Further comparison of nano-phase separation sintering with liquid phase sintering and activated sintering of tungsten alloys.
List of Tables
Chapter 1
Introduction
1.1 Tungsten sintering
Tungsten, one of the refractory metals, has the highest melting temperature, 3422 'C, among all metals, as well as high strength and density. Because of its intrinsically high melting point, sintering of tungsten is economically and technically preferred to melt casting when producing a bulk shape. Two methods of sintering are commonly employed: direct and indirect sintering (1,
2). In direct sintering, green compacts of tungsten are clamped by molybdenum or tungsten clips and then an electric current of several thousand amperes is passed through them. A schematic drawing of direct sintering is presented in Figure 1.1. The current running through the compact is gradually raised until the temperature reaches 3100 'C. The soak time at the maximum
temperature is between 30 and 60 minutes, which results in 88.5~96 % of the theoretical density of a final sintered product.
Water outlet Atmosphere outlet Water-cooled shell
Upper ber holder (movable tungsten clip)
Pressed bar Lower bar holder (statlonary tungsten clip)
ater Inlet
water outet W tWater Inlet
Atmosphere Inlet To power supply
Figure 1.1 Schematic drawing of a direct sintering furnace (1).
Indirect sintering uses a resistance element in order to generate heat, rather than directly Joule heating the compact. One of the advantages of indirect sintering is that is accommodates larger sized compacts than does direct sintering. Typical indirect sintering temperatures are between 2000 and 2700 'C and the temperature is usually held at the maximum for 6 to 10 hours (1, 2).
Whether direct or indirect sintering is employed for the production of bulk tungsten alloys, it is important to note that very high temperatures from 2000~3050 'C are generally required to achieve full density sintered compacts. Such temperatures are extremely challenging to work with at scale, degrade peripheral equipment relatively quickly, and have an associated high energy cost. For these reasons, it is has long been of interest to develop kinetically enhanced sintering methods for tungsten.
1.2 Enhanced tungsten sintering
1.2.1 Solid-state activated sintering
In 1959, Vacek (3) observed that a very small addition of nickel is highly effective in enhancing sintering kinetics of tungsten and lowering the sintering temperature to ~ 1200 'C. Since that observation, numerous research works have been conducted on the addition of transition metals such as Pd, Pt, Ni, Co and Fe into tungsten for the purpose of accelerating sintering (4-15). The effect has been called solid-state activated sintering.
The mechanism underlying activated sintering of tungsten has been widely studied and debated
(16-19). Panichkina et al. (15) ascribed the low sintering temperature to the effects of transition
elements to dislocation climb. Samsonov (12) suggested that the transfer of electrons from the additive to the d-orbital of tungsten could facilitate tungsten diffusion. Schintlmeister and
Richter (14) observed that the grain boundary diffusion rate of tungsten in Ni-doped tungsten is increased, as compared to pure tungsten. German and Munir (7) proposed that a Ni layer that develops on the surface of the tungsten particles provides a fast transport path for tungsten atoms, which increases tungsten diffusivity and densification rate.
In 2005, Luo et al. provided a thermodynamic and structural explanation for the solid-state activated sintering mechanism in refractory metals by employing the concept of grain boundary complexions (20). They first revealed the premelting of grain boundaries at 95 'C below the bulk eutectic temperature in Ni-doped W through high-resolution transmission electron microscopy (TEM) and Auger spectroscopy (20). Such premelting is referred to as a complexion transition at the grain boundary, and is associated with a rapid and discontinuous change in kinetic properties of the boundary. They therefore concluded that this nanometer thick disordered layer (analogous to amorphous phase) as shown in Figure 1.2 provides a fast transport layer to tungsten atoms, which accelerates sintering kinetics.
Figure 1.2 The nanometer thick quasi-liquid layer between tungsten particles in activated sintering (21).
Luo and coworkers suggested that the stabilization of a nanometer thick quasi-liquid layer could be possible between powder particles even below the bulk melting temperature if the free energy penalty for forming the undercooled liquid film is overcompensated by the reduction in the interfacial energies as presented by Figure 1.3 and Eq. (1):
AGamorphh < ygb 2 c_ (1)
where AGamorph is the change of free energy for forming an amorphous phase, h is the thickness of the amorphous layer, and ygb' 7c, are the excess free energies for a grain boundary and
crystal-liquid, respectively (20).
T
cj
Yg bJ
Figure 1.3 Schematic of the stabilization of a nanoscale quasi-liquid layer below the bulk eutectic temperature (20).
1.2.2 Liquid phase sintering
Liquid phase sintering refers to a sintering process facilitated by the formation of a liquid phase during sintering; an alloy containing more than one component, when sintered above the solidus line, will develop a second liquid phase. A liquid phase usually increases the densification rate for two reasons. First, the capillary force from the wetting liquid helps remove porosity by filling pores with liquid phase. Second, the diffusivities in liquid are relatively high, which allows faster
bonding and densification (22). The theoretical foundations for the liquid phase sintering were established with a focus on tungsten heavy alloys (W-Ni-Fe and W-Ni-Cu), and since then liquid
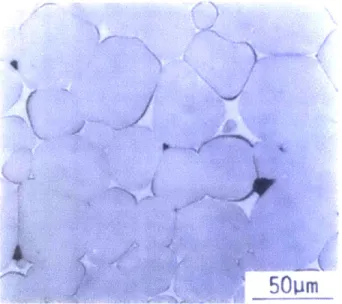
phase sintering has been widely adopted for the manufacture of various products including refractory metals and ceramics (22-28). However, the accelerated kinetics associated with the presence of a liquid phase also lead to concomitant microstructural coarsening. Figure 1.4 displays the final microstructure of the sintered tungsten alloy (W-lNi-1 Fe in wt.%) after liquid phase sintering, delineating average grain size ~50 prm which is 10 times larger than the initial particle size of 5 [tm.
Figure 1.4 The microstructure of W- 1 Ni-i Fe specimen sintered at 1460 'C for 5 hours
(29).
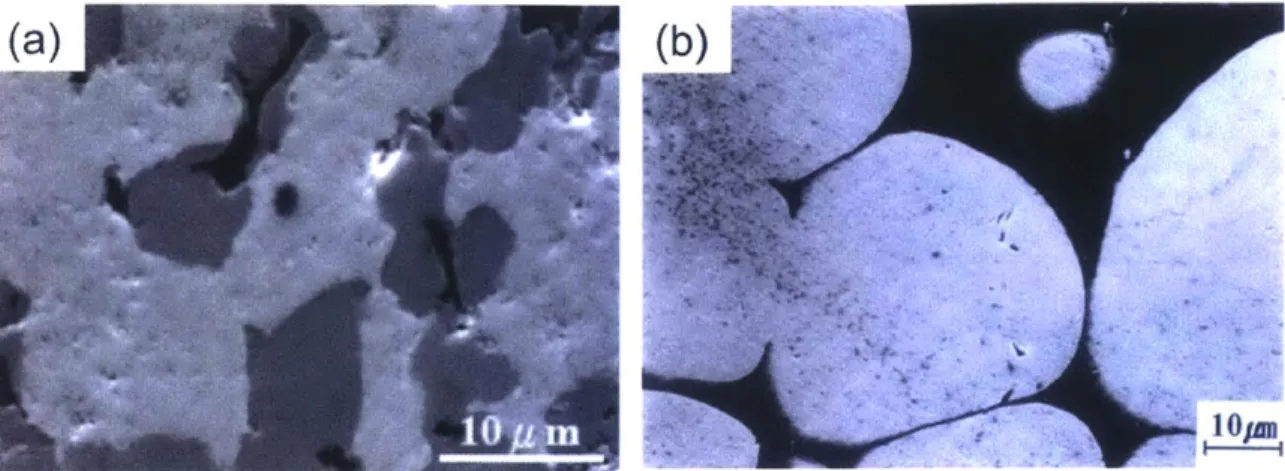
Even using nanopowders or nanocrystalline powders of tungsten alloy (30, 31) as an input for sintering, a sintered product with nanostructure has not yet proven possible to produce through liquid phase sintering. For example, nanocrystalline tungsten alloy powders of
93W-3.5Ni-1.5Fe-2.OCo and 93W-5.6Ni-l.4Fe in wt.%, both which had an average grain size of 16 nm
before sintering, yielded final sintered products with grain sizes of - 15 and -40 jIm, respectively, achieved through liquid phase sintering as shown in Figure 1.5.
Figure 1.5 The secondary electron images after liquid phase sintering of (a) 93W-3.5Ni-1.5Fe-2.OCo alloy (30) and of (b) 93W-5.6Ni-1.4Fe (32).
1.3 Nanocrystalline tungsten
1.3.1 Properties of nanocrystalline tungsten
Unique properties, such as high strength and increased corrosion and creep resistance, can be realized in nanocrystalline metals (33, 34) with an average grain size typically smaller than 100 nm. Body-centered cubic (BCC) nanocrystalline metals have been of interest for unusual deformation phenomenon such as suppressed strain sensitivity (35) and localized shearing instead of uniform plastic deformation under high rate loading (36-38) as compared with microcrystalline materials of the same composition. BCC tungsten has been reported to show localized shearing and adiabatic shear banding when it is nanostructured, as shown in Figure 1.6.
(a
(b)E
Figure 1.6 (a) Optical micrograph of and (b) Scanning electron microscopy (SEM) micrograph of adiabatic shear bands in nanocrystalline tungsten (39).
The formation of shear bands under high rate loading is desirable for a kinetic energy penetrator material, in that more energy should be conveyed to the object rather than dissipated for plastic deformation of the penetrator. There has been great deal of interest in nanocrystalline tungsten for kinetic energy penetrator applications as a prospective replacement for the chemically toxic depleted uranium, because of its intrinsically high density and strength (36, 40-44).
1.3.2 Methodologies for the production of nanocrystalline tungsten
Two general classes of processing methodology have been developed over the past few decades for manufacturing nanocrystalline materials: bottom-up and top-down approaches. Top-down approaches refine a bulk coarse grained material into the nanoscale regime. Bottom-up methods assemble bulk materials from nanostructured precursors.
One of the top-down methods for refining the grain size of tungsten is severe plastic deformation (SPD). SPD is an extension of the concept of "redundant work" (45), where excess shear strain is used for the sole purpose of accumulating defect energy and structural refinement. Two SPD techniques have become typical in the research community: equal-channel-angular-pressing (ECAP) and high-pressure torsion (HPT) as shown in Figure 1. 7 (46). ECAP can reduce the
grain size of tungsten only to a few micron sizes due to dynamic recrystallization and grain growth caused by its high processing temperature around 1000 'C (43). Therefore, a warm rolling process has been proposed as a follow-on process after ECAP to obtain a grain size in the ultra-fine grain regime (39). Another SPD processing method, HPT, is to apply high pressure and torsion to a disk shape of tungsten (46). After a large amount of plastic strain HPT yields a finer grain size about 100 nm (43). These SPD techniques produce W that exhibits elastic-perfectly-plastic deformation at room temperature (no strain hardening), considerably reduced strain rate sensitivity, and finally, shear localization in ultra-fine grained tungsten.
P P
plunger
die
support test material
(a)
(b)
Figure 1.7 Principles of SPD methods: (a) high pressure torsion (HPT), (b) equal-channel-angular-pressing (ECAP) (46).
Despite these demonstrations aimed at producing nanocrystalline tungsten, there are several problems with bulk SPD techniques. First, these techniques dramatically limit the scale of the products. Second, the fine grain size is not stable, and will not likely be maintained if subsequent
processing such as hot shape forming is needed. Third, these techniques do not offer precise control over grain size.
For bottom-up methods, nano-sized or nanostructured particles should be synthesized first, and then these particles consolidated in a "two-step" process (43). Several studies proposed bottom-up methodology for nanocrystalline tungsten with powders synthesized through ball milling or high-energy milling (32, 47-53). Although they successfully achieved nano-sized grain tungsten (5~15 nm) in the powder particles, the nanostructure was highly susceptible to thermally
activated grain growth during the consolidation process at high temperature (54, 55).
1.4 Research objectives and structure of thesis
The above studies suggest that conventional accelerated tungsten sintering methods including solid-state activated sintering and liquid phase sintering are not applicable to nanocrystalline tungsten powder and are not suitable for generating fine-grained structures. The aims of this thesis are to develop a new accelerated sintering method specifically applicable to
nanocrystalline tungsten alloy powders and to achieve nanocrystalline bulk tungsten alloys via sintering without any external forces. This thesis is comprised of three main parts.
* Chapter 2: Nanocrystalline tungsten alloy powder is synthesized through a high-energy ball mill. The synthesized powders are physically and chemically characterized through electron microscopy and x-ray diffraction. Finally, thermal stability of the synthesized powders is confirmed.
* Chapter 3: Compacts of the as-processed powder are annealed and their length change is measured by a thermomechanical analyzer. Accelerated sintering is shown for alloys that contain Cr, and associated with structural changes. The resulting technique is referred to as "nano-phase separation sintering" because of the emergence of a second phase that accelerates densification. A comparison of this approach with conventional enhanced tungsten sintering (including solid-state activated sintering and liquid phase sintering) is presented.
* Chapter 4 and Chapter 5: Applications of nano-phase separation sintering are explored. First, the mechanism of nano-phase separation sintering is shown to be generally applied to other alloy systems to accelerate their consolidation. Second, nanocrystalline bulk tungsten alloy is achieved via nano-phase separation sintering.
Chapter 2
Synthesis and Characterization of
Nanocrystalline Tungsten Powders
This thesis involved the production of powders of several different alloys, characterization of those powders, evaluation of the structural evolution of those powders upon heating, and finally characterization of the density and structural changes of the powders during a sintering cycle. To accomplish these studies, a number of techniques and procedures were used extensively.
The sections below begin by outlining the general procedures and experimental methods used before delving into any specific alloy system.
2.1 Synthesis and characterization procedures of powders
High-energy ball milling
The several powders were used in this thesis: average particle size (APS) 15 Pim W powder (99.9 % purity), APS<10 tm Cr powder (99.2 % purity), APS 2~3 ptm Ni powders (99.9 % purity), -150 mesh Ti powder (99.9 % purity), and they are all from Alfa Aesar. W and W alloys
(W-Cr, W-Ti, W-Ti-Cr), and Cr alloys (Cr-Ni) powders were produced with those commodity powders. For the synthesis of nanocrystalline powder, high-energy ball milling was used, which
leads to grain size refinement to the nanoscale. Powders were mechanically milled or alloyed by a SPEX 8000 high-energy ball mill in an high purity argon-filled glove box with 1 wt.% stearic acid as a process control agent. Tungsten carbide vial and a ball-to-powder ratio of 5 to 1 were used for milling. All synthesized powders use the same milling procedures except for milling time (corresponding milling time is specified in each section).
X-ray diffraction (XRD) patterns were measured using a Panalytical X'Pert Pro diffractometer using Cu-Ka radiation at 45 kV and 40 mA. All alloyed powders were scanned from 30 to 120 using a step size of 0.0167 and time per step of 90 sec. The phases present, lattice parameters, and grain sizes were assessed by Rietveld refinement using a NIST LaB6 standard.
In-situ XRD was measured using the Panalytical X'Pert Pro diffractometer with increasing temperature at a constant heating rate of 10 'C/min under flowing ultra-high purity argon. Diffraction patterns were collected at 850, 900, 950, 1000, and 1050 'C for three diffraction peaks around 40, 74, and 102 degrees (2 theta) to minimize phase evolution during measurement; each peak was scanned for less than 1 minute.
Electron microscopy
Powders were characterized using several different types of microscopy. An XL30
Environmental FEG SEM from Philips and FEI Helios NanoLab DualBeam focused in beam were used for imaging of the powders. TEM specimens were prepared by mixing the powder in epoxy, manually grinding a powder/epoxy disk until it was less than 1 pm thick, and then ion-milled by a Fischione 1010 ion mill maintained at -110 'C by liquid nitrogen. Bright-field images and diffraction patterns were acquired using a JEOL 201 OF TEM operating at 200 kV. After individual grains were manually traced, an average grain size was estimated through their spherical-equivalent diameters measured. Scanning transmission electron microscopy (STEM) with energy dispersive spectroscopy (EDS) was used to obtain local composition measurements, elemental maps and imaging of structures after powder processing. The probe size used for measuring local composition was 0.2 nm.
The particle sizes of all powders were measured using a laser diffraction particle size analyzer from Horiba LA950V2 which can measure particle sizes from 15 nm to few hundreds microns.
Thermomechanical analysis
Characterization of the density during a thermal exposure was accomplished by a
thermomechanical analyzer (TMA). Powder was compacted by cold press into 6 mm diameter and 3~4 mm high cylindrical disks. This cold-pressed compact was then heated without applied pressure at a constant heating rate (10 'C/min) under flowing Ar+3% H2 while measuring the
change in compact density as a function of temperature and time with the TMA from Netzsch Instruments. The force on the compact from the alumina push-rod of the TMA was 100 nm.
2.2 Nanocrystalline tungsten
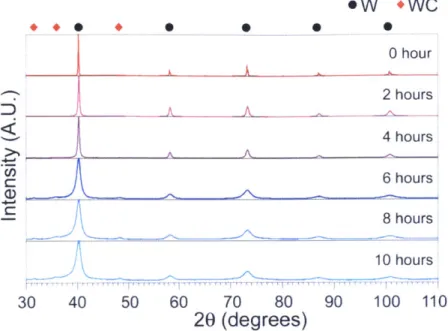
Nanocrystalline tungsten was produced through a high-energy ball mill using the procedure outlined in section 2.1. XRD patterns were acquired with various milling times as shown in Figure 2.1 to examine the milled structure and the change in the grain size. Broadening of tungsten peaks is observed in Figure 2.1 with milling time due to the grain size refinement and the strain from lattice defects. Crystallite refinement to the nanoscale occurs by continuous welding and fracturing during ball milling, and the average grain size of tungsten assessed by the Rietveld refinement method is reduced into around 20 nm after 6 hours of milling. As shown in Figure 2.1, the peaks of tungsten carbide start to be noticeably detected after 6 hours of milling, which is obtained from the milling media. The as-milled grain size and the detection of impurity match those found in literature (50).
+.+ . 0 DA 30 40 50 0 0 Ow +WC 0 0 hour A 2 hours A -A 4 hours A-A-6 hours 8 hours 10 hours 60 70 80 90 100 110
20 (degrees)
Figure 2.1 XRD patterns of ball-milled pure tungsten at different milling times (Courtesy of Dr. Chookajorn).
We constructed a baseline of the sintering curve of nanocrystalline W prepared using the same procedure outlined in section 2.1 for 20 hours of milling. The powder of nanocrystalline W was compacted by cold press into 6 mm diameter and 3~4 mm high cylindrical disks of 0.62 relative density. The change in compact density is shown in Figure 2.2 as a function of temperature.
0)
c0.3-
0.2-a)
0.1
0.0-0
500
1000
1500
Temperature (0C)
Figure 2.2 Relative density change of nanocrystalline W as a function of temperature. As shown in Figure 2.2, nanocrystalline W does not demonstrate any rapid densification and
failed to achieve full density. The onset of sintering at low temperature and the rapid rate of densification are apparently required to produce bulk nanocrystalline tungsten by
minimizing grain growth during a thermal cycle, and therefore the addition of an alloying element into tungsten is desirable to accelerate consolidation.
2.3 Nanocrystalline W-Cr alloys
2.3.1 Alloying element selection
Since this thesis is concerned with production of nanocrystalline W alloys after a sintering cycle, additives to the system should promote the retention of fine grains during the thermal exposure. We therefore are interested specifically in alloying elements that not only may
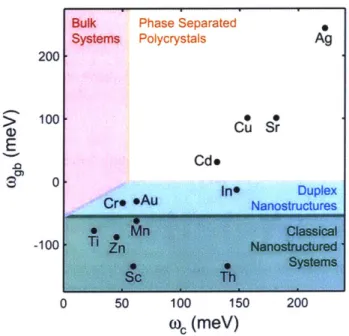
lowering the onset of densification, but which will have positive effects on maintaining grain size. Chookajorn et al. studied stability of nanocrystalline tungsten alloys and constructed a stability map for tungsten-based binary alloys with positive heats of mixing, shown in Figure 2.3 (56, 57).
Bulk Phase Separated
Systems Polycrystals Ag 200 100 CU Cdo n Duplex Cre e~uNanostructures -100 M; .le 0 50 100 150 200
wc
(meV)
Figure 2.3 Stability map of tungsten-based alloys populated with alloy's material parameters (57).
Figure 2.3 represents three stability regions and binary solute additions to tungsten are classified into these regions. The elements which lie in regions of classical and duplex nanostructures (the green and blue region) were found to help stabilize a nanocrystalline state: Ti, Sc, Zn, Mn, Th, Cr, Au, and In.
In addition, they experimentally confirmed thattitanium suppresses grain growth of tungsten; nanoscale grain structure of nanocrystalline W-20 at.% Ti was retained after annealing at
1100 'C for a week (56). This promising level of thermal stability suggests that W-Ti alloys may be suitable for consolidation, although the temperature tested by Chookajorn et al., 11000 C, still lies below the range where tungsten would sinter. Therefore, we heated nanocrystalline W-Ti
alloys to examine its sinterability. The relative density change of nanocrystalline W-20 at.% Ti prepared using the same procedure outlined in section 2.1 for 20 hours of milling was measured as a function of temperature as shown in Figure 2.4. This titanium-tungsten alloy unfortunately shows almost no densification although it might retain the nanoscale grain size during the thermal cycle. 1.0- 0.9-C,) U)0.8- 0.7-W-2Oat% Ti I ' I I 0 500 1000 1500 Temperature (*C)
Figure 2.4 Relative density change of nanocrystalline W-20 at.% Ti as a function of temperature.
The above result confirms that while some elements may promote thermal stability of a nanoscale grain structure, there may still be a consolidation challenge for such powders. In the case of W-Ti, pressureless sintering may not be a viable route to full density compacts. It would therefore be very desirable to find an element that can not only promote nanostructure, but which can also accelerate sintering.
Among the several elements presented in Figure 2.3, we chose to further explore chromium as an alloying element. The map shows that this alloy pair lies in a unique regime called the
"nano-duplex" regime, which suggests evolution of the nanostructure to a nanoscale two-phase
structure; this in turn could affect long-range transport of matter across the structure as required for sintering. Furthermore, the W-Cr system has no intermetallic compounds at any temperature based on the equilibrium phase diagram of W-Cr alloy in Figure 2.5. We assumed that an intermetallic compound having strict stoichiometry might be a kinetic obstacle to densification; the W-Cr system possesses only Cr and W rich phases up to a critical temperature.
106 20 30 40 %0 at %
60 70 8 90
Figure 2.5 Equilibrium In the following section, we such as the addition level of
phase diagram of W-Cr alloy (58).
show how to determine a set of parameters for powder processing Cr and ball-milling time.
2.3.2 Cr addition level and milling time
Cr addition level 0 05 E 0) 3000. 2500- 2000-1863 1500- 1000-(Cr.WV) 18,30 ((Cr,W~))., + ((Cr,VV))2 3422 Wo0 w Cr
W and Cr powder were mechanically milled for 20 hours using the same procedure outlined in section 2.1, and XRD patterns of as-milled W-Cr alloys were obtained with varying Cr contents as shown in Figure 2.6, showing the broadening of tungsten peaks due to grain refinement. Another characteristic in XRD patterns with increasing the Cr content is that the tungsten peaks are shifted to the right. The shift of tungsten peaks suggests that Cr atoms are dissolved into W after ball-milling process (59).
- 0
e w
A WC A A 20 at% 15 at% ~ 10 at% 7 at% 5 at% 40 60 80 100 120 20 (degrees)Figure 2.6 X-ray diffraction patterns of W-Cr systems with varying Cr content.
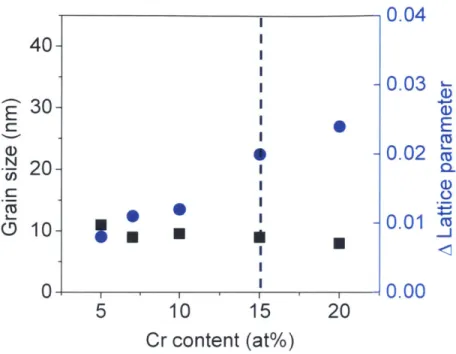
The as-milled grain size and change in the lattice parameter of W after 20 hours of ball-milling
were measured by the Rietveld refinement method and represented with increasing Cr content in
Figure 2. 7. Figure 2. 7 shows that grain sizes reach nanoscale dimensions at all Cr contents after
milling and they all have a similar grain size around 10 nm. The blue circle points in Figure 2.7
represent the change in the lattice parameter of tungsten, showing an abrupt increase between 10
0.04
40-0.03
'E'
30-
a)
* E S-0.02 N20-I -0.00
.
0.00
5
10
15
20
Cr content (at%)
Figure 2.7 As-milled grain size and change in the lattice parameter of W-Cr systems after ball-milling.
The solubility of Cr in W seems to be beyond the saturation limit at 15 at.%. How much Cr dissolves into W is a very core concept in accelerating tungsten sintering kinetics which will be discussed later. We choose W- 15 at.% Cr as a model composition for further in-depth study. We will return briefly to other compositions after understanding the mechanisms of sintering in this alloy system.
High-energy ball milling time
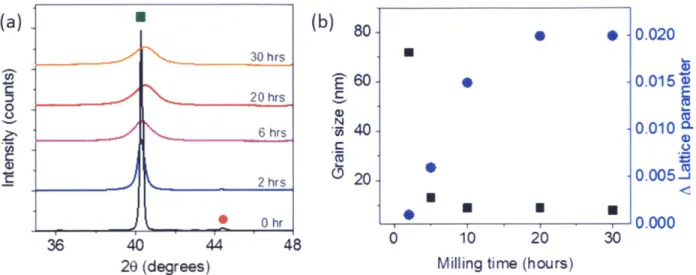
After setting the content of Cr at 15 at.%, we examined the effects of ball-milling time on tungsten alloy powders to determine proper one. XRD patterns of W- 15 at.% Cr are shown in Figure 2.8(a) as a function of milling time. With increasing milling time, the W peak (green point) is broadened and shifted to the right and the Cr peak (red point) is gradually disappearing. The as-milled grain size and change in the lattice parameter of W after ball-milling were
measured by the Rietveld refinement method and represented as a function of milling time in Figure 2.8(b). (a) (b) 8 0.020 30 hrs * 60 --0.0150 0 hrs 2
hrs
20 0 -0.005-WUi
In .0.00 2-0 hr 0.000 36 40 44 48 0 10 20 3020 (degrees) Milling time (hours)
Figure 2.8 (a) X-ray diffraction patterns of W-15 at.% Cr with varying milling time. (b) As-milled grain size and change in the lattice parameter of W- 15 at.% Cr as a function of milling time.
The grain size (black squares) shows an abrupt drop and reaches ~ 10 nm at 5 hours of milling. The lattice parameter change of tungsten is increasing as a function of milling time due to Cr dissolving into W. This lattice parameter change shows a plateau after 20 hours of milling, suggesting that the maximum solubility of Cr in W is achieved between 10 and 20 hours of milling. Therefore, we chose 20 hours of milling for powder processing in all of the subsequent experiments. The amount of tungsten carbide, picked-up from abrasion of the milling media, is around 1-2 weight percent after 20 hours of milling, as assessed by Rietveld refinement.
Therefore, the following discussions will all focus upon tungsten alloy powders having a specific Cr content of 15 at.% processed for 20 hours of milling.
The SEM micrograph of as-milled W-15 at.% Cr after 20 hours of milling shown in Figure 2.9(a) reveals that as-processed powder particles are micron-size in diameter.
(a)
(b)
(c)
Figure 2.9 SEM and HR-SEM micrographs of nanocrystalline W-15 at.% Cr after 20 hours of milling showing (a) micron-scale particle size. (b) Bright-field TEM
micrograph of nanocrystalline W-15 at.% Cr exhibiting nanoscale grains with the inset of selected area diffraction pattern and (c) HR-TEM micrograph showing a grain of nanoscale dimension.
Although the refinement of the grain size into nanoscale regime is successfully achieved through a high-energy ball mill, the particle size still remains at a micron-scale dimension. The reduction
in particle size during ball milling is highly limited because cold-welding increases particle size while fracturing simultaneously reduces it leading to a steady-state equilibrium particle size (60, 61). The average particle size after 20 hours of milling is 1.2 tm, which implies that the sintering driving force with regards to surface energy is unchanged by the milling process. This is an important point of differentiation from the sintering of nanopowders, which exhibit low sintering temperature caused by the excess surface energy due to the use of nano-sized particles.
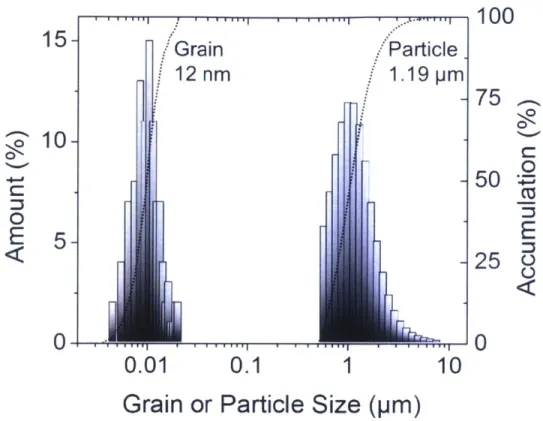
TEM micrographs shown in Figure 2.9(b) and (c) exhibit nanoscale W-alloy grains after 20 hours of milling as expected, and the average grain size estimated with TEM micrographs is revealed to be 12 nm which is very close to that assessed by the Rietveld refinement method (10 nm). The comparison in size distribution between particles measured by the laser diffraction particle size analyzer and grains is delineated in Figure 2.10. This comparison confirms that each milled powder particle is polycrystalline with nanoscale grains (62, 63), which is an important distinction as compared to, e.g., nanopowders, where every particle is of nanometer scale dimension and typically is a single crystal.
Grain
12
nm
Particle.
1.19 pm
I
11
100
75
0 C: 0E
25
U 1.J . , ''. .-I.. . *. . - .-r0.01
0.1
1
10
Grain or Particle Size (pm)
Figure 2.10 The distribution of particle and crystalline size of nanocrystalline W- 15 at.% Cr after 20 hours of milling.
So far we physically characterized as-milled tungsten alloy powders and in the following section, we review chemical effects which a high-energy ball mill leads to.
2.3.4 Supersaturation
The selected-area diffraction pattern shown in the inset of Figure 2.9(b) only exhibits diffraction rings from a tungsten bcc solid solution while chromium's is not visible, suggesting that Cr atoms are dissolved into W, in agreement with the XRD results presented earlier. This tungsten dissolution level does not align with the equilibrium phase diagram of W-Cr which expects a
I'
15
0 0E
10-
5-I'negligible equilibrium solubility of chromium in tungsten at room temperature as shown in Figure 2.5 (58).
Atomic level mixing above an equilibrium solubility occurs during ball milling due to the severe plastic deformation and continuous shearing across interfaces (60, 64). This non-equilibrium
process thus has been employed to synthesize supersaturated solid solutions in various immiscible alloy systems (59, 65-68). Such forced atomic mixing by mechanical attrition in immiscible alloy systems can sometimes be balanced by a demixing tendency to lower free energy, which would obey a diffusional kinetics. However, in the W-Cr system the diffusion distance at low temperature is extremely short due to low diffusion coefficients (69), which finally leads to a supersaturated tungsten solid solution at room temperature.
We confirm this supersaturated tungsten solid solution using XRD and STEM. As shown in the XRD pattern of Figure 2.8(a), the intensity of chromium diffraction gradually decreases with increasing milling time and eventually disappears after 20 hours of milling. The dark field STEM micrograph of W- 15 at.% Cr after 20 hours of ball-milling with EDS measurements of local composition shown in Figure 2.11 also demonstrates that the Cr atoms are homogeneously distributed over the entire tungsten particle without showing noticeable contrast variation at any
(a)50n
(b)
(C)
Figure 2.11 (a) Dark field STEM micrograph of nanocrystalline W-15 at.% Cr after 20 hours of ball-milling with energy dispersive spectroscopy (EDS) measurements of (b) W and (c) Cr composition.
All datasets including XRD, TEM, and STEM clearly imply that ball milling of W-15 at.% Cr for 20 hours generates a supersaturated tungsten solid solution.
2.3.5 Thermal stability'
The as-milled structure of W-15 at.% Cr is a non-equilibrium uniform solid solution and it is therefore expected to evolve upon heating where phase separation should occur (57). In case of the W-Cr system, which has a simple miscibility gap, phase separation could theoretically occur via either one of two ways: spinodal decomposition or nucleation and growth. The mechanism of
phase separation in as-milled W- 15 at.% Cr would be nucleation and growth instead of spinodal decomposition for two reasons. First, the composition of 15 at.% Cr is outside of the chemical spinodal region as shown in Figure 2.12. Second, spinodal decomposition requires the certain amount of supercooling from a critical temperature to overcome the strain energy and the W-Cr system needs a supercooling on the order of 1650 'C (70, 71). Therefore, a supersaturated W- 15 at.% Cr solid solution is expected to decompose at high temperatures by nucleation and growth.
1400-
100-0 20 40 00 so 100
Cr --- w at W W
Figure 2.12 Miscibility gap in the W-Cr system (solid line) with the calculated chemical spinodal (dashed line) (71).
The as-milled W- 15 at.% Cr powder was compacted and annealed to high temperatures at a constant heating rate of 15 'C/min in a reducing atmosphere of argon with 3% H2 and cooled down rapidly under flowing argon with 3% H2 after the target temperature was reached. We find
boundaries and triple junctions, as delineated with green lines in the bright-field TEM image of Figure 2.13(a).
(a) TEM, 9500C
4
(b) Simulation, 950'C (c) Simulation, 8000 C
Figure 2.13 A W-15 at.% Cr alloy after heating to 950'C and cooling. (a) A bright-field TEM image shows the emergence of nanoscale Cr precipitates mostly next to grain boundaries and triple junctions after annealing up to 950 C; a few such Cr domains are encircled for clarity. For comparison, MC simulation results of the same system at (b)
950'C and (c) 800'C are shown (Simulation results are courtesy of Dr. Chookajorn).
The preferential formation of the Cr-rich phase at grain boundaries and triple junctions confirms that the decomposition occurs via a nucleation and growth mechanism as expected; spinodal decomposition leads to homogeneous precipitation rather than concentration at points of facile nucleation (70).
Heat dissipated during nucleation can be calculated using the enthalpy of mixing: Hmjx x X x
(1 - X) where H mix is the enthalpy of mixing and X is the alloy composition. When
supersaturated W-15 at.% Cr is decomposed into the W-rich and the Cr-rich phase at 950 'C, generated heat is 2.436 kJ/mole. This estimated heat is the very upper bound because nucleation does not occur all at once based on the low diffusivity of Cr in W (77). Temperature increase occurred by the dissipated heat is ~98 'C calculated using the specific heat of tungsten. Such a small amount of released heat, which would evolve gradually during decomposition and therefore would not cause a significant temperature rise for a very long time, is unlikely to be a significant effect on the overall sintering kinetics of the system.
Monte Carlo (MC) simulations for nanostructured W-Cr alloys were conducted to simulate an equilibrium microstructure (by Chookajorn). Figure 2.14 shows a series of simulations of the W-Cr systems with nanoscale grain boundaries available. The structures are shown at temperatures from 900 to 1500'C, which capture the crossing of the solvus (the cooling procedure was described in (57)). The size of Cr-rich precipitates here is highly refined to the nanoscale. At a certain solute composition, the structure evolves from being both grain boundary-segregated and phase-separated at lower temperature to displaying solute-segregated grain boundaries at high temperature.
r% n ir% 20% 1500c*C 1400*C 13000C 1200*C 1100c* 1000*C 9000C
Figure 2.14 Changes in equilibrium structure with Cr composition and temperature in nanostructured W-Cr alloys, as predicted by the Monte Carlo model (57).
The microstructure experimentally observed in Figure 2.13(a) is consistent with the MC results of Figure 2.13(b) at the same temperature, comparing qualitatively favorably in terms of characteristic scales and prevalence of the second phase Cr particles, but with somewhat higher volume fraction and smaller Cr particles than the simulation. This is most likely due to the short heating cycle we used experimentally (a constant heating rate followed by gas-cooling), which may not fully evolve the structure to an equilibrated state. Indeed, comparing with simulations at a slightly lower temperature of 800 *C, which might be more reflective of the average time-at-temperature conditions experienced by the experimental sample, shows an improved agreement. The volume fraction of Cr-rich phase assessed from Figure 2.13(a) is around 17%, which
in Figure 2.13(a) at -8 nm is also close to that from the 800 'C MC structure in Figure 2.13(c) at -9 nm.
Chapter 3 Nano-Phase Separation Sintering
The previous chapter established the procedures for synthesizing nanocrystalline alloy powder, and led to a downselection onto the W- 15 at.% Cr alloy system for more detailed study. It also established that the system is capable of retaining a nanoscale structure through a significant thermal exposure, and yet undergoes a decomposition by nucleation and growth to a two-phase "nano-duplex" structure in which Cr domains decorate the grain boundaries and triple junctions of W grains within each powder particle.
With this background, we now proceed to explore the sintering in this system, with an eye towards understanding the sintering mechanisms.
3.1 Density and structure changes upon heating
i) The change in density upon heating
W- 15 at.% Cr powder was ball-milled using the same procedure outlined in section 2.1 and was then compacted by cold press into 6 mm diameter and 3~4 mm high cylindrical disks of 0.63 relative density. Cold-pressed compacts of as-milled W- 15 at.% Cr powder were heated without applied pressure at a constant heating rate (10 'C/min) under Ar+3% H2 and cooled down rapidly
under Ar+3% H2 after the target temperature was reached. The change in compact density as a function of time and temperature was measured with the TMA. As shown in Figure 3.1, sintering is found to initiate at ~950 'C. Such sintering temperatures are significantly lower than typical W sintering temperatures, which can reach 3000 'C for micron-size powders (72); recall in Figure 2.2 and Figure 2.4 that the W used in this study does not sinter appreciably for the same thermal excursion, and a grain-size-stabilizing addition of Ti does not change this. The sintering of W- 15 at.% Cr at these temperatures is thus noteworthy.
C: CU c U1) 0 CU .CI ')
(3
0.3-
0.2-
0.1-
0.0- 15-CO) 0 2) CO 10- 5-0 500 1000 Temperature (*C) 150( I I-I A A -AAA-0.96
0.8 8
a)0.80
0
0.72
0. 6 4 a) 0.000 E E 0.005 2 0.010 C 0Figure 3.1 The change in relative density, Cr content in W solution, and lattice parameter of supersaturated W with increasing temperature.
Figure 3.1 illustrates that nearly full density is achieved without any external pressure after 155
minutes of annealing (final density > 98%).
ii) The change in microstructure upon heating
As shown in the SEM micrograph in back-scattered mode in Figure 3.2(a), a chromium-rich phase precipitates from the supersaturated solution upon heating. The chromium is found
covering tungsten particle surfaces in small domains and forming necks between the tungsten 0
x
powder particles. These Cr-rich domains are delineated by the yellow, dashed lines in Figure
3.2(a).
(a)
(b)
200 nm
Figure 3.2 Postsintering microstructures of W-15 at.% Cr alloy. (a) SEM in back-scatter mode reveals a chromium-rich phase forming necks between the compact particles upon heating up to 1300 'C. (b) A direct visualization of a Cr-rich neck adjacent to W-rich particles is shown in the bright-field TEM image with W and Cr elemental map
(superimposed on the micrograph) using STEM-EDS.
The Cr-rich nature of the neck between the two particles is confirmed in Figure 3.2(b) through STEM-EDS measurements of local tungsten and chromium composition, explicitly showing that the powder particles are rich in W and the neck is rich in Cr. The interparticle contact point where the necks form is a thermodynamically favored site for phase separation and growth; phase separation and growth at such sites is also observed in other alloy systems (73, 74). By
assuming the classical sintering model of two spherical particles in contact with each other, excess vacancies (AC = CO L, CO: vacancy concentration on flat surface, VO: the molar volume, y: the surface energy, r: the radius of neck curvature, R: gas constant, T: temperature) exist over the equilibrium concentration beneath the concave surfaces of the particle contact point. These geometrically-induced excess vacancies cause chromium atoms to diffuse more rapidly in the
area surrounding the contact point. This accelerated diffusion makes these sites favorable for nucleation of the second phase. In addition to geometric effects, diffusional flow of chromium caused by a gradient in vacancy concentration occurs more rapidly than tungsten due to its higher diffusion coefficient (69), which results in interparticle necks enriched with chromium. This accounts for the fact that the Cr-rich phases delineated in Figure 3.2(a) and (b)
preferentially decorate interparticle necks and the surfaces.
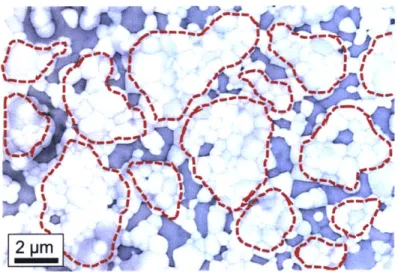
We also examined the microstructure of W- 15 at.% Cr at nearly full density after sintering, as shown in Figure 3.3. We have circled in red those regions that are likely the original powder particles, and which are now W rich, having ejected Cr from solution. Such particles tend to be decorated around their perimeter with Cr-rich domains. The structure here is consistent with those at lower densities presented in Figure 3.2.
2 pm
Figure 3.3 SEM micrograph in back scattering mode of W-15 at% Cr with near-full
density after sintering.
3.2 Sintering mechanism and kinetics
In order to examine the abnormal, low-temperature sintering mechanism, a detailed chemical and microstructural analysis was performed. More specifically, the Cr content in the supersaturated
W solution was measured by STEM-EDS and lattice parameter of supersaturated W estimated by the Rietveld refinement method were observed through a sintering cycle as shown in Figure 3.1. The microstructures of nanocrystalline W-15 at.% Cr upon heating were examined by dark-field
STEM, with typical results presented in Figure 3.4.
5 nm 10n 0m
Figure 3.4 Dark-field STEM micrographs of nanocrystalline W- 15 at.% Cr (a) before annealing, (b) at 950 'C, and (c) at 1100 'C.
The Cr content in the tungsten solution as function of temperature denoted as the black points in
Figure 3.1 is found to drop simultaneously with the emergence of phase separation. The Cr-rich
phases, which are seen as darker phases in dark field STEM micrographs, begin to precipitate at grain boundaries and triple junctions at the same temperatures at which chemistry begins to evolve (Figure 3.4(b)). The lattice parameter of the tungsten solid solution as a function of heating temperature (the blue points in Figure 3.1), begins changing at the same temperature as the initial observation of phase separation. All of these data verify that phase separation is triggered around 950 'C, which is the same temperature as the onset of densification.
We attribute the onset of sintering at low temperature and the rapid rate of densification in the W-Cr system to the nanoscale phase separation generating fast diffusion pathways for tungsten
atoms. Once the Cr-rich phase has been ejected out of the supersaturated tungsten and formed an interparticle neck, the solubility of W in the neck increases as temperature increases (58),
suggesting that it is capable of dissolving W atoms and providing a transport pathway. The STEM-EDS measurement of local tungsten and chromium composition (Figure 3.2(b)) visibly shows a large amount of tungsten dissolved in the Cr-rich neck. Therefore, we posit that densification occurs by the W atoms i) dissolving from the particle into the neck, ii) diffusing through the Cr-rich phase in the neck to the lower free energy sites at the neck edge, and iii) filling and annihilating the pore between particles, which is illustrated through a schematic structure in Figure 3.5.
Diffusion pathways
for tungsten
Figure 3.5 A schematic for densification during nano-phase separation sintering, illustrating that chromium-rich phase provides a short-circuit diffusion pathway for tungsten atoms, which controls the kinetics of sintering.
ii) Sintering kinetics
We identify the characteristic atomic processes which form the rate-limiting step during sintering by determining the sintering activation energy, and corroborate the proposed sintering
mechanism. To determine the sintering activation energy, the master sintering curve method (75,
76) was employed. The atomic flux contributing to filling the pores is related to instantaneous shrinkage rate of a compact.
dL yf2 Dr, +Db Fb
L dt x( G3 + G4
where y is the surface energy, f2 is the atomic volume, k is the Boltzmann constant, T is the temperature, G is the average particle or grain size, p is the relative density, t is time, 6 is the
grain boundary thickness, D, and Db are the coefficients for volume and grain boundary diffusion, F is a parameter which relates the driving force, mean diffusion distance, and other geometric features of the microstructures. Assuming isotropic shrinkage, Eq. (1) can be related to the integral form of the instantaneous densification rate as follows:
F
(G (p))n t ynDO Q3p )d p = Jk exp---) dt(2)
p3pr(p) U
k RT
where
Q
is the sintering activation energy, R is the gas constant, p is the relative density, Do =(D,)o and n = 3 for volume diffusion, and Do = (8Db)o and n = 4 for grain-boundary diffusion.
Eq. (2) can be rearranged into an equivalence of two terms: one including all microstructural and materials properties (Eq. (3)) and the other which depends only on
Q
and the heating time-temperature profile, T(t) (Eq. (4)).P) G(p))' dp (3)
yf2DO
J,,O
3pF(p)t i Q
0
(t, T (t)) - exp(- -) dt (4)fo T R T
If a single sintering activation energy exists, then is the correct value of