HAL Id: hal-01286073
https://hal.sorbonne-universite.fr/hal-01286073
Submitted on 10 Mar 2016
HAL is a multi-disciplinary open access
archive for the deposit and dissemination of
sci-entific research documents, whether they are
pub-lished or not. The documents may come from
teaching and research institutions in France or
abroad, or from public or private research centers.
L’archive ouverte pluridisciplinaire HAL, est
destinée au dépôt et à la diffusion de documents
scientifiques de niveau recherche, publiés ou non,
émanant des établissements d’enseignement et de
recherche français ou étrangers, des laboratoires
publics ou privés.
Related Mortality-Lessons Learned from the In-Silico
Approach: A European Society for Blood and Marrow
Transplantation Acute Leukemia Working Party Data
Mining Study
Roni Shouval, Myriam Labopin, Ron Unger, Sebastian Giebel, Fabio Ciceri,
Christoph Schmid, Jordi Esteve, Frederic Baron, Norbert Claude Gorin, Bipin
Savani, et al.
To cite this version:
Roni Shouval, Myriam Labopin, Ron Unger, Sebastian Giebel, Fabio Ciceri, et al.. Prediction of
Hematopoietic Stem Cell Transplantation Related Mortality-Lessons Learned from the In-Silico
Ap-proach: A European Society for Blood and Marrow Transplantation Acute Leukemia Working Party
Data Mining Study. PLoS ONE, Public Library of Science, 2016, 11 (3), pp.e0150637.
�10.1371/jour-nal.pone.0150637�. �hal-01286073�
Prediction of Hematopoietic Stem Cell
Transplantation Related Mortality- Lessons
Learned from the
In-Silico Approach: A
European Society for Blood and Marrow
Transplantation Acute Leukemia Working
Party Data Mining Study
Roni Shouval
1,2,3*, Myriam Labopin
4,5,6,7, Ron Unger
3, Sebastian Giebel
8, Fabio Ciceri
9,
Christoph Schmid
10, Jordi Esteve
11, Frederic Baron
12, Norbert Claude Gorin
4,
Bipin Savani
13, Avichai Shimoni
1, Mohamad Mohty
4,5,6,7, Arnon Nagler
1,41 Division of Hematology and Bone Marrow Transplantation, The Chaim Sheba Medical Center, Tel-Hashomer, Ramat-Gan, Israel, 2 Internal medicine "F" Department and the 2013 Pinchas Borenstein Talpiot Medical Leadership Program, The Chaim Sheba Medical Center, Tel-Hashomer, Ramat-Gan, Israel, 3 The Mina and Everard Goodman Faculty of Life Sciences, Bar-Ilan University, Ramat-Gan, Israel, 4 EBMT Paris Office, Hospital Saint Antoine, Paris, France, 5 Sorbonne Universités, UPMC Univ Paris 06, UMR_S 938, CDR Saint-Antoine, F-75012, Paris, France, 6 INSERM, UMR_S 938, CDR Saint-Antoine, F-75012, Paris, France, 7 AP-HP, Hématologie Clinique et Thérapie Cellulaire, Hôpital Saint-Antoine, Paris, France, 8 Department of Bone Marrow Transplantation and Oncohematology, Maria Sklodowska-Curie Memorial Cancer Center and Institute of Oncology, Gliwice Branch, Gliwice, Poland, 9 Hematology and BMT Unit, San Raffaele Scientific Institute, Milan, Italy, 10 Department of Hematology and Oncology, Klinikum Augsburg, Ludwig-Maximilians-University, Munich, Germany, 11 Hematology Department, IDIBAPS, Hospital Clínic, Barcelona, Spain, 12 Hematology & GIGA research, University of Liège, Liège, Belgium, 13 Hematology & Stem Cell Transplantation Section, Vanderbilt University Medical Center, Nashville, Tennessee, United States of America
*shouval@gmail.com
Abstract
Models for prediction of allogeneic hematopoietic stem transplantation (HSCT) related
mor-tality partially account for transplant risk. Improving predictive accuracy requires
understat-ing of prediction limitunderstat-ing factors, such as the statistical methodology used, number and
quality of features collected, or simply the population size. Using an in-silico approach (i.e.,
iterative computerized simulations), based on machine learning (ML) algorithms, we set out
to analyze these factors. A cohort of 25,923 adult acute leukemia patients from the
Euro-pean Society for Blood and Marrow Transplantation (EBMT) registry was analyzed.
Predic-tive objecPredic-tive was non-relapse mortality (NRM) 100 days following HSCT. Thousands of
prediction models were developed under varying conditions: increasing sample size,
spe-cific subpopulations and an increasing number of variables, which were selected and
ranked by separate feature selection algorithms. Depending on the algorithm, predictive
performance plateaued on a population size of 6,611
–8,814 patients, reaching a maximal
area under the receiver operator characteristic curve (AUC) of 0.67. AUCs
’ of models
a11111
OPEN ACCESS
Citation: Shouval R, Labopin M, Unger R, Giebel S, Ciceri F, Schmid C, et al. (2016) Prediction of Hematopoietic Stem Cell Transplantation Related Mortality- Lessons Learned from theIn-Silico Approach: A European Society for Blood and Marrow Transplantation Acute Leukemia Working Party Data Mining Study. PLoS ONE 11(3): e0150637. doi:10.1371/journal.pone.0150637
Editor: Francesco Bertolini, European Institute of Oncology, ITALY
Received: January 11, 2016 Accepted: February 17, 2016 Published: March 4, 2016
Copyright: © 2016 Shouval et al. This is an open access article distributed under the terms of the
Creative Commons Attribution License, which permits unrestricted use, distribution, and reproduction in any medium, provided the original author and source are credited.
Data Availability Statement: The European Society for Blood and Marrow Transplantation (EBMT) does not allow registry data being public, due to ethical restrictions. Data are available upon approval of specific study synopsis by the various working party chairs. Readers interested in the data may contact Prof. Arnon Nagler, chairman of the Acute Leukemia Working Party (ALWP) of the European Society for Blood and Marrow Transplantation (Arnon. Nagler@sheba.health.gov.il).
developed on specific subpopulation ranged from 0.59 to 0.67 for patients in second
com-plete remission and receiving reduced intensity conditioning, respectively. Only 3
–5
vari-ables were necessary to achieve near maximal AUCs. The top 3 ranking varivari-ables, shared
by all algorithms were disease stage, donor type, and conditioning regimen. Our findings
empirically demonstrate that with regards to NRM prediction, few variables
“carry the
weight
” and that traditional HSCT data has been “worn out”. “Breaking through” the
predic-tive boundaries will likely require additional types of inputs.
Introduction
Allogeneic hematopoietic stem transplantation (HSCT) is a potentially curative procedure for
selected patients with hematological malignancies. Transplant associated morbidity and
mor-tality remains substantial, making the decision of whom, how and when to transplant, of great
importance [
1
].
The European Group for Blood and Marrow Transplantation (EBMT) score, initially
devel-oped for prediction of allogeneic HSCT outcomes in chronic myeloid leukemia, and later
vali-dated for other diagnoses, has pioneered the field of prognostic modeling in HSCT [
2
,
3
]. Since
its release, almost two decades ago, additional scores have also been developed. These have
been validated, but do not fully account for transplantation risk in acute leukemia [
4
–
9
].
Performance limiting factors of HSCT prediction models might be attributed to inherent
procedural uncertainty, the statistical methodology used, or the number and quality of features
collected. Using an
in-silico approach (i.e., iterative computerized simulations), based on
machine learning (ML) algorithms, we set out to explore these factors in order to improve
future acute leukemia HSCT outcome prediction models.
ML is a field in artificial intelligence. The underlying paradigm does not start with a
pre-defined model; rather it lets the data create the model by detecting underlying patterns. Thus,
this approach avoids pre-assumptions regarding model types and variable interactions, and
may offer additional knowledge, which has eluded detection by standard statistical methods.
ML algorithms, have been applied in various "big data" scenarios such as financial markets,
complex physical systems, marketing, advertising, robotics, meteorology, biology and more.
They are tools in the data mining approach for knowledge discovery in large datasets [
10
,
11
].
Recently, we have developed the EBMT- Alternating Decision Tree (ADT) ML based
predic-tion model for mortality at 100 days following allogeneic HSCT in acute leukemia [
9
,
12
].
Hence, demonstrating feasibility of the data mining approach in HSCT.
Methods
Study population
This was a retrospective, data mining, supervised learning study, based on data reported to the
Acute Leukemia Working Party (ALWP) registry of the EBMT. The EBMT is a voluntary
group of more than 500 centers, required to report all consecutive HSCT and follow-ups
annu-ally in a standardized manner. The study was approved by the ALWP board. Written informed
consent was given by participants for their clinical records to be used in EBMT retrospective
studies.
Inclusion criteria encompassed first allogeneic transplants from HLA matched sibling and
unrelated donors (> = 8/10), performed from 2005 to 2013, using peripheral blood stem cells
Funding: The study was funded by a grant from the Shalvi Fund for Internal Medicine Research, Israel. The funders had no role in study design, data collection and analysis, decision to publish, or preparation of the manuscript.
Competing Interests: The authors have declared that no competing interests exist.
or bone marrow as cell source, on adults (age
> = 18 years) diagnosed with de-novo acute
leu-kemia. Haploidentical and cord blood transplants were not included.
A total of 26,266 patients from 326 European centers were initially analyzed. Patients lost
from follow-up before day 100 post HSCT were discarded from analysis (n = 343, 1.3%). Twenty
two variables describing recipient, donor, and procedural characteristics were
considered.Vari-ables were defined according to EBMT criteria (
Table 1
and Appendix A in
S1 File
) [
13
].
Study objectives
Study objectives included development of multiple prediction models for NRM 100 days post
allogeneic HSCT, while estimating effects of the algorithm type, population size, specific
sub-populations and number of variable incorporated, on the models' predictive performance. Day
100 NRM was defined as death without previous relapse/progression before day 100.
Study design
Prediction models for day 100 NRM were developed using six ML algorithms (WEKA v.
3-7-11, New-Zealand). Through an
in-silico approach, algorithms were iteratively exposed to an
increasing population size, varying sub-populations, or an increasing number of ranked
vari-ables, selected by a separate feature selection algorithm (
Fig 1
). For each iteration, a prediction
model was trained and tested through 10 fold cross-validation. This process was repeated 5
times, each time randomly sampling the experimental dataset (see below). Performance was
evaluated according to the area under receiver operator characteristic curve (AUC) [
14
,
15
].
Tuning of the algorithms parameters (Table A in
S1 File
) and the feature selection process,
explained below, were conducted on an optimization dataset (n = 3,888, 15%), whereas the
development of the various models of day 100 NRM prediction were done on the experimental
dataset (n = 22,035, 85%). Samples were randomly allocated to each dataset from the original
dataset.
Machine learning Algorithms
Six popular, supervised classification ML algorithms were selected (Appendix B in
S1 File
).
Naïve bayse (NB), alternating decision trees (ADT) and logistic regression (LR) produce
mod-els with interpretable structures, whereas multilayer perceptron (MLP), random forest (RF)
and AdaBoost are "black box" models, where the function connecting the predictor variables
with response is opaque to the user [
16
–
22
].
Feature selection
Feature selection is the process of ranking variables and identifying irrelevant and redundant
information. The reduction of dimensionality presents a number of benefits, such as enabling
algorithms to operate faster and more effectively, improving classification accuracy, improving
data visualization, and enhancing understanding of the derived classification models [
23
].
Using a classifier based feature selection algorithm, which was applied on the optimization
dataset for each of the 6 previously described ML classification algorithms, variables were
ranked according to their importance for prediction of day 100 NRM (Appendix C in
S1 File
).
Results
Patient characteristics
Characteristics of 25,923 analyzed patients are listed in
Table 1
. The majority had Acute
Mye-loid Leukemia (AML) (71.8%), were in first complete remission (CR1) (62.5%) and received
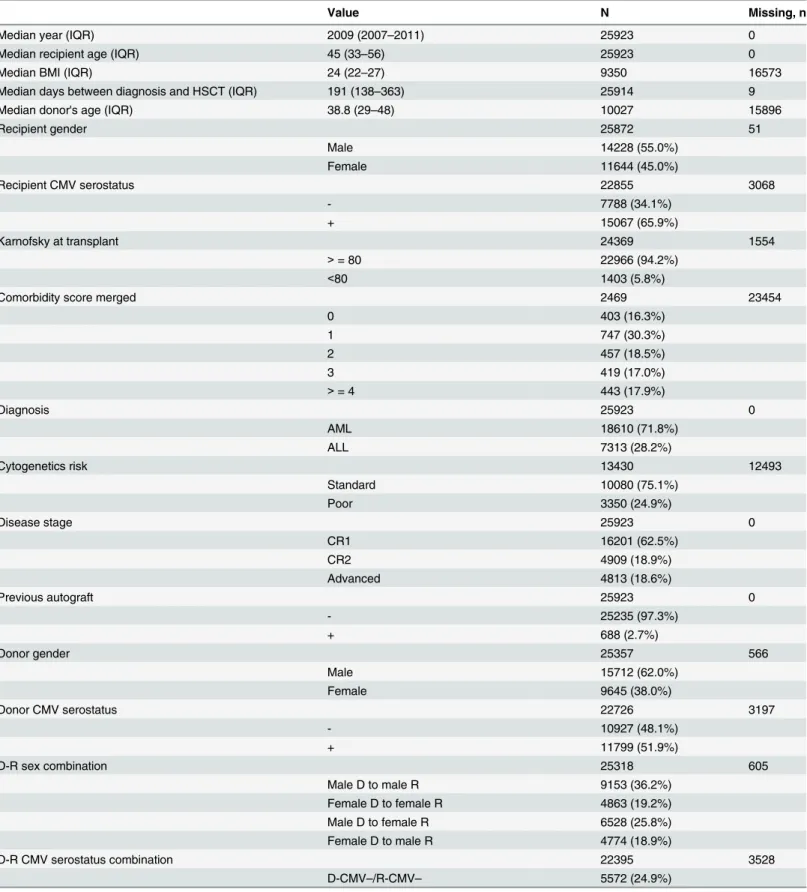
Table 1. Patient Characteristics. Interquartile range (IQR), Body mass index (BMI), Recipient (R), Donor (D), Cytomegalovirus (CMV), Acute lymphoblastic leukemia (ALL), Total body irradiation (TBI), Graft versus host disease (GVHD), Antithymocyte globulin (ATG), Peripheral blood (PB), Bone marrow (BM)
Value N Missing, n
Median year (IQR) 2009 (2007–2011) 25923 0
Median recipient age (IQR) 45 (33–56) 25923 0
Median BMI (IQR) 24 (22–27) 9350 16573
Median days between diagnosis and HSCT (IQR) 191 (138–363) 25914 9
Median donor's age (IQR) 38.8 (29–48) 10027 15896
Recipient gender 25872 51 Male 14228 (55.0%) Female 11644 (45.0%) Recipient CMV serostatus 22855 3068 - 7788 (34.1%) + 15067 (65.9%) Karnofsky at transplant 24369 1554 > = 80 22966 (94.2%) <80 1403 (5.8%)
Comorbidity score merged 2469 23454
0 403 (16.3%) 1 747 (30.3%) 2 457 (18.5%) 3 419 (17.0%) > = 4 443 (17.9%) Diagnosis 25923 0 AML 18610 (71.8%) ALL 7313 (28.2%) Cytogenetics risk 13430 12493 Standard 10080 (75.1%) Poor 3350 (24.9%) Disease stage 25923 0 CR1 16201 (62.5%) CR2 4909 (18.9%) Advanced 4813 (18.6%) Previous autograft 25923 0 - 25235 (97.3%) + 688 (2.7%) Donor gender 25357 566 Male 15712 (62.0%) Female 9645 (38.0%) Donor CMV serostatus 22726 3197 - 10927 (48.1%) + 11799 (51.9%) D-R sex combination 25318 605 Male D to male R 9153 (36.2%) Female D to female R 4863 (19.2%) Male D to female R 6528 (25.8%) Female D to male R 4774 (18.9%) D-R CMV serostatus combination 22395 3528 D-CMV–/R-CMV– 5572 (24.9%) (Continued)
myeloablative conditioning (MAC) (66.2%). Grafts from matched sibling donors were used in
47.6% of patients. Graft source was mainly peripheral blood (84.1%). NRM and overall
mortal-ity prevalence at day 100, were 9.2% (n = 2,387) and 12.7% (n = 3,280) respectively. Whereas
9.8% (n = 2,539) of patients relapsed before 100 days. They were consequently considered as
no NRM at day100. The parameter optimization and experimental datasets were similar in
terms of baseline characteristics (Table B in
S1 File
).
Sample size effect on prediction
Day 100 NRM prediction models were developed with 6 ML algorithms on an expanding
patient population (110
–22,035 patients) sampled from the experimental dataset. When
mod-els were developed on all available patients, AUCs ranged from 0.64 for the MLP algorithm to
0.67 for the LR and AdaBoost algorithms (
Fig 2
and Table C in
S1 File
). Depending on the
algo-rithm, predictive performance plateaued on a sample size of 6,611–8,814 patients. Samples
Table 1. (Continued)
Value N Missing, n
D-CMV+/R-CMV–or D-CMV–/R-CMV+ 8917 (39.8%) D-CMV+/R-CMV+ 7906 (35.3%)
Donor type 25923 0
HLA matched unrelated donor 13585 (52.4%) HLA identical sibling 12338 (47.6%)
HLA match degree 9090 16833
10/10 6519 (71.7%)
9/10 2068 (22.8%)
<9/10 503 (5.5%)
Source of stem cells 25923 0
BM 4109 (15.9%) PB or BM+PB 21814 (84.1%) Conditioning 25420 503 MAC 16836 (66.2%) RIC 8584 (33.8%) TBI 25742 181 No 15042 (58.4%) Yes 10700 (41.6%) GVHD prevention 23228 2695
Ex-vivo T cell depletion 800 (3.4%) In-vivo T cell depletion 9825 (42.3%) No T cell depletion 12603 (54.3%)
Relapse at day 100 25923 0
- 23384 (90.2%)
+ 2539 (9.8%)
Non relapse related mortality at day 100 25923 0
- 23536 (90.8%)
+ 2387 (9.2%)
Overall mortality at day 100 25923 0
- 22643 (87.3%)
+ 3280 (12.7%)
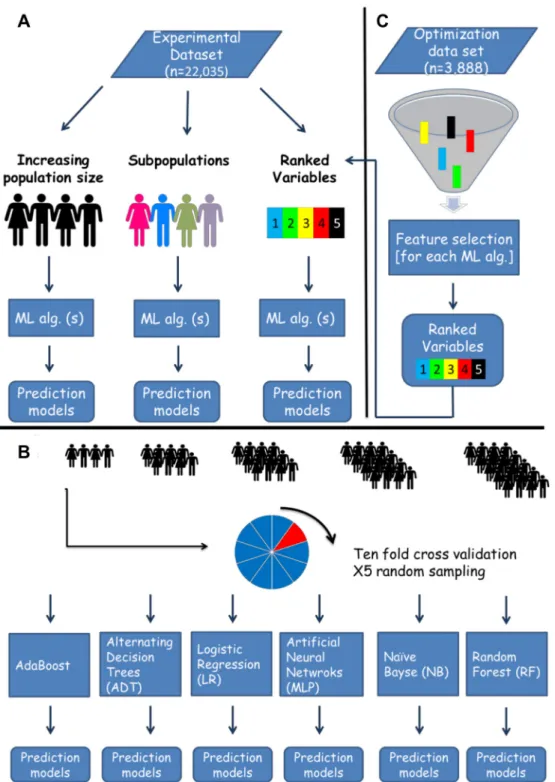
Fig 1.In-silico predictive modeling- experimental design. The original dataset was randomly split into an optimization and experimental datasets. The former was used for tuning of machine learning algorithms and feature selection. A. Several experiments were run on the experimental dataset, testing the effects of population size, specific subpopulations and number of variables included on predictive performance. B. A detailed explanation of the increasing population size experiment displayed in panel A. Patients were randomly sampled from the experimental dataset, creating samples with an expending size, which were later introduced to six machine learning algorithms. For each sample a prediction model for day 100 NRM was developed, and performance was measured through the area under the receiver operating curve (AUC). Models were trained and tested with 10 fold cross validation. The sampling process was repeated 5 times. C. For estimation of variable importance (ranked variables experiment in panel A) and the number of variables necessary for optimal prediction of day 100 NRM, we ran a feature selection algorithm on the optimization
consisting of 551 patients or less, demonstrated poor performance with AUCs ranging from
0.56
–0.59.
Sub-population effect on prediction
Prediction models were developed for specific subsets of patients, and performance was
com-pared with models developed on the whole population (
Table 2
). Performance was significantly
lower for the various disease stage subpopulations (e.g., for CR2 AUC ranged from 0.55–0.59)
and for patients transplanted from HLA matched unrelated donors. Prediction models
devel-oped on the remaining subpopulations had similar performance to models develdevel-oped using all
available patients.
set. Variables were ranked according to their predictive contribution to each algorithm. The next step involved serial introduction of the variables, according to their importance to six machine learning algorithms which were applied on the experimental dataset. In each iteration a prediction model for day 100 NRM was trained and test with 10 fold cross validation. For instance in the first iteration the top ranking variable was introduced, in the second the top 2 variables and so on until all 23 variables were used. Performance was estimated according to the AUC. Machine learning (ML), Algorithm (Alg).
doi:10.1371/journal.pone.0150637.g001
Fig 2. Predictive performance of day 100 NRM prediction models with increasing sample size. A gradually increasing sample from the experimental dataset was introduced to 6 machine learning algorithms. Prediction models were developed for each incremental step and their discriminative performance is plotted on the Y axis. Alternating decision tree (ADT), Logistic regression (LR), Multilayer perceptron (MLP), Naïve base (NB), Random forest (RF). doi:10.1371/journal.pone.0150637.g002
Variable importance
When the feature selection process was applied on the optimization set, disease stage, donor
type and conditioning were consistently the 3 top ranking variables across all day 100 NRM
prediction models (
Fig 3
). The mean variable rankings of time from diagnosis to transplant,
recipient age, and diagnosis were 4
–6, respectively. However, standard deviation was
consider-ably high, as their importance varied between algorithms.
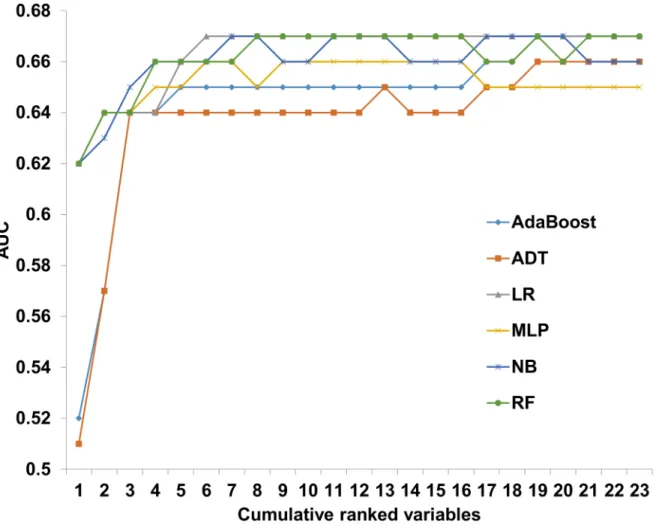
To assess the relationship between models' performance and the number of variables
incor-porated into them, the ranked variables were serially introduced to the 6 ML algorithms. The
algorithms were applied on the experimental dataset. Starting from the top ranking variables,
gradually adding variables with lower ranking, prediction models for day 100 NRM were
itera-tively constructed (
Fig 1
). The maximal predictive performance ranged from 0.65
–0.67, with
LR and MLP achieving their optimal AUC with only 6 variables (
Fig 4
). When introduced with
the 3 top ranking variables all models achieved an AUC of 0.64.
Discussion
Eligibility of patients with acute leukemia for allogeneic HSCT is based on a risk
benefit-assess-ment of the relapse risk versus NRM risk [
24
]. Risk scores for transplant associated mortality
have been developed based on retrospective registry data. A large HSCT registry was explored,
while automatizing the prediction model development processes, creating thousands of
mod-els, depending on the questions asked. We show that for day 100 NRM prediction various
models, developed on the basis of 6 popular ML algorithms, reach approximately the same
per-formance. With data commonly collected, saturation of predictive performance requires very
few variables, but large datasets.
The nature of association between predictors and response, the data’s quality and
dimensionality (i.e., number of variables analyzed), and the number of events per outcome, all
affect the sample size necessary for generation of a robust and generalizable prediction model
Table 2. Predictive performance of day 100 NRM prediction models on varying subpopulations.
AdaBoost ADT LR MLP NB RF Average
performance Sample Size AUC STDV AUC STDV AUC STDV AUC STDV AUC STDV AUC STDV AUC STDV Full dataset 22035 0.67 0.02 0.66 0.02 0.67 0.02 0.63 0.01 0.65 0.02 0.66 0.02 0.66 0.01 Age<45 10820 0.66 0.03 0.65 0.03 0.66 0.03 0.64 0.02 0.65 0.03 0.66 0.03 0.65 0.01 Age> = 45 11215 0.66 0.03 0.65 0.03 0.66 0.03 0.64 0.02 0.65 0.03 0.65 0.03 0.65 0.01 ALL 6214 0.65 0.04 0.64 0.04 0.66 0.04 0.64 0.02 0.64 0.03 0.65 0.03 0.65 0.01 AML 15821 0.67 0.02 0.66 0.03 0.67 0.02 0.65 0.02 0.65 0.02 0.66 0.02 0.66 0.01 CR1 13787 0.63 0.03* 0.61 0.03* 0.64 0.03* 0.63 0.02 0.61 0.03* 0.62 0.03* 0.62 0.01 CR2 4165 0.58 0.05* 0.55 0.04* 0.59 0.05* 0.59 0.03* 0.58 0.05* 0.58 0.05* 0.58 0.01 Advanced 4083 0.62 0.04* 0.61 0.04v 0.61 0.04v 0.59 0.03v 0.6 0.03* 0.61 0.04* 0.61 0.01 MAC 14754 0.66 0.02 0.65 0.02 0.66 0.02 0.63 0.02 0.65 0.02 0.66 0.02 0.65 0.01 RIC 7703 0.67 0.03 0.66 0.03 0.67 0.03 0.66 0.02 0.65 0.03 0.66 0.03 0.66 0.01 MRD 10458 0.65 0.03 0.64 0.03 0.66 0.03 0.65 0.03 0.65 0.03 0.65 0.03 0.65 0.01 MUD 11577 0.64 0.02* 0.63 0.03* 0.64 0.03* 0.62 0.02 0.62 0.03* 0.63 0.02* 0.63 0.01 * p-value <0.05 (t-test), Performance of reach model was compared with the performance of the model developed on the full experimental dataset, with the designated algorithm. Standard deviation (STDV), Alternating decision tree (ADT), Logistic regression (LR), Multilayer perceptron (MLP), Naïve base (NB), Random forest (RF), HLA matched related donor (MRD), HLA matched unrelated donor (MUD).
[
15
]. Hence, predetermination of the sample size is a matter of empirical testing, rather than a
standardized calculation. Using repetitive computerized simulations, we demonstrate that with
marginal differences between algorithms, approximately 6,000 patients were needed to achieve
maximal or near-maximal predictive performance. Defining a strict cutoff for modeling studies
would be erroneous, as the data’s features differ between cohorts. However, a rather solid
assumption based on the presented results on
“real world” data, would be the need to include
thousands of patients when aiming to develop and validate similar modeling problems.
Iterative development of prediction models for specific subpopulation has drawn attention
to the different disease stage groups. Performance was lowest for the CR2 group, with an AUC
ranging from 0.53–0.58. Low performance, but to lesser extent, was also noted for the other
dis-ease stage groups. Disdis-ease stage is highly predictive of day 100 NRM. Thus, it is not surprising
that when disease stage was excluded from the pool of variables considered for prediction,
per-formance declined, as it is highly informative.
Prospects for cure are higher for patients in CR1 compared to other disease stages. Hence,
estimation of NRM risk is of special interest in this group, as non-transplant alternatives exist
[
25
–
27
]. Versluis et al., have addressed such a population receiving reduced intensity
condi-tioning. When looked upon separately, the Hematopoietic Cell Transplantation-Specific
Comorbidity Index (HCT-CI) and EBMT score were not predictive of NRM, corroborating the
Fig 3. Mean variable ranking of day 100 NRM prediction models. Variable importance were extracted using a feature selection algorithm for 6 machine learning prediction models of day 100 NRM. The circle marks the mean ranking of each variable and the bars describe 2 standard deviations. Disease stage (Ds_Stage); Time from transplant to diagnosis (Time_dx); Diagnosis (Dx); Body mass index (BMI); Donor (D); Recipient (R); Previos autograft (2nd_tx); # of HLA mismatches (#HLA_miss); Graft versus host disease prophylaxis (GVHD_prox); Total body irradiation (TBI);
challenge we encountered. A new score, based on integrated feature of the comorbidity index
and EBMT score, was constructed achieving an AUC of 0.68 [
8
].
It should be noted that most algorithms reached an AUC of 0.65 using only 3–5 variables.
Adding more variables led to a modest improvement, which translates to marginal clinical
sig-nificance. The top 3 ranking variables, shared by all algorithms were disease stage, donor type,
and conditioning. Transplanters will not be surprised by these determinants, which have been
validated repeatedly [
28
,
29
]. Predictive weight attributed to other features varied considerably
between models, leading at best to modest increment in predictive accuracy. Traditional HSCT
prognostic studies, rely on a collection of variables similar to the one presented. Thus, effective
prediction of individualized NRM is unlikely to substantially improve. Incorporation of the
HCT-CI score holds promise. However, even when applied separately or in combination with
other features, the comorbidity index reaches a maximal AUC of 0.7 [
4
,
7
,
8
,
30
–
32
]. In other
words, contemporary prognostic models are suitable for risk stratification rather than outcome
prediction. The discovery of additional prognostic markers, the incorporation of electronic
medical records to routine clinical use, and the addition of biological and genetic data to
infor-mation gathered on leukemia patients, offers great opportunities for model improvement
[
33
,
34
].
Fig 4. Predictive performance of day 100 NRM prediction models on a cumulative ranked variable list. Alternating decision tree (ADT); Logistic regression (LR); Multilayer perceptron (MLP); Naïve base (NB); Random forest (RF);
Mortality following transplantation is likely the result of a complex network of interactions
and non-linear associations. Hence, the Occam's razor concept, where the simplest solution is
the best solution, might not hold for prediction of transplantation outcomes. Exploiting the
abundance of data now available on transplant patients, could potentially improve prediction
models
’ applicability. Novel modeling techniques such as ML [
35
,
36
], enabling
non-parsimo-nious incorporation of a high number of variables, are warranted. These methods could
poten-tially improve accuracy, but interpretability might be lost.
The EBMT-ADT prediction model marked the entrance of the data mining methodology
into HSCT prognostic research [
9
,
22
]. The aim of the ADT study was development of a
pre-diction model for overall mortality at 100 days following allogeneic HSCT in acute leukemia
patients. Though using a data mining methodology, the perspective of the current study was
not prediction
per-se, but rather an analysis of the predictive modeling process and its
bound-aries, while focusing on NRM at day 100 as the objective. Thousands of prediction models,
with varying algorithms, were developed and evaluated in order to discover elements that
could improve future models. The
in-silico experimental system allowed us to dissect the
con-ditions under which the models were developed and the corresponding performance. Thus,
providing methodological and clinical insights regarding sample size, modeling technique, and
variable importance.
The study carries several limitations. First, it is a retrospective analysis susceptible to data
selection and measurement biases. However, the registry analyzed reflects real world data,
hence conveying contemporary practice. Second, a few variables suffered from a large amount
of missing values. That being said, ML algorithms allow prediction of the outcome of interest
without strong assumptions regarding the distribution and missingness, In addition, we show
that when discarding variables with more than 15% missing values, prediction does not
improve (Table D in
S1 File
). Third, we focus on short term data- day 100 NRM, rather than
long term mortality. We believe that the high rate of day 100 NRM (9.2%) makes it a valid
objective. Moreover, prediction of long term outcomes might be expected to give lower
perfor-mance, as more parameters come into play. Hence, the concepts presented should be applicable
to modeling distant outcomes. Fourth, we relate to prediction of day 100 NRM as a simple
clas-sification task, disregarding the time to event effect. However, given the large sample size,
dis-regarding censored data (1.3%) is unlikely to have impact on performance.
Conclusion
The
in-silico approach is a novel experimental system utilizing machine learning algorithms,
for empirical estimation of prediction boundaries in HSCT. Several clinical and methodological
lessons have been learned by the suggested approach. Large registry studies, involving
thou-sands of patients are necessary for development of robust prediction models, as performance of
different algorithms converged when sampling more than 6,000 patients. In addition, an
exhaustive search for variable importance, reveal that few variables "carry the weight" with
regard to predictive influence. Potential bias of the presented approach include: data quality
issues and selection of a short term rather than a long term outcome. Overall, it appears that
when using traditional HSCT data, a point of predictive saturation has been reached.
Improv-ing performance will likely require additional types of input like genetic, clonal and biologic
factors.
Supporting Information
S1 File. Appendix A in S1 File: Variables’ Definitions. Appendix B in S1 File: Machine
Learn-ing Algorithms. Appendix C in S1 File: Feature Selection. Table A in S1 File: Algorithms'
parameters. Table B in S1 File: Comparison between variables in the optimization and
experi-mental datasets. Table C in S1 File: Predictive performance of day 100 NRM prediction models
with increasing sample size. Table D in S1 File: Predictive performance of day 100 NRM
pre-diction models discarding variables with prevalent missing values.
(DOCX)
Acknowledgments
R.S. is a PhD candidates at Bar-Ilan University, Ramat-Gan, Israel, and this work is submitted
in partial fulfillment of the requirement for the PhD. This work has been supported by a grant
from the Shalvi Fund for Internal Medicine Research, Israel.
Author Contributions
Conceived and designed the experiments: RS AN. Performed the experiments: RS ML.
Ana-lyzed the data: RS RU AN. Contributed reagents/materials/analysis tools: RS ML RU SG FC CS
JE FB NG BS AS MM AN. Wrote the paper: RS RU AN.
References
1. Copelan EA. Hematopoietic stem-cell transplantation. The New England journal of medicine. 2006; 354 (17):1813–26. PMID:16641398.
2. Gratwohl A, Hermans J, Goldman JM, Arcese W, Carreras E, Devergie A, et al. Risk assessment for patients with chronic myeloid leukaemia before allogeneic blood or marrow transplantation. Chronic Leukemia Working Party of the European Group for Blood and Marrow Transplantation. Lancet. 1998; 352(9134):1087–92. PMID:9798583.
3. Gratwohl A, Stern M, Brand R, Apperley J, Baldomero H, de Witte T, et al. Risk Score for Outcome After Allogeneic Hematopoietic Stem Cell Transplantation A Retrospective Analysis. Cancer. 2009; 115(20):4715–26. doi:10.1002/cncr.24531WOS:000270740900011. PMID:19642176
4. Barba P, Martino R, Perez-Simon JA, Fernandez-Aviles F, Castillo N, Pinana JL, et al. Combination of the Hematopoietic Cell Transplantation Comorbidity Index and the European Group for Blood and Mar-row Transplantation score allows a better stratification of high-risk patients undergoing reduced-toxicity allogeneic hematopoietic cell transplantation. Biol Blood Marrow Transplant. 2014; 20(1):66–72. doi:
10.1016/j.bbmt.2013.10.011PMID:24141006.
5. Nakaya A, Mori T, Tanaka M, Tomita N, Nakaseko C, Yano S, et al. Does the Hematopoietic Cell Trans-plantation Specific Comorbidity Index (HCT-CI) Predict TransTrans-plantation Outcomes? A Prospective Mul-ticenter Validation Study of the Kanto Study Group for Cell Therapy. Biol Blood Marrow Transplant. 2014; 20(10):1553–9. doi:10.1016/j.bbmt.2014.06.005PMID:25034961.
6. Parimon T, Au DH, Martin PJ, Chien JW. A risk score for mortality after allogeneic hematopoietic cell transplantation. Annals of internal medicine. 2006; 144(6):407–14. PMID:16549853.
7. Raimondi R, Tosetto A, Oneto R, Cavazzina R, Rodeghiero F, Bacigalupo A, et al. Validation of the Hematopoietic Cell Transplantation-Specific Comorbidity Index: a prospective, multicenter GITMO study. Blood. 2012; 120(6):1327–33. PMID:22740454. doi:10.1182/blood-2012-03-414573
8. Versluis J, Labopin M, Niederwieser D, Socie G, Schlenk RF, Milpied N, et al. Prediction of non-relapse mortality in recipients of reduced intensity conditioning allogeneic stem cell transplantation with AML in first complete remission. Leukemia. 2015; 29(1):51–7. doi:10.1038/leu.2014.164
WOS:000347673700006. PMID:24913728
9. Shouval R, Labopin M, Bondi O, Mishan-Shamay H, Shimoni A, Ciceri F, et al. Prediction of Allogeneic Hematopoietic Stem-Cell Transplantation Mortality 100 Days After Transplantation Using a Machine Learning Algorithm: A European Group for Blood and Marrow Transplantation Acute Leukemia Working Party Retrospective Data Mining Study. Journal of Clinical Oncology. 2015:JCO. 2014.59. 1339. 10. Breiman L. Statistical modeling: The two cultures (with comments and a rejoinder by the author).
Statis-tical Science. 2001; 16(3):199–231.
11. Shouval R, Bondi O, Mishan H, Shimoni A, Unger R, Nagler A. Application of machine learning algo-rithms for clinical predictive modeling: a data-mining approach in SCT. Bone marrow transplantation. 2014; 49(3):332–7. doi:10.1038/bmt.2013.146PMID:24096823
12. Shouval R, Nagler A, Labopin M, Unger R. Interpretable Boosted Decision Trees for Prediction of Mor-tality Following Allogeneic Hematopoietic Stem Cell Transplantation. J Data Mining Genomics Proteo-mics. 2015; 6(4):2.
13. /MED-AB Forms Manual: http://www.ebmt.org/Contents/Data-Management/Registrystructure/MED-ABdatacollectionforms/Documents/MED-ABFormsManual.pdf.
14. Collins GS, Reitsma JB, Altman DG, Moons KG. Transparent reporting of a multivariable prediction model for individual prognosis or diagnosis (TRIPOD): the TRIPOD Statement. BMC medicine. 2015; 13(1):1.
15. Moons KG, Altman DG, Reitsma JB, Ioannidis JP, Macaskill P, Steyerberg EW, et al. Transparent Reporting of a multivariable prediction model for Individual Prognosis Or Diagnosis (TRIPOD): explana-tion and elaboraexplana-tion. Annals of internal medicine. 2015; 162(1):W1–W73. doi:10.7326/M14-0698
PMID:25560730
16. Breiman L. Random Forests. Machine Learning. 2001; 45(1):5–32.
17. Freund Y, Mason L, editors. The alternating decision tree learning algorithm. ICML; 1999.
18. Freund Y, Schapire R, Abe N. A short introduction to boosting. Journal-Japanese Society For Artificial Intelligence. 1999; 14(771–780):1612.
19. Han J, Kamber M, Pei J. Data Mining: Concepts and Techniques. 3rd ed: Morgan Kaufmann; 2012. 20. Hastie T, Tibshirani R, Friedman J, Hastie T, Friedman J, Tibshirani R. The elements of statistical
learn-ing: Springer; 2009.
21. Krogh A. What are artificial neural networks? Nature biotechnology. 2008; 26(2):195–7. PMID:
18259176. doi:10.1038/nbt1386
22. Shouval R, Bondi O, Mishan H, Shimoni A, Unger R, Nagler A. Application of machine learning algo-rithms for clinical predictive modeling: a data-mining approach in SCT. Bone marrow transplantation. 2014; 49(3):332–7. doi:10.1038/bmt.2013.146PMID:24096823.
23. Hall MA, Holmes G. Benchmarking attribute selection techniques for discrete class data mining. Knowl-edge and Data Engineering, IEEE Transactions on. 2003; 15(6):1437–47.
24. Cornelissen JJ, Gratwohl A, Schlenk RF, Sierra J, Bornhauser M, Juliusson G, et al. The European LeukemiaNet AML Working Party consensus statement on allogeneic HSCT for patients with AML in remission: an integrated-risk adapted approach. Nature reviews Clinical oncology. 2012; 9(10):579–90. doi:10.1038/nrclinonc.2012.150PMID:22949046.
25. Cornelissen JJ, van Putten WL, Verdonck LF, Theobald M, Jacky E, Daenen SM, et al. Results of a HOVON/SAKK donor versus no-donor analysis of myeloablative HLA-identical sibling stem cell trans-plantation in first remission acute myeloid leukemia in young and middle-aged adults: benefits for whom? Blood. 2007; 109(9):3658–66. doi:10.1182/blood-2006-06-025627PMID:17213292. 26. Koreth J, Schlenk R, Kopecky KJ, Honda S, Sierra J, Djulbegovic BJ, et al. Allogeneic stem cell
trans-plantation for acute myeloid leukemia in first complete remission: systematic review and meta-analysis of prospective clinical trials. Jama. 2009; 301(22):2349–61. PMID:19509382. doi:10.1001/jama.2009. 813
27. Yanada M, Matsuo K, Emi N, Naoe T. Efficacy of allogeneic hematopoietic stem cell transplantation depends on cytogenetic risk for acute myeloid leukemia in first disease remission: a metaanalysis. Can-cer. 2005; 103(8):1652–8. doi:10.1002/cncr.20945PMID:15742336.
28. Socié G, Stone JV, Wingard JR, Weisdorf D, Henslee-Downey PJ, Bredeson C, et al. Long-term sur-vival and late deaths after allogeneic bone marrow transplantation. New England Journal of Medicine. 1999; 341(1):14–21. PMID:10387937
29. Gratwohl A, Stern M, Brand R, Apperley J, Baldomero H, de Witte T, et al. Risk score for outcome after allogeneic hematopoietic stem cell transplantation: a retrospective analysis. Cancer. 2009; 115 (20):4715–26. PMID:19642176. doi:10.1002/cncr.24531
30. Sorror ML, Giralt S, Sandmaier BM, De Lima M, Shahjahan M, Maloney DG, et al. Hematopoietic cell transplantation specific comorbidity index as an outcome predictor for patients with acute myeloid leu-kemia in first remission: combined FHCRC and MDACC experiences. Blood. 2007; 110(13):4606–13. doi:10.1182/blood-2007-06-096966PMID:17873123; PubMed Central PMCID: PMCPMC2234788. 31. Teixeira GM, Bittencourt H, de Macedo AV, Martinho GH, Colosimo EA, Rezende SM. Assessing the Influence of Different Comorbidities Indexes on the Outcomes of Allogeneic Hematopoietic Stem Cell Transplantation in a Developing Country. PloS one. 2015; 10(9):e0137390. doi:10.1371/journal.pone. 0137390PMID:26394228.
32. Sorror ML, Storb RF, Sandmaier BM, Maziarz RT, Pulsipher MA, Maris MB, et al. Comorbidity-age index: a clinical measure of biologic age before allogeneic hematopoietic cell transplantation. J Clin Oncol. 2014; 32(29):3249–56. doi:10.1200/JCO.2013.53.8157PMID:25154831; PubMed Central PMCID: PMCPMC4178523.
33. Dohner H, Weisdorf DJ, Bloomfield CD. Acute Myeloid Leukemia. The New England journal of medi-cine. 2015; 373(12):1136–52. doi:10.1056/NEJMra1406184PMID:26376137.
34. Lauer MS, D'Agostino RB Sr., The randomized registry trial—the next disruptive technology in clinical research? The New England journal of medicine. 2013; 369(17):1579–81. PMID:23991657. doi:10. 1056/NEJMp1310102
35. Ishwaran H, Kogalur UB, Blackstone EH, Lauer MS. Random survival forests. The Annals of Applied Statistics. 2008:841–60.
36. Hsich E, Gorodeski EZ, Blackstone EH, Ishwaran H, Lauer MS. Identifying important risk factors for sur-vival in patient with systolic heart failure using random sursur-vival forests. Circulation: Cardiovascular Quality and Outcomes. 2011; 4(1):39–45.