Deformation Mechanics of Quartz at a Single
Asperity under Hydrothermal Conditions
MASSACHUSETTS INSTITUTE
by
OF TECHNOLOCYSudhish Kumar Bakku
JUN 28 2010
B.Tech., Civil Engineering (2007)
LIBRARIES
Indian Institute of Technology Roorkee
Submitted to the Department of Earth Atmospheric and Planetary
Sciences
in partial fulfillment of the requirements for the degree of
Master of Science in Geophysics
at the
ARCHNES
MASSACHUSETTS INSTITUTE OF TECHNOLOGY
June 2010
@
Massachusetts Institute of Technology 2010. All rights reserved.
Author ... ... --- -. ...
Department of Earth Atmospheric and Planetary Sciences
February 16, 2010
Certified by...
...
Brian J. Evans
Professor
Thesis Supervisor
Accepted by ...
Maria Zuber
E. A. Griswold Professor of Geophysics,Department of Earth
Deformation Mechanics of Quartz at a Single Asperity under
Hydrothermal Conditions
by
Sudhish Kumar Bakku
Submitted to the Department of Earth Atmospheric and Planetary Sciences on February 16, 2010, in partial fulfillment of the requirements for the degree of
Master of Science in Geophysics
Abstract
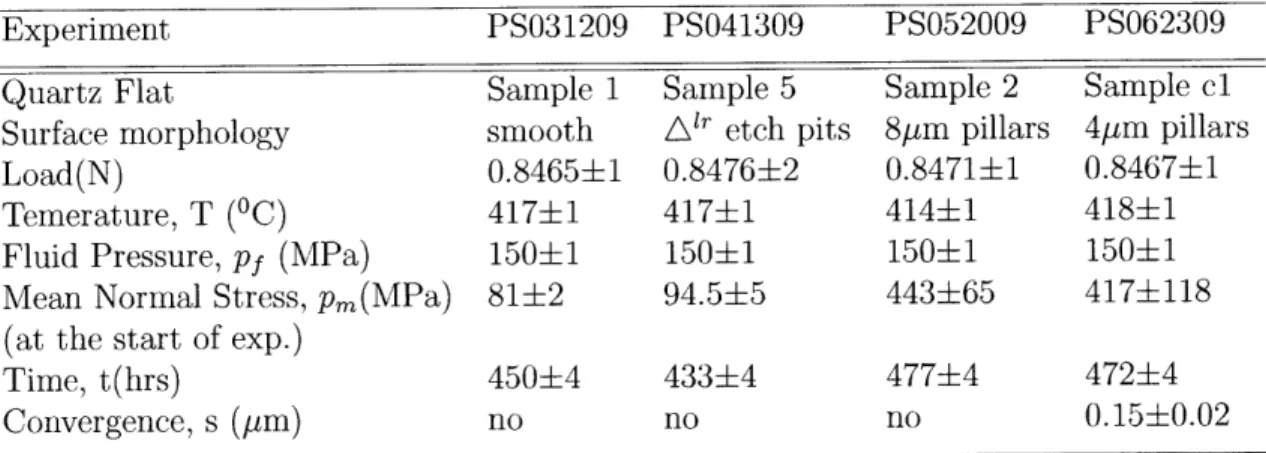
Pressure solution is a naturally occurring deformation process in fluid-bearing rocks, with implications for sediment consolidation rates and deformation in the mid to up-per crust. The process involves dissolution at asup-perities under load; diffusion along grain-to-grain contacts; and precipitation in the pore space. The kinetics of the pro-cess and the identity of the rate-limiting step in quartzose rocks are still a subject of debate and depend critically upon the structure of the inter-granular boundary during deformation. To investigate the mechanisms and kinetics of pressure solution and the effects of changes in boundary morphology, we continuously monitored deformation and the evolution of boundary morphology at a Y-cut convex quartz lens that was pressed against a flat surface of Y-cut quartz under hydrothermal conditions (4250C, 150 MPa fluid pressure, 80-435 MPa effective normal stress) in a see-through optical pressure vessel. The pore fluid was de-ionized water, which became saturated with quartz during the initial heat-up period. Several different boundary morphologies were used, including polished flats, etched and roughened flats, and an island-channel structure fabricated by plasma etching. The island-channel structure had square pil-lars of quartz, either 4[tm or 8pim on a side, surrounded by an inter-connected grid of open channels of comparable width. Deformation at the interface between the quartz flat and lens (i.e., inter-granular convergence) was observed in only one case: the 4pum island-channel structure. In that instance, pillars within the contact region were eroded at a rate that decreased with time, and SEM photomicrographs after the experiment showed significant cataclasis within and adjacent to the pillars. The total transient convergence (0.15i0.02pum) observed during the 472 hour period was less than the original pillar height (0.55±0.005pim). For all surface morphologies, the shapes of the surface structures in both the loaded and unloaded regions evolved, per-haps owing to capillarity forces. Although an inter-connected island-channel structure was initially imposed upon some of the experiments, this open, fluid-filled boundary structure was seen to be a transient phenomenon that was largely destroyed dur-ing convergence. Thus, there was no evidence for a dynamically stable interface, as previously suggested.
Thesis Supervisor: Brian J. Evans Title: Professor
Acknowledgments
I take this opportunity to express my gratitude to everyone who supported me, one way or the other, since I began my graduate studies at MIT. Your love, support and encouragement has made my experience here much more enjoyable and rewarding.
First and foremost, my sincere thanks to my advisor, Prof. Brian Evans, for showing faith in me and giving me this opportunity. His affable nature, constant encouragement at my success and an equal understanding at my failures has made my experience in lab much more rewarding.
I am very thankful to our collaborators, Dr. Stephan Hickman (USGS, Menlo Park), Prof. Yves Bernab6 (MIT) and Dr. Nick Beeler (USGS, Vancouver). They have been a constant source of motivation and encouragement, especially, in those moments of despair. I appreciate their time and patience, in guiding me. In particular, the discussions with Prof. Yves Bernabe and Dr. Stephan Hickman were insightful and thought provoking. I am also thankful for their invaluable suggestions to the thesis. I thank Prof. Alison Malcolm for accepting to be on the defense committee.
I especially thank Dr. Ulrich Molk (MIT) and Brian Kilgore (USGS, Menlo Park) for helping me with issues in the lab and Dr. Usha Raghuram (SNF, Stanford) for helping me with the fabrication process at SNF; I thank my lab-mate, Alejandra
Q
Terminel, for helping me with the photo-lithography process.I thank my labmates Nathaniel, Mirna, Alejandra and Hendrick for their company, support and invaluable friendship. I cherish the friendship of Vivek Raghunathan, Sumeet Kumar, Abishek Kashinath, Sami Alsaadan, Abdulaziz, Diego, Gabriela Melo, Nasruddin Nazerali, Bongani, Hussam, Yulia and many others at MIT. Special thanks to Carol A. Sprague, Kerin J. Willis and others at education office for making sure that I have a comfortable stay at MIT and taking care of me. I thank everyone for making me feel home at MIT and helping me remain sane at all times.
Most of all, I am greatly indebted to my parents, brother and family for their care and love. Thank you for believing in me and encouraging me at every step of my life.
Contents
1 Introduction 13 1.1 Motivation... . . . . . . . . .. 13 1.2 Problem Statement . . . . 18 2 Experimental Technique 19 2.1 Introduction ... .... ... 19 2.2 Sample Preparation... . . . . .. 23 2.3 Experimental Set-up ... . . . . . .. 27 3 Analysis 33 3.1 Convergence Measurement... . . . .. 333.2 Radius of Interference Minima... . . . . . . . . .. 36
3.3 Newton's Rings Pattern . . . . 37
3.4 Stress Estimation... . . . . . . . . 41
3.5 Refractive Index... . . . . . . . .. 46
3.6 Order Number of Interference Minima. . . . .. 46
4 Results 49 4.1 Contact Morphologies... . . . . . . . .. 50 4.2 Contact Stresses . . . . 52 4.3 Convergence. . . . . . . 54 4.4 F igures . . . . 56 7
5 Discussion and Conclusions 75
5.1 Discussion... . . . . . . . . . . 75
5.1.1 Grain Boundary Structure . . . . 75
5.1.2 Surface Damage . . . . 79 5.1.3 Deformation Mechanism.. . . . . . . . 80 5.2 Conclusions... ... . . . .. 83 6 Future Work 85 A Fabrication Process 87 B Sample Dimensions 91 Ref6rences 93
List of Figures
1-1 Illustration of pressure solution mechanism at a grain-grain contact
2-1 Plan view of the fabricated island-channel structures. . . . . ... 2-2 Profile view of the fabricated island-channel structures... 2-3 Schematic diagram of the experimental set-up. . . . ... 2-4 Schematic diagram of the lens geometry inside the pressure vessel . 3-1 Schematic diagram of profile separation... . . . . . . . . . 3-2 Comparison of observed and simulated interference patterns . . . . 3-3 Simulated interference patterns... . . . ... 3-4 Illustration of pillars within the contact for stress calculations . . . 3-5 Simulated stress profiles . . . .
Convergence plots for experiments PS031209 and PS052009 Convergence plots for experiment PS062309 . . . . Interferograms during experiment PS031209 . . . . Interferograms during experiment PS041309 . . . . Interferograms during experiment PS052009 . . . . Interferograms during experiment PS062309 . . . . Recovered contact region on Sample 1 . . . . Recovered contact region on Sample 5 . . . . Recovered contact region on Sample 2 . . . . Surface structure outside the contact region on Sample 2 Surface structure inside the contact region on Sample 2
. . . . 60 . . . . 61 . . . . 62 . . . . 63 . . . . 64 . . . . 65 . . . . 66 . . . . 66 . . . . 67 . . . . 68 . . . . 69 4-1 4-2 4-3 4-4 4-5 4-6 4-7 4-8 4-9 4-10 4-11
4-12 Recovered contact region on Sample cl . . . . 4-13 Deformed pillars on Sample cl . . . . 4-14 Deformed pillars on Sample c1 . . . . 4-15 Pillars outside the contact region in Sample ci . . 4-16 Crystallographic planes on the grown pillars .
5-1 Plot of compaction-rate Vs mean normal stress
A-I Fabrication procedure... . . . . . . . .
B-i Profile of fabricated island-channel structure .
. . . . 70 . . . . 71 . . . . 72 . . . . 73 . . . . 73 . . . . 82 . . . . 90 . . . . . 91
List of Tables
4.1 Summary of the experiments . . . . 50
5.1 Comparison of the island-channel structure parameters . . . . 78
5.2 Numerical values of parameters for PS creep models . . . . 81
Chapter 1
Introduction
1.1
Motivation
Rock deformation in the mid to upper crust is controlled by a variety of mecha-nisms including cataclastic processes such as fracturing or frictional grain sliding and rotation, and, relatively slow plastic processes like dislocation creep and pressure so-lution creep (Groshong, 1988). Pressure soso-lution creep is a stress-enhanced, soso-lution- solution-transfer mechanism, that slowly dissipates the strain energy accumulated during sed-imentation/burial/tectonic events. It involves dissolution at stressed, fluid-saturated, inter-granular contacts, diffusion along the contact and precipitation at relatively low stressed points in the pore space (see Figure 1-1). Pressure solution occurs at two different scales in nature: at the micro-scale, between grain-grain contacts (inter-granular pressure solution or IPS) and at the macro-scale, in the form of stylolites. Stylolites are insoluble seams of pyllosilicates that are thought to originate exclusively under non-hydrostatic conditions. They are very commonly found parallel to bed-ding planes in carbonates rocks. At both scales, pressure solution acts as a source of cement and an agent of compaction. It plays a significant role in porosity evolution and diagenetic compaction of rocks (Tada & Siever, 1989). Studies also suggest that pressure solution creep plays an important role in the strength and sliding behavior of faults, fault sealing, and, earthquake recurrence rates (Rutter & Mainprice, 1979 ; Bos et al., 2000 ; Hickman et al., 1995). The evidence for pressure solution in nature
is ubiquitous. Rocks from the upper to mid-crust in low metamorphic grade condi-tions exhibit clear evidence of fluid enhanced deformation: interpenetrating grains, stylolites, truncated fossils, tectonic overgrowths, striped cleavages, pressure shadows (Weyl, 1959 ; Trurnit, 1968 ; Rutter & Elliott, 1976 ; McClay, 1977 ; Tada & Siever, 1989). Quartz veins and slicken-fibers have been observed in exhumed faults (Durney & Ramsay, 1973 ; Cox & Paterson, 1991 ; Hickman et al., 1995).
Effective Normal Stre within contact it It t it ss Grain
trn
itr~Grain
Grain-Grain Boundary- 1) Stress driven dissolution along grain-grain contact
2) Diffusion along the grain-grain boundary, characterised by grain-boundary diffusivity
3) Diffusion in pore-space, characterised by free fluid diffusivity.
4) Precipitation at unstressed pore surface.
Figure 1-1: Illustration of pressure solution mechanism at a grain-grain contact Pressure solution was first described by Sorby (1863) and became widely accepted after the systematic analysis of Stockdale (1926, 1936). Interest in pressure solution was renewed after the pioneering work of Weyl (1959). Paterson (1973), Rutter & Elliott (1976) and De Boer (1977) discussed the thermodynamics of pressure solu-tion and attributed the driving force to the chemical potential difference between the stressed grain contact and relatively unstressed pore space. Later, Lehner (1985)
Pore Space ... ... .. .. ... .....4 ... .
and Shimizu (1995) introduced non-equllibrium thermodynamics to the problem. De-scriptions of mechanisms of pressure solution creep can be coarsely lumped into four different models: 1) fluid-film diffusion model, 2) island-channel model, 3) micro-cracking grain boundary model, and 4) under-cutting model.
Fluid-film diffusion model
The grain-grain boundary is assumed to be coated by a thin, structured, fluid film that supports the load and allows the material dissolved at the grain contacts to diffuse into the free pore space (Rutter & Elliott, 1976 ; Gratier & Guiguet, 1986 ; Hickman & Evans, 1995). The diffusivity in the film is often assumed to be less than that in a free fluid, but several orders greater than that in a dry grain-grain boundary. Diffusion through the grain-grain boundary is often assumed to be the rate-limiting mechanism in this model, which is adapted from the Coble creep law and has similar sensitivity to grain size and to stress. The volumetric strain rate is linearly proportional to the applied effective normal stress and inversely proportional to the cube of the grain size. Several experimental studies have appealed to this mechanism: Hickman & Evans (1995) monitored the evolution of the contact when a halite lens was pressed against fused silica. They concluded that diffusion is rate-limiting and estimated the film thickness to be less than 30 nm. Spiers et al. (1990) conducted compaction experiments on halite aggregates and concluded that diffusion is rate-limiting based on the observed grain size sensitivity. Experiments by Pashley (1981), Pashley & Israelachvili (1984) and Israelachvili (1986) suggest that such films can exist in silica, mica and alumina sheets. Nakashima (1995) found that the diffusivity of silica and oxygen ions in thin films is about 5 x 10-14m2
/s
at room temperature and estimated the activation energy to be 15-30 kJ/mol. Despite these studies, the existence of the fluid film and the values of the diffusivity in the film and the thickness of the film are still debated. There is no clear experimental evidence of the existence of such films during pressure solution creep of quartzose rocks under natural hydrothermal conditions.Island-channel model
Raj (1982) argued that fluid films cannot sustain shear stresses and proposed an island-channel structure that transmits the load through the islands and allows dif-fusion through the fluid in the channels. The diffusivity in the channels is assumed to be equal to the free fluid diffusivity and the interfacial kinetics (dissolution or pre-cipitation) are considered to be rate limiting (Raj, 1982 ; Schutjens, 1991 ; Niemeijer et al., 2002 ; Noort, Spiers, & Pennock, 2008). The volumetric strain rate is inversely proportional to the grain size and linearly proportional to the effective normal stress. The stress sensitivity is linear only at low effective normal stress and exponential at higher stress (Niemeijer et al., 2002 ; Gratier et al., 2009). Raj assumed the island-channels to be non-equilibrium structures, dynamically maintained, owing to entropy creation. Noort (2008) attempted to justify the existence of island-channel structures and introduced a yield stress criterion above which island-channel structures exist and below which they heal. Many authors have identified micro-structures recovered after the experiments that resemble the island-channel structures (Cox & Paterson, 1991 ; Gratier et al., 2005). However, the origin is often ambiguous. For example, such structures can be formed by the healing of grain boundary fractures during unloading (see discussion in Hickman & Evans (1991) ). Most of the experimental evidence (Schutjens, 1991 ; Niemeijer et al., 2002 ; Noort, Spiers, & Pennock, 2008) suggesting interfacial controlled pressure solution is based on estimation of a high activation energy (70-100 kJ/mol) and on micro-structure observations.
Micro-cracking grain boundary model
Gratz (1991) proposed a model that uses a hierarchical structure in which grain boundaries consist of islands coated by grain boundary films, separated by micro-cracks, and connected to inter-granular porosity. This model postulates that thin fluid-films exist at grain-grain contacts, but the diffusion rate along the thin films is not sufficient enough to cause geologically observed strain rates. Instead, the micro-cracks within the contact act as short-circuit paths for diffusion into the pore space,
enhancing deformation rates. Zubutsov (2005) conducted separate indenter experi-ments on halite and calcite at identical conditions and attributed the higher conver-gence rate in calcite, after correcting for difference in solubility, to the presence of micro-cracks beneath the indenter, in calcite.
Under-cutting model
In this model, the deformation is due to free surface dissolution at the edges of the contact and subsequent reduction in contact size leading to cataclastic failure (Bathurst, 1958 ; Weyl, 1959 ; Pharr & Ashby, 1981 ; Tada et al., 1987). This process is repeated, leading to time-dependent creep. Tada and Siever (1986) pressed a quartz knife against halite and observed under-cutting. On the other hand, Hickman & Evans (1995) did not observe undercutting in their halite-silica experiments. The under-cutting observed in Tada's experiment was due to the use of a sharp and rigid indenter that produces high stresses at the contact edges. Whereas, the contact geometries in Hickman & Evans (1995) experiments employed polished lenses, in which the highest stresses were in the center of the contact. Gratier's (2009) indenter experiments on quartz, using rectangular punch, also showed significant under-cutting, but grain boundary diffusion was identified as rate-limiting mechanism.
Pressure solution creep rates and the rate-limiting mechanisms are sensitive to the mineralogy of the solids in contact. Hickman & Evans (1991) did not observe pressure solution creep when a halite lens was pressed against halite. Rather, micro-structural evidence suggested healing of the grain boundary. They observed diffusion controlled pressure solution creep when halite was pressed against fused silica and a five fold increase in the convergence rates when a thin montmorillonite clay layer separated halite and silica (Hickman & Evans, 1995). This latter observation is consistent with the general observation from naturally deformed rocks and limited polycrystalline lab experiments that the presence of phyllosilicates enhances the pressure solution creep rates (Weyl, 1959 ; Rutter, 1983 ; Houseknecht & Hathon, 1987 ; Renard et al., 1997; Rutter & Wanten, 2000).
it is possible that no single mechanism is rate-limiting at all the conditions and at all stages of the deformation process. Creep laws in the literature (Rutter & Elliott, 1976 ; Gratz, 1991 ; Niemeijer et al., 2002 ; Noort, Spiers, & Pennock, 2008) have, so far, simplified the problem by attributing average parameters to govern the creep law, assuming a single rate-limiting step under steady-state conditions. These models can be considered macroscopic. Lehner (1995) worked towards a microscopic model which considered several processes operating concurrently along the grain boundary. Recently, Bernabe and Evans (2007) proposed a numerical scheme to monitor the evolution of a single asperity due to pressure solution, accounting for the variability of properties along the grain boundary. Although Bernab6 et al. did not make a priori assumptions about the distribution of stress along the contact, the numerical model considered only two of the many processes that might occur simultaneously in nature. Bernab6's simulations demonstrated that different processes are coupled and assuming a singe rate-limiting mechanism may not be correct.
1.2
Problem Statement
Despite considerable research on pressure solution, over the last few decades, the kinetics of the pressure solution process, identification of the rate-limiting mechanism and the nature of the inter-granular boundary during pressure solution (especially in quartzose rocks) is still not well understood. In this thesis, we focussed our attention on experimental studies of pressure solution creep at quartz-quartz grain contacts with controlled contact stresses and fluid chemistry and varied the structure at the contact to see the effect of morphology on pressure solution rates.
Chapter 2
Experimental Technique
2.1
Introduction
Experimental work on pressure solution (PS) creep often focuses on halite because sig-nificant strain rates can be achieved at relatively low temperatures (80 -90 0C) and low effective normal stresses (1-14 MPa) (Hickman & Evans, 1995). For example, Tada and Siever (Tada & Siever, 1986) pressed a quartz knife against halite and noted that under-cutting is the dominant mechanism. Later, (Hickman & Evans, 1995) system-atically studied PS at single grain-grain contacts between halite and fused silica, and established that diffusion is rate-limiting. Uniaxial compaction experiments by Spiers (1990) on halite aggregates also suggested that diffusion is rate-limiting.
In contrast, PS creep is slow in quartz and is active only at higher temperatures (above 3500C) and higher effective normal stresses (Schutjens, 1991). The fastest strain rates estimated for minerals composed of quartz deforming via PS in nature are of the order of 10-"/s (Rutter & Elliott, 1976) and observing such slow rates ex-perimentally is hard. Creep in the lab can be artificially expedited by using a alkaline solution (De Boer, 1977; Gratier & Guiguet, 1986) or working at higher temperatures (Cox & Paterson, 1991 ; Luan & Paterson, 1992) or at high normal stresses (Gratier et al., 2009), each having its own side effects. In a very different type of experiment, Sprunt and Nur (1977) demonstrated the stress dependence of solution transfer in quartz at a free-face subjected only to in-plane tangential stress, by loading quartz
slab containing a hole, under uniaxial compression perpendicular to the hole axis. They concluded that dissolution was rate limiting in this case of "free-face" pressure solution. De Boer (1977) compacted quartz aggregates uni-axially in a brine medium (3600C; 51 MPa effective pressure ) and showed micro-structural evidence for pres-sure solution. Gratier & Guiguet (1986) showed that the compaction rates increase with the concentration of NaOH in pore fluid and are inversely proportional to the grain size. He reported dissolution to be the rate-limiting step. Cox & Paterson (1991) conducted compaction experiments on quartz aggregates at elevated tempera-tures (12000 K, 100 MPa effective pressure ) and observed relatively high strain rates (10- 6
/s).
They interpreted the micro-structures to resemble island-channel structure and argued that interfacial kinetics were rate-limiting. Schutjens (1991) performed 1D compaction tests on quartz sands (150 - 3000C, 20.7 effective pressure, 20-100 Pim grain size ) and observed strain rates of 10- 8/s.
He reported an activation energy of 61-76 kJ/mol and wide-spread micro-cracking in the recovered micro-structures. He suggested that deformation is controlled by time-dependent micro-cracking be-low 3000C and interface-limited pressure solution above 3000C. Dewers & Hajash(1995) isostatically compacted aeolian quartz sand (150 - 2000C, 35 MPa effective pressure) and inferred that PS was the dominant mechanism, but was accompanied by time-dependent cataclasis at lower temperatures. Based on the activation en-ergy (73 kJ/mol), Dewers & Hajash (1995) concluded that interfacial kinetics was rate-limiting. The influence of clay on pressure solution rates in quartzose rocks was tested by a few authors. Rutter & Wanten (2000) observed an increase in compaction rates in phyllosilicate bearing sands (3000 - 4500C; 10-210 MPa effective pressure). However, Niemeijer (2002) did not observe any enhancement in creep rates when muscovite was added to the quartz aggregates, under similar conditions (5000C; 100 MPa effective pressure). The influence of clays has to be explored further. When not mentioned explicitly, the pore fluid was pure water in the above experiments.
Niemeijer (2002) studied pressure solution creep in quartz aggregates more sys-tematically. He conducted isostatic compaction experiments on quartz aggregates, varying the temperature (4000 - 6000C), effective pressure (50-150 MPa) and grain
size (30-100p in). He reported an activation energy of 77.6 kJ/mol, stress exponent of 3 and an inverse grain size dependence. Comparing these results with interface-controlled pressure solution rate laws and based upon his observed activation energy, he concluded that dissolution was rate-limiting. Noort (2008) arrived at the same conclusions from his isostatic compaction experiments on quartz aggregates (3-129pim initial grain size, 3000 - 6000C, 25-100 MPa effective pressure), but also, noted that micro-structures were dominated by micro-fracturing at low temperatures, giving way to pressure solution related micro-structures at higher temperatures. Karner (2003) and Chester (2004 ; 2007) monitored the acoustic emissions during compaction ex-periments on quartz aggregates at low temperatures (250 - 1500C). The cumulative number of acoustic emissions scaled with total volumetric strain and strongly suggest micro-cracking and frictional grain sliding. Though these experiments were conducted at relatively low temperatures, the results emphasize the role of cataclasis in aggregate experiments. He (2007) reported that micro-granulation at quartz grain boundaries resulted in production of high energy ultra-fine particles that enhanced dissolution (1500C; 34.5 MPa effective pressure).
Most data from aggregate compaction experiments in quartz suggest that inter-face kinetics are rate-limiting. But, most workers arrive at this conclusion by compar-ing their measured apparent activation energy (about 60-100 kJ/mol) with that for dissolution in quartz (61-105 kJ/mol) (Rimstidt & Barnes, 1980). However, these ac-tivation energies are comparable to the acac-tivation energy of sub-critical crack growth (Atkinson, 1984) and so, it is not straight forward to distinguish between the two mechanisms. In addition, it is likely that multiple mechanisms operate in the aggre-gate compaction experiments, complicating the interpretation of mechanical data.The complicated mechanisms present in the aggregate experiments suggest that simpler experiments with more controlled geometries might be useful. Indenter techniques offer simple geometries to study the problem.
Recently, Gratier (2009) published his work on indenter experiments on quartz, spanning a 10 year period. He pressed a steel indenter (200pm diameter) against a quartz single crystal in NaOH solution at 3500C and under differential stress
(uniax-ial stress - pore fluid pressure) varying from 25-350 MPa. He varied the orientation of the pressed surface, the NaOH concentration in the pore fluid and the nature of quartz (natural or synthetic). Unfortunately, he could not vary the indenter diam-eter and thus could not test the grain size sensitivity. In general, he observed more indentation rate with increasing NaOH concentration and an exponential dependence of indentation on differential stress. Based on the growth kinetics of different faces of quartz and comparing the observed strain rates with diffusion and dissolution con-trolled rate laws, he concluded that diffusion was rate-limiting. However, due to the flat-bottomed geometry of the indenter, there was considerable free-face dissolution and "en echelon" fractures formed around the indenter. In addition, his experiments involved interfaces (quartz-steel) which probably alter the kinetics (as observed for halite/silica contacts (Hickman & Evans, 1991) ). It is, thus, desirable to study single quartz-quartz contacts, to allow for a more direct comparison with mono-minerallic quartz aggregates deformed in nature and in the laboratory.
In this study, we monitored pressure solution at single quartz-quartz grain con-tacts by pressing a quartz plano-convex lens against a quartz plano-plano lens under hydrothermal conditions (4250C, 150 MPa fluid pressure), using dead quartz weights. This well-defined geometry allows us to estimate the stress field within the contact, to have control over diffusional path length and to monitor convergence and contact evolution in real time. In addition, this configuration does not induce high stress concentration at the contact edge, a situation which leads to free-face dissolution (Gratier et al., 2009). The experimental technique is very similar to that used by Hickman & Evans (1991, 1995). The mutual approach of the lenses is measured using optical interferometry, accurate to 0.02ptm.
The objective of the experiments was to see if quartz-quartz contacts healed or de-formed at hydrothermal conditions and to examine the effect of boundary morphology on the pressure solution creep rates.
2.2
Sample Preparation
The plano-convex lenses and the plano-plano lenses (referred to as quartz flats, or simply, flats) used in the experiments were Y-cut single crystals of synthetic alpha-quartz. The radius of curvature of the plano-convex lenses was 0.443 inch. The quartz flats were 0.7 inch in diameter and 0.25 inch in thickness. The lenses and flats were prepared and polished by Boston Piezo-Optics, Bellingham, MA, from the quartz crystals synthesized by Sawyer Research Products, Eastlake, OH.
As mentioned earlier, our goal was to examine the effect of surface morphology on PS rates. We used a smooth quartz flat in our first experiment, PS031209, as a control and then introduced more complicated surface structures in the later experiments. Some trial and error was necessary to achieve repeatable, well-characterized surface morphologies. We first attempted to fabricate an inter-connected grid of channels on the surface of the quartz flat by wet etching with 49% HF acid. A fine Ni wire mesh (2000 wires per inch, each wire 5pm thick) was laid over the flat surface of the quartz flat (sample 5) and gold was vapor deposited over it. Then, the Ni mesh was carefully removed leaving the surface exposed in a gridded pattern of straight lines matching the mesh pattern and size. The gold coating masked the remaining surface. The surface of the flat with the pattern on it was exposed to HF vapors by holding the surface at a distance 3mm away from 49% HF solution at 600C for 3.5 hrs. The etch rate was approximately 0.286pm/hr in a direction normal to the surface. We expected the exposed area to be etched, leaving a grid pattern of inter-connected channels with their depth proportional to the exposure time. But, the gold pattern was washed away and the surface exhibited anisotropy in the etch rates along different crystal directions. This resulted in triangular etch pits of comparable size all over the surface, with no grid pattern evident. Nevertheless, owing to the overall roughness of the surface produced, these features could have produced the desired effect: produce stress concentrations within the contact and provide short-circuit pathways for diffusive transport. We characterized the etched surface using a mechanical probe profiler, Talyscan 150. The etch pits were, on an average, 1±0.2pm
deep. This quartz flat (Sample 5) was used in the experiment PS041309.
To avoid anisotropy in the structure introduced by wet-etching, we next tried dry/plasma etching. The plasma is generated on ionizing the etchant gases in vacuum by using RF excitations. Because the plasma etch process uses a large energy, the effects of differences in the surface energy along different crystal directions on etching rates is negligible and do not cause anisotropic etching. Since plasma etches both the mask and the substrate, the plasma should be designed to selectively etch the substrate (here quartz). Ideally, we want the plasma to etch normal to the surface without undercutting the mask. The gases in the plasma and their ratio determine the selectivity of the process and the etch rates normal and parallel to the exposed surface. The masking material should adhere well to the surface, be resistant to the etching plasma, but be removed easily by a chemical treatment neutral to the substrate. We used Drytek4, an inductively coupled plasma etching machine, at Stanford Nano Fabrication Facility (SNF) to plasma /dry etch the quartz flats. The plasma etchant was a gaseous mixture of CHF3 (100 standard cubic centimeters per minute , sccm)
and 02 (10 sccm) ejected from an Al ionizing electrode. Drytek4 was operated at 150 mT (milli Torr) pressure, 150W power and 310-330V voltage. Chromuim(Cr) was chosen to be the masking material due to its good adhering property to oxides and low etch plasma rate. Standard Cr etchant (22% Ceric Ammonium Nitrate, 9% Acetic Acid, 69% water) was used to remove the Cr masking layer on top of the quartz flat after dry/plasma etching. The etch rate, normal to the surface, was observed to be approximately 1.2pm/hr.
The structure on 'Sample 2' was fabricated by dry/plasma etching as follows: A Ni mesh (1500 wires per inch, each wire 5.6pim thick) was laid on the flat surface of the quartz flat. The mesh was carefully removed after Cr deposition to leave a grid pattern of lines (approximately as wide as the thickness of the wires) as discussed earlier, while the rest of the surface was masked by Cr. This surface was then subjected to plasma etching. Quartz was etched all along the grid pattern of lines leaving inter-connected channels on the surface. The residual Cr, masking the space in between the channels, was removed by wet etching the sample with standard Cr etchant. Thus, we
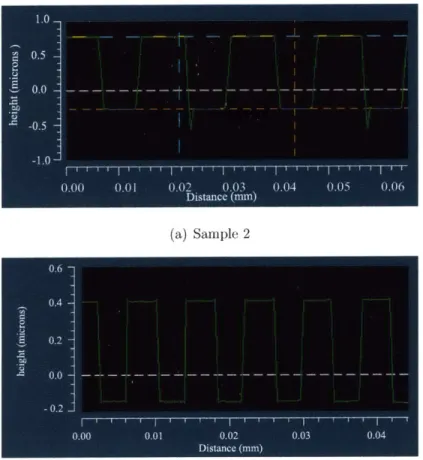
fabricated an island-channel structure of square pillars surrounded by interconnected grid of channels. The etched surface of the flat was characterised using Zygo White-Light 3D Surface Profiler, which is based on optical phase-shifting interferometry. In plan view, the top surfaces were slightly rounded (Figure 2-1(a)). The height of the pillars or the depth of the channels was 1.05t0.005pim and the channels were trapezoidal in cross section (Figure 2-2(a)). The average dimensions of the pillars and channels are tabulated in Table B.l'Sample 2' was used in experiment PS052009.
The plasma etching protocol was successful, but it was difficult to control the masking process when we used the Ni Mesh. Moreover, the width of the channels was limited by the Ni wire thickness. So, optical photolithography, a standard pro-cedure in semi-conductor manufacturing, was used to make the patterned Cr mask on subsequent samples. This method involves creating a pattern on photo-resist, a photosensitive material, by exposing it to light through a photo-mask, that carries the pattern, through the following process. First, the quartz flat was coated uniformly with Cr (thickness ~840 A'). A photo-resist was spun onto the Cr layer and then exposed to a pattern of grid of lines, using the photo-mask. The resist was then developed, uncovering the Cr layer beneath the pattern. The flat was then treated with standard Cr etchant, exposing the quartz surface through the grid pattern. The photo-resist on top of the remaining Cr layer was stripped to leave the sample with a Cr mask. The entire process is explained in detail in Appendix A. During exposure, we aligned the crystallographic c-axis of the quartz flats with the grid pattern on the photo-mask.
Using this photo-lithography process, we fabricated a 4pam wide, 0.5pm deep inter-connected grid of channels spaced 8pm center to center on four flats (Samples b2, ci, al and d) by etching the samples with plasma for 24 minutes. Similarly, we fabricated an 8[tm wide, 1pn deep interconnected grid of channels spaced 16pm center to center on four flats (Samples 2, b1, c2 and a2). These samples were plasma etched for 48 minutes. The etched surfaces of all these flats were characterised by Zygo White-Light 3D Surface Profiler. The actual dimensions of the fabricated structures were very close to the attempted values and are tabulated in Table B.1.
sd~eO~i
(b) Sample c1
Figure 2-1: Plan view of the fabricated island-channel structures
(a) Sample 2
(b) Sample el
Figure 2-2: Profile through the center of pillars along the grid, on (a) 'Sample 2' (b)
'Sample c1'
(a) Sample 2 ... gw :w . .. ... .. ... :M:yz --. ... ...*soose***
*Osseo***@
00seseess
ae . -icongo
ma
n
'Sample ci' was used in experiment PS062309. A plan view of the fabricated island channel structure on 'Sample ci', as measured by Zygo, is shown in Figure 2-1(b). A cross section along the centers of pillars is shown in Figure 2-2(b). The depth of the channels or the height of the pillars was 0.55±0.005pim. The dimensions of the surface structure are tabulated in Table B.1. The fabricated island-channel structures on 'Sample 2' and 'Sample c1' were oriented at an angle of 50 from the crystallographic c-axis despite our efforts to align them during fabrication.
2.3
Experimental Set-up
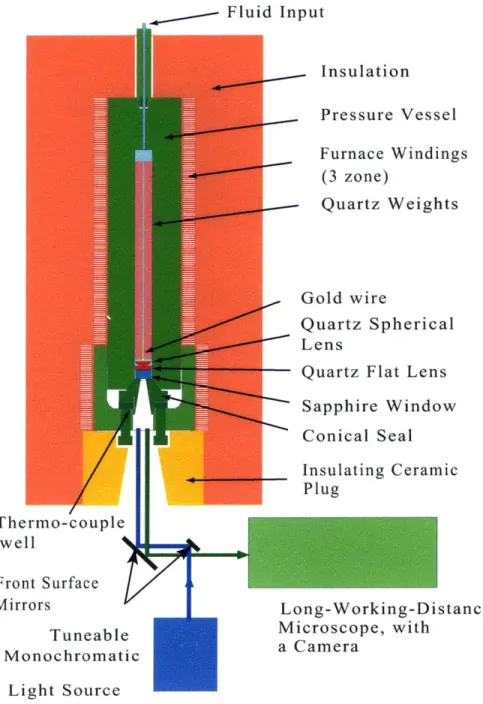
To measure the evolution of the quartz-quartz contacts, we pressed the convex side of the plano-convex quartz lens against a plano-plano quartz flat under hydrothermal conditions in a see-through optical pressure vessel. A constant normal load was ap-plied throughout the duration of the experiment (2-3 weeks) by means of quartz dead weights. The weights also served to maintain the fluid at maximum concentration of silica in experimental conditions. A schematic diagram of the apparatus is shown in Figure 2-3.
The pressure vessel (Beeler & Hickman, 2004) is an externally heated pressure vessel made up of Rene 41 (Inconel), with valves for inlet and outlet of fluid on the top and a cone-in-cone seal utilizing an Inconel seal at the bottom. We controlled the fluid pressure in the vessel, using a hydraulic pump, an inline pressure transducer, and a pressure gauge accurate to ±2 bars. A detachable three-coil furnace was used to maintain uniform temperature throughout the vessel. Thermocouples (accurate to t0.20C) were attached to the inner metal sleeve on which the three coils of the furnace were wound and provided input to three Omega furnace controllers that controlled input current to the coils. The temperature at the contact was monitored by a thermocouple inserted into a hole bored into the pressure vessel that was close to the samples. Furnace profiling conducted earlier shows that the actual temperature at the contact is within 100C of the measured value. The interior of the vessel was lined with gold to prevent corrosion and to control the fluid chemistry.
Inside the pressure vessel, the quartz weights were stacked on top of the quartz lenses, and were held in a coaxial position by a gold wire passing through a hole in the center of the cylindrical weights (Figure 2-4). The load was transferred onto the flat surface of the lens through the spherical tip at the end of the gold wire. This pressed the curved surface of the lens against the quartz flat, which sat over the observation sapphire window. The flat and the window were separated by a thin annular gold ring to avoid interference of light reflected from the bottom of quartz flat and the top of sapphire window. The sapphire window rested on a polished annular flat at the top of the conical seal with an intervening annealed gold washer, which deformed as the fluid pressure was increased and sealed the vessel. Figure 2-4 shows a schematic diagram of the lens geometry inside the pressure vessel and the loading mechanism.
A long working-distance microscope was equipped with a digital camera to monitor the evolution of the contact as the experiment proceeded (Figure 2-3). A mercury-zenon arc lamp in conjunction with a grating monocrometer was used as a tunable monochromatic light source, which operated over a range of wavelengths (360 nm to 600 nm). An 'AVT PIKE F-100 B' camera, operated at 60 fps and 1 mega pixel resolution, was used to take the photomicrographs in all the experiments, except the experiment PS031209, which used an older, analog camera and frame grabber card. The vessel and the optical equipment were placed on an air-suspension vibration isolation table during the experiment.
The quartz weights, lenses, sapphire window, gold ring, gold washer, gold wire and the conical seal of the vessel were cleaned with acetone, methanol and de-ionised water in an ultrasonic cleaner before assembly. The interior of the pressure vessel was also rinsed with acetone, methanol and de-ionised water. While assembling the pressure vessel, we first inserted the sample assembly and weights, filled the ves-sel with de-ionised water, sealed it and raised the confining pressure. The contact between the lenses was fully saturated with de-ionised water. After the vessel was pressurized (about 50 MPa), the furnace was lowered over the pressure vessel and the temperature was raised slowly from room temperature (220C) to the target temper-ature, while the pressure was manually controlled to achieve its final desired value.
This process was slow enough (about 4 hours) that the de-ionised water should have reached silica saturation by the time it reached run conditions through dissolution of the quartz weights (see discussion in Beeler & Hickman (2004)). The design pres-sure and temperature were 150 MPa and 4250C, respectively and were continuously recorded during each experiment. The pressure was maintained at 150±1 MPa. The temperature in the vessel, as measured by the thermocouple in the lower seal of the vessel, varied from experiment to experiment from 4140C to 4180C. During a single
Fluid Input
Thermo-couple
well
Front Surface
Mirrors
Pressure Vessel
Furnace Windings
(3 zone)
Quartz Weights
Gold wire
Quartz Spherical
Lens
Quartz
Flat LensSapphire Window
Conical Seal
Insulating Ceramic
Plug
Long-Working-Distance
Microscope, with
Monochromatic
Light Source
Quartz Weights
Gold Wire
Plano-convex quartz lens
Plano-Plano quartz lens
Gold ring
Sapphire Window
Gold washer
Direction of Viewing
(Figure not to scale)
Figure 2-4: Schematic diagram of the lens geometry inside the pressure vessel
... ...
Chapter 3
Analysis
3.1
Convergence Measurement
Convergence is defined as the relative approach of two distant reference points in the two lenses when they are pressed against each other, under the experimental conditions. When the load is applied, we expect an instantaneous convergence due to the initial elastic/plastic deformation. Creep mechanisms lead to a time-dependent convergence. Convergence is measured using the move-out of the interference minima in the Newton's rings pattern (Hickman & Evans, 1991, 1995). For example, in Hickman & Evan's (1991) halite-halite pressure solution experiments, neck growth occurred without convergence. The contact size (the central dark spot) increased without any move-out in the interference pattern.
The light rays reflected back from the bottom of the convex lens and from the top of the flat interfere constructively or destructively depending upon the thickness of the fluid layer between the two surfaces. Thus, we see a pattern of concentric bright and dark bands corresponding to the interference maxima and minima. As the lenses move towards each other, the separation between the lenses decreases and the rings appear to move out from the center. By tracking the change in the radius of the interference minima, convergence is measured. The separation between the lenses required for minima is given by:
mA
hm= , m = 0,1,2, 3,.. (3.1)
2p-where m is the order of the interference minima, A is the wavelength used for obser-vation (here we used 435 nm, 542 nm and 575 nm) and t is the refractive index (see section 3.5) of the saturated quartz solution.
As explained above, the position of the interference minima is a function of the thickness of quartz solution separating the lenses. The thickness of the quartz solu-tion, between the lenses, 'h', at a radial distance r from the center of the contact is given by (see figure 3-1):
h(r) Re - s - R2- r2z ~ s
22Rc
= r - s from binomial expansion,since Re >>r (3.2)
2Re
where, Re is the radius of curvature of the lens (0.443 inch), s is the total convergence until the time of observation. For the case, when we have pillars on top of the quartz flat and 'h' is measured relative to the base of the pillars,
2
h(r) = - + ho - s (3.3)
2Re
where ho is the height of the pillars (see Figure 3-1). Combining equations 3.1and 3.3,
. 2 + ho -mA (3.4)
2Re 2pt
Since, we are interested only in the time-dependent deformation at the contact, we look for the time dependent component of convergence after the initial elastic/plastic loading. From equation 3.4, As = s(t)-s(0), is given by:
Arm2
As = m (3.5)
2Re
where Arm2 is the change in the square of the mth order fringe radius relative to its value just after loading.
-Re - JR, - r2 ,,0 2R, 2 r hr = ho +-- s 2 R,
(a) Separation between the lenses when no load is applied.
(b) Separation between the lens when they are pressed against each other. The profiles come closer by the total convergence 's'
R, Radius of Curvature of the Convex lens
h, Thickness of the quartz solution between the lenses at a radial distance 'r'
ho Height of the pillars above the flat lens
Knowing the radius of curvature of the lenses, we determined As by measuring the change in the radius of the interference fringes. The radius of the interference fringes were measured as described in section 3.2. The convergence was calculated using the equation 3.5 for each tracked interference fringe and averaged, using calculations of refractive index to identify the order of each fringe (see sections 3.5, 3.6). The standard deviation of the convergence value was less than the estimated error in the convergence (see section 3.2). We ignored the first few fringes, which tend to be distorted, and tracked up to 8 - 10 fringes in each interferogram.
3.2
Radius of Interference Minima
The radius of each interference minimum was tracked in the time-lapse photos of the contact. The accuracy with which we can measure the radius is theoretically limited by the resolution of the photo. In addition, the illumination was not uniform, introducing extra noise in the experiments. We processed the images by rescaling the color histograms to enhance contrast. We applied a band-pass filter, to enhance features greater than 4 pixels and smaller than 40 pixels, which reduced the spatial variation in brightness due to non-uniform illumination and also suppressed the high frequency noise. The processed photos were finally analyzed to measure the radius of the interference minima.
The radius of each interference minima was calculated separately through a two-step process. First, a minimum of 10 points was selected manually on each interference fringe. The best-fit circle to the manually selected points was determined by non-linear least squares. The best-fit circle was then discretized. At each point on the discretized circle, a square region of pixels, with the discretized point at the centre, was selected. The side of the square was approximately equal to the width of the fringe. The weighted centroid of the square region was calculated, with the pixels weighed exponentially by darkness. This centroid was assumed to represent the min-imum of the considered fringe. The radius of the best-fit circle to these centroids was taken to be the radius of the interference minimum. The root mean square error in
the radius of the best-fit circle, thus calculated, varied from 0.5 pixels to 1.5 pixels. Thus, the radii of interference minima were estimated within ±1.5pm.
The non-linear least squares algorithm, used to find the best-fit circle, iteratively solves for the center of the best-fit circle. The radius of the best-fit circle is the average radial distance of the data points from the center. The algorithm minimizes the 12
norm of the difference between the radial distance of each point and the average radial distance of all points. The initial guess to the non-linear least squares algorithm was the average of the centers of circles, passing through three points selected at a time. Points too close to each other were avoided. The termination criteria were the default termination criteria of Matlab optimization toolbox.
Propagating the error in the measurement of radius into convergence calculations, the error in measuring the convergence, ASerror, is of the order of 0.02pum on average
(see Figure 4-2(b)). Thus, we can measure convergence accurate to 0.02pm.
3.3
Newton's Rings Pattern
When we used quartz flats with added surface morphology the interference pattern was complicated (see Figures 4-3, 4-4, 4-5 and 4-6). In particular, in the case of square pillars, the central interference pattern appears to be surrounded by additional interference patterns (see Figures 4-5 and 4-6), which are caused by the interference of rays reflected from either the top of the pillars or the bottom of channels with rays reflected from the bottom of the convex lens. However, if the pillars and channels occupy different surface area, the interference pattern corresponding to the greatest surface area dominates. For example, if the channels occupy more surface area than the pillars, the interference pattern associated with the bottom of the channels will dominate.
To interpret the observed interference pattern, we numerically modeled the inter-ference pattern due to a convex lens on top of a flat with pillars as follows. The center of the lens is assumed to rest on the center of a pillar and the separation between the two lenses at any point on the surface of the flat is calculated. Whenever the point
lies on top of a pillar the separation 'h' is given by the equation 3.3, depending on the radial location of the point from the axis of symmetry of the convex lens. Similarly, whenever the point lies on the bottom of a channel, the separation is given by the equation 3.2, depending on the radial location of the point. The phase difference between the rays reflected from the bottom of the convex lens and the top of the
quartz flat,
4,
is given by4
= 2ph +27r (3.6)The extra phase difference of 7r is introduced by the reflection at the bottom of the convex lens due to reflection at medium with higher refractive index. For the purpose of calculating the position of the minima and maxima, we assume total reflection and thus, both the interfering wave fields have same amplitude,'o. The resultant amplitude at any observation point V is given by
0= o V/2 (1 + cos(4)) (3.7)
This assumption only affects the amplitude values at the observation points, but not the position of the minima and maxima. A numerically computed interference pattern is compared with the observed interference pattern when the convex lens was pressed onto 'Sample 2' at a load of 0.015 N in air (Figure 3-2). The separation between the lenses for use in the simulation was calculated using equations 3.2, 3.3, assuming an elastic initial convergence (see section 3.6 ). Note that the concentric bands surrounding the central interference pattern, as well as the overall intensity of the central contact spot in the simulated pattern matches the observed pattern quite well. This good agreement indicates that the central interference pattern observed with 'Sample 2' (Figure 3-2(a)) is formed on the bottom of the channels. This can also be seen in Figure 3-3, which shows the interference patterns when either channels or pillars occupy more surface area. We can see that a bright central interference pattern is formed only when more light is reflected off the bottom of the channels (Figure 3-3(a)).
(a) Observed Pattern
(b) Simulated Pattern
Figure 3-2: Comparison of observed and simulated interference patterns. Scale bar is 300 microns
.. ... ... .... ... ...
Figure 3-3: (a) Channels occupy more surface area: Interference pattern is on the
bottom of channels (b) Pillars occupy more surface area: Interference pattern is on
the top of Pillars
3.4
Stress Estimation
From Hertzian Contact theory, we estimate the contact stresses in our experiments by calculating the stress distribution produced by the contact of a sphere pressed against a flat (Johnson, 1985). This is readily applicable to experiment PS031209, where no morphology was added to the surface. But, the stress distribution within the contact is more complicated with experiments PS052009, PS062309. We estimate the stress distribution within these contacts by considering the fabricated pillars as rigid punches. Indeed, the elastic shortening of the pillars (about 0.01 pm for a mean stress of 1000 MPa on the pillars) is small compared to the overall elastic displacement (about 0.26 pm for a load of 0.85 N). In these calculations, we assume a square grid of pillars with the center of the contact located on top of a central pillar (eg: Figure 3-1). In this configuration, we have rings of pillars located radially from the center of lens (see Figure 3-4). For a contact problem, we need to solve for both contact radius and the stress distribution. We do it iteratively, as follows: 1) First, the contact radius
/
the number of rings in contact is guessed. 2) The load distribution on the pillars within the contact is computed (as explained below). 3) The contact radius (thus, the number of rings in contact) is increased if all the pillars within the contact are under compression. The contact radius is decreased if any pillar within the contact is under tension. 4) Steps 2 and 3 are repeated until the number of rings in contact is maximized when all the pillars within the contact are under compression. The deformation in the lens and the flat (which is assumed identical) is calculated from the distributed loads exerted by the pillars within the contact.At a given iteration, let the rings i = 0 to m be in contact. The zeroth ring corresponds to the central pillar while the m'h ring corresponds to the outermost ring in contact. The number of pillars on the ith ring (radius ri ) is given by ni. For a given macroscopic load 'P' on the lens, we assume that all the pillars on a ring share the same load pi (from symmetry arguments). Following Hertz's approach to contact
problem, the following conditions are true for pillars inside and outside the contact:
hi = 2uo - 2ui i < m, inside the contact
> 2uo - 2ui i > m, outside the contact (3.8)
where hi is the separation between pillars on the jth ring and the lens, given by 2R,), no
is the normal displacement under the central pillar, and ui is the normal displacement under the pillars on the ith ring, caused by the elastic deformation of the surface of the flat. 2uo is the relative approach of two distant points in the lens and the flat.
m =1 Yn =2 %m=3
m. 0
Figure 3-4: Illustration of pillars within the contact
An expression for the normal displacement, 'n ' is obtained by considering the displacement under a given pillar due to the load on all the pillars in contact. The normal displacement 'u' at a radial distance 'r' from the center of the punch (here representing a pillar), due to a load 'P' on it is given by (Johnson, 1985):
(11 - v2)p
U 2 P - for r < ap, i.e, beneath the punch 2Ea,
= (1 - )Parcsin( ) for r> a, outside the punch (3.9)
For a given pillar on the ith ring (i=0,1,2,..., Im), ui is given by:
(1 v), (i_ 2)m nj a
i )p, +
V2)
pj Ylarcsin
(3.10)2Eap ,rEa j=0 kr1,rjkOijk
where E is the elastic modulus, v is the Poisson's ratio, a, is the effective radius of the square pillars and rijk is the radial distance of the given pillar on the ith ring from the kIh pillar on the jth ring. The first term gives the component of the displacement under the given pillar due to the self load (here rik = 0).
From equations 3.8 and 3.10, we have:
(1- V2)p+ (1- V2)j E arcsin ( =
Uo
- - i=
0,1,2,..,m2Eap rEar j=o k=1,rijk#O rijk 2
= o - (3.11)
4Re
Thus, we have m+2 unknowns (po,p1,p2, ... ,pm and no) and m+1 equations. For the final constraint, we require that, the sum of the loads on all pillars in contact should equal the total load applied on the lens for equilibrium:
m
P = nip (3.12)
i=O
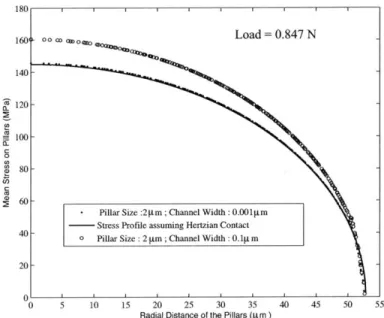
From these equations, we can solve for the load distribution within the contact. To validate the approach, we modeled the stress distribution with 2pm size pillars on the flat and reduced the channel width from 10- 1pm to 103fpm. We assumed quartz to be isotropic and took E = 95600 MPa and v=0.08 for all the simulations. As the channel dimension was decreased, the solution approached the Hertzian solution for a sphere pressed against a flat (Figure: 3-5(a)). We assumed a total load of 0.847 N on the lens and solved for the stress distribution and contact radius. For experiment PS52009 (8pim island channel structure), the mean stress on the central pillar was calculated to be 531 MPa while the outer most pillars saw a mean stress of 34 MPa (see Figure: 3-5(b)). We predicted 7 pillars across the diameter of the contact, which
is roughly consistent with the observations (Figure 4-9). Similarly, for experiment PS062309 (4pm island channel structure), the calculated mean stress on central pillar and outermost pillars were 554.6 MPa and 2.84 MPa, respectively (Figure 4-12(a)). We predicted 14 pillars across the diameter within the initial contact area for this experiment, which matches very closely within a region of SEM images revealing damaged pillars (Figure 4-12(a)). The mean stress on the pillars is compared with the classical Hertzian contact solution (Figure 3-5(b)). Note that the contact radius remains almost same, but the stress on the pillars is greatly amplified. The increase in stress on the pillars is proportional to the area occupied by the channels.
120-( 100-C 0 80-:4 60 -- Pillar Size: Stress Profil 40 - Pilar Size: 2 0-0 5 10 15 R
(a) Simulated stress profiles creased relative to the pillar channel width is decreased.
bUUI I I I I I 5001 Z 400 300 5) E 0 200 z US 20 25 30 35 40 45 50 55
adial Distance of the Pillars (pm )
within contact while the channel width is de-dimension. Hertzian solution is approached as
0 10 20 30 40
Radial Distance of the Pillars( pi m)
(b) Calculations of initial contact stresses appropriate to our experiments in
comparison to Hertzian solution.
Figure 3-5: Simulated stress profiles
+ + Load =0.847 N
++ -1
± Pillar Size:8pm; Channel Width: 4m
+ Pilar Size:4pm ;Channel Width :4pm +
Stress profile assuming Hertzian Contact
-+