HAL Id: inserm-02456945
https://www.hal.inserm.fr/inserm-02456945
Submitted on 27 Jan 2020
HAL is a multi-disciplinary open access
archive for the deposit and dissemination of
sci-entific research documents, whether they are
pub-lished or not. The documents may come from
teaching and research institutions in France or
abroad, or from public or private research centers.
L’archive ouverte pluridisciplinaire HAL, est
destinée au dépôt et à la diffusion de documents
scientifiques de niveau recherche, publiés ou non,
émanant des établissements d’enseignement et de
recherche français ou étrangers, des laboratoires
publics ou privés.
Alzheimer’s disease and normal aging: implications for
fluctuations
Eléna Chabran, Vincent Noblet, Paulo Loureiro de Sousa, Catherine
Demuynck, Nathalie Philippi, Catherine Mutter, Pierre Anthony, Catherine
Martin-Hunyadi, Benjamin Cretin, Frédéric Blanc
To cite this version:
Eléna Chabran, Vincent Noblet, Paulo Loureiro de Sousa, Catherine Demuynck, Nathalie Philippi,
et al.. Changes in gray matter volume and functional connectivity in dementia with Lewy bodies
compared to Alzheimer’s disease and normal aging: implications for fluctuations. Alzheimer’s Research
and Therapy, BioMed Central, 2020, 12 (1), pp.9. �10.1186/s13195-019-0575-z�. �inserm-02456945�
R E S E A R C H
Open Access
Changes in gray matter volume and
functional connectivity in dementia with
Lewy bodies compared to Alzheimer
’s
disease and normal aging: implications for
fluctuations
Eléna Chabran
1*, Vincent Noblet
1, Paulo Loureiro de Sousa
1, Catherine Demuynck
2, Nathalie Philippi
1,2,
Catherine Mutter
3, Pierre Anthony
4, Catherine Martin-Hunyadi
2, Benjamin Cretin
1,2and Frédéric Blanc
1,2Abstract
Background: Fluctuations are one of the core clinical features characterizing dementia with Lewy bodies (DLB). They represent a determining factor for its diagnosis and strongly impact the quality of life of patients and their caregivers. However, the neural correlates of this complex symptom remain poorly understood. This study aimed to investigate the structural and functional changes in DLB patients, compared to Alzheimer’s disease (AD) patients and healthy elderly subjects, and their potential links with fluctuations.
Methods: Structural and resting-state functional MRI data were collected from 92 DLB patients, 70 AD patients, and 22 control subjects, who also underwent a detailed clinical examination including the Mayo Clinic Fluctuation Scale. Gray matter volume changes were analyzed using whole-brain voxel-based morphometry, and resting-state functional connectivity was investigated using a seed-based analysis, with regions of interest corresponding to the main nodes of the salience network (SN), frontoparietal network (FPN), dorsal attention network (DAN), and default mode network (DMN).
Results: At the structural level, fluctuation scores in DLB patients did not relate to the atrophy of insular, temporal, and frontal regions typically found in this pathology, but instead showed a weak correlation with more subtle volume reductions in different regions of the cholinergic system. At the functional level, the DLB group was characterized by a decreased connectivity within the SN and attentional networks, while the AD group showed decreases within the SN and DMN. In addition, higher fluctuation scores in DLB patients were correlated to a greater connectivity of the SN with the DAN and left thalamus, along with a decreased connectivity between the SN and DMN, and between the right thalamus and both the FPN and DMN.
(Continued on next page)
© The Author(s). 2020 Open Access This article is distributed under the terms of the Creative Commons Attribution 4.0 International License (http://creativecommons.org/licenses/by/4.0/), which permits unrestricted use, distribution, and reproduction in any medium, provided you give appropriate credit to the original author(s) and the source, provide a link to the Creative Commons license, and indicate if changes were made. The Creative Commons Public Domain Dedication waiver (http://creativecommons.org/publicdomain/zero/1.0/) applies to the data made available in this article, unless otherwise stated. * Correspondence:elena.chabran@icube.unistra.fr
1ICube Laboratory UMR 7357 and FMTS (Fédération de Médecine
Translationnelle de Strasbourg), Team IMIS, University of Strasbourg and CNRS, Strasbourg, France
(Continued from previous page)
Conclusions: Functional connectivity changes, rather than significant gray matter loss, could play an important role in the emergence of fluctuations in DLB. Notably, fluctuations in DLB patients appeared to be related to a disturbed external functional connectivity of the SN, which may lead to less relevant transitions between different cognitive states in response to internal and environmental stimuli. Our results also suggest that the thalamus could be a key region for the occurrence of this symptom.
Keywords: Dementia with Lewy bodies, Fluctuations, MRI, Functional connectivity, Voxel-based morphometry , Salience network
Background
Dementia with Lewy bodies (DLB) is the second most com-mon cognitive neurodegenerative disorder after Alzheimer’s disease (AD), accounting for 15–20% of pathologically diag-nosed dementia cases [1]. The core clinical features charac-terizing DLB, along with dementia, are cognitive fluctuations, recurrent visual hallucinations, rapid eye movement sleep be-havior disorder (RBD) and spontaneous cardinal features of parkinsonism [1]. Of these symptoms, cognitive fluctuations appear to be both the most typical and the least understood. Defined as spontaneous alterations in cognition with pro-nounced variations in attention and alertness, they occur in 80–90% of DLB patients [1,2] and have a significant impact on patients’ autonomy and quality of life [3–5]. In daily life, they result in substantial changes in patients’ mental status and behavior over time, alternating between periods of poorer task performance, incoherent speech and behavior, excessive daytime somnolence and episodes of altered con-sciousness (described by caregivers as sudden “switching off”), and periods of greater lucidity and cognitive perform-ance [1,6,7]. Their periodicity and duration are highly vari-able even within the same person, ranging from seconds or minutes, to months. Clinically, fluctuations in DLB patients must be distinguished from the mild, day-to-day fluctuations commonly observed in various forms of dementia. They were shown to have a greater prevalence and severity than those observed in AD and vascular dementia [2,7,8], and to be qualitatively distinct from fluctuations in AD patients, which rather consist in episodes of memory failure [9]. Fur-thermore, fluctuations in DLB patients seem to be internally driven, while those in AD patients may be more related to environmental triggers [9].
Despite fluctuations being a major symptom of DLB, their neural bases remain unclear. First, no consistent structural brain changes have been related to cognitive fluctuations, although a few studies have investigated this question. In a study combining diffusion tensor MRI and proton MR spectroscopy, Delli Pizzi et al. [10] reported a cholinergic imbalance in the right thalamus in DLB pa-tients compared to controls and AD papa-tients, along with microstructural alterations in bilateral thalamic regions projecting to the frontal cortex. However, only cholinergic measures correlated with the presence and severity of
cognitive fluctuations, suggesting that neurochemical changes in this region could be more relevant to the phys-iopathology of fluctuations than microstructural alter-ations. More recently, significant atrophy was also found in the left pulvinar and ventral lateral nucleus regions of the thalamus in DLB patients and appeared to be associ-ated with impaired attentional function [11]. Underlining the link between attentional impairment and cognitive fluctuations, the authors thus suggested a potential role of thalamic atrophy in the latter symptom. Lastly, a volumet-ric study focusing on the substantia innominata (SI) showed a significant negative association between the se-verity of cognitive fluctuations and gray matter volume in the right SI in DLB patients [12]. Overall, current findings do not allow clear conclusions on the structural correlates of this symptom but provide some clues towards a poten-tial involvement of subcortical structures.
At the same time, an increasing focus is put on func-tional aspects, recent studies assuming that cognitive fluc-tuations are more likely to arise from functional network disturbances rather than overt structural abnormalities [13, 14]. Electroencephalographic data showed that the frequency and severity of cognitive fluctuations were cor-related with an increase and abnormal variability of pos-terior slow wave activity in DLB patients compared to AD patients [4, 15–17]. Similar posterior disturbances were observed using single-photon emission computed tomog-raphy (SPECT): cognitive fluctuations in DLB patients ap-peared to be associated with decreased inferior occipital perfusion and increased thalamic perfusion in one study [18] and with decreased perfusion in bilateral posterior parietal regions, covariant with increased perfusion in motor regions, in another [13]. In terms of functional con-nectivity, a significant association was found between greater fluctuations and a reduced connectivity between the right middle frontal gyrus and the right lateral parietal cortex in DLB patients [19]. Peraza et al. [14] also reported a positive correlation between alterations within the left frontoparietal network and the severity and frequency of cognitive fluctuations in DLB. According to these results, functional perturbations related to fluctuations thus seem to involve widely distributed networks rather than one particular brain region.
The present study sought to complement and clarify current knowledge on the neural bases of fluctuations in DLB patients, by assessing both structural and functional aspects. Our aims were, first, to investigate changes in gray matter volume and functional connectivity in DLB patients compared to AD patients and healthy elderly subjects and, second, to assess more directly whether these structural and functional measures correlate with fluctuation scores in DLB patients. Since, in most of the previous studies, morphometric analyses were limited to a few a priori defined regions of interest, and functional connectivity analyses mainly focused on within-network changes, we aimed to provide a broader analysis frame-work by conducting our structural analysis on the whole brain and examining both within- and between-network functional connectivity in a set of well-described resting-state networks.
Methods Participants
A total of 184 subjects participated in the study. Ninety-two DLB patients and 70 AD patients were recruited through member teams of the Centre Mémoire de Ressources et de Recherche (CM2R) Alsace, France (i.e., the Geriatrics and Neurology Departments of the University Hospital of Stras-bourg [HUS] and the Geriatrics Department of the General Hospital Center of Colmar). Additionally, 22 elderly healthy subjects were recruited through the Clinical Investigation Centre and CM2R of HUS. The study was approved by the Est-IV ethics committee (CPP Est-IV, Strasbourg), and all participants provided written informed consent.
To be included, the subjects had to be over the age of 50 years and be native speakers of French. Exclusion cri-teria were as follows: MRI contraindications, alcohol or substance abuse, sensory or motor disability, additional neurological or psychiatric conditions that could explain the symptoms, significant focal cerebral lesions shown on brain imaging, and co-occurrence of DLB and AD.
DLB and AD patients were diagnosed by experienced neurologists and geriatricians on the basis of the McKeith [2] and the Dubois [20] criteria, and the control participants were examined in the same way as patients to exclude any occult mild cognitive impairment or de-mentia cases. The potential presence of medial temporal atrophy was assessed using the Scheltens visual rating scale on brain MRI scans for the three groups. All par-ticipants underwent detailed clinical and neuropsycho-logical evaluations, including the Mini-Mental State Examination (MMSE) and the Mayo Clinic Fluctu-ation Scale [6]. For a comprehensive description of
the different neuropsychological assessments, see
Kemp et al. [21].
We excluded 25 participants (13 DLB and 12 AD pa-tients) from the functional analysis for reasons of
missing data (n = 12), image artifacts (n = 9), and to match the two dementia groups in terms of mean MMSE (n = 4).
Demographic and cognitive measures
Statistical analyses of demographic and cognitive measures were performed using GraphPad Prism software (GraphPad Software, Inc., San Diego, CA). Normality of distribution of the variables was tested using the Shapiro-Wilk test and by visual inspection of quantile-quantile plots, and homogeneity of variances across groups was assessed using Levene’s test. Where appropriate, between-group differences in continuous data were evaluated using either the non-parametric Kruskal-Wallis test with Dunn’s post hoc test or a one-way ANOVA with Tukey’s post hoc test. For categorical data, we used the chi-square test. Results were regarded as significant atp < 0.01.
MRI data acquisition
Imaging was performed using a Siemens Verio 3T scanner equipped with a 32-channel head coil (Siemens, Erlangen, Germany). A concomitant resting-state blood oxygen level-dependent (BOLD) and arterial spin-labeling se-quence was used to acquire 121 whole-brain T2*-weighted (gradient echo) echo planar images. The parameters were as follows: repetition time = 3 s; flip angle = 90°; echo time = 21 ms; inversion time 1 = 600 ms; inversion time 2 = 1325.1 ms; field of view = 152 × 256 × 112 mm; 4-mm isotropic voxels. The first volume was intended for arterial spin-labeling measurement; thus, it was not considered for BOLD analysis. One whole-brain T1-weighted image was also collected within the same session, using a 3D magnetization-prepared rapid gradient-echo (MPRAGE) sequence. The parameters were as follows: repetition time = 1.9 s; flip angle = 9°; echo time = 2.53 ms; inversion time = 900 ms; field of view = 192 × 192 × 176 mm; 1-mm isotropic voxels.
MRI data preprocessing
Images from each subject were preprocessed using the Statistical Parametric Mapping 12 package (SPM12, The Wellcome Trust Centre for Neuroimaging, London, UK).
Structural images
The anatomical data set was first visually inspected to check for potential artifacts or anatomical abnormalities and then spatially preprocessed using standard proce-dures [22]. All T1 structural images were segmented and bias corrected using an extension of the unified segmen-tation procedure [23] including six classes of tissue. The DARTEL approach was then used to build a study-specific template and to spatially normalize all seg-mented images to the Montreal Neurological Institute (MNI) space. Lastly, gray matter images were modulated
to preserve the total amount of gray matter from the ori-ginal data and smoothed with a 8-mm full-width at half-maximum Gaussian kernel.
Functional images
Functional images were preprocessed with the following steps: low-pass filtering at 0.112 Hz to remove arterial spin-labeling frequencies; slice-timing correction; rigid body registration and B0 field inhomogeneity correction; coregistration to the T1-weighted anatomical image; spatial normalization to Montreal Neurological Institute space using the DARTEL approach with an 8-mm full-width at half-maximum Gaussian kernel. No modulation was applied during the normalization procedure. We en-sured that there were no between-group differences in the total amount of head motion (corresponding to the maximum absolute frame-wise displacement across scans), using ANOVA (F(2, 156) = 0.34,p = 0.71). Finally, a denoising step using the aCompCor method [24] in-cluding cerebrospinal fluid, white matter, and motion parameters was conducted to remove residual unwanted motion and physiological and artefactual effects from the BOLD signal, prior to connectivity analyses.
Statistical analysis
Voxel-based morphometry (VBM) analysis
Group comparisons Between-group differences in gray matter volume were assessed using the SPM12 General Linear Model based on Gaussian random field theory [25]. Age, gender, and total intracranial volume were in-cluded in the design matrix as covariates of no interest. Statistical significance was set at a false discovery rate (FDR)-corrected threshold ofp < 0.001 at the voxel level.
Association between VBM measures and clinical variables A multiple regression analysis was performed to examine the effect of gray matter volume on fluctu-ation scores in the DLB group separately. Variables en-tered into the model along with the dependent variable included the fluctuation scores, as a covariate of interest, and age, sex, and total intracranial volume, as covariates of no interest. Results were reported when significant at an uncorrected threshold ofp < 0.05 at the voxel level.
Resting-state functional connectivity analysis
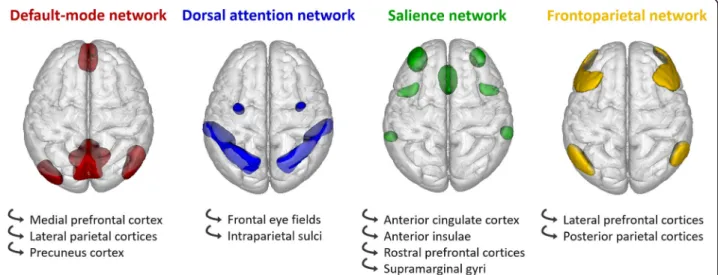
ROI-to-ROI analysis Seed-based functional connectiv-ity analyses were performed using the Conn toolbox [26]. Twenty-two regions of interest (ROIs) correspond-ing to the main nodes of the salience network (SN), frontoparietal network (FPN), dorsal attention network (DAN), and default mode network (DMN) were selected
from the “networks atlas” implemented in the Conn
toolbox, which was obtained from an independent com-ponent analysis (ICA) including 497 subjects from the Human Connectome Project dataset [26]. Additionally, two other ROIs were defined based on the results of the VBM analysis, corresponding to brain regions where gray matter volume was correlated to fluctuation scores in DLB patients. They were added in the connectivity analysis using the Harvard-Oxford Atlas [27]
imple-mented in the Conn toolbox. See Fig. 1 and
Add-itional file1: Table S1.
At the first level of the analysis, individual ROI-to-ROI functional connectivity matrices were generated by com-puting bivariate Pearson’s correlation measures between the mean BOLD signal time courses of each pair of ROIs. Each participant’s motion parameters obtained during the preprocessing were added as a covariate of no interest. A Fisher transformation was then applied to
the correlation coefficients to improve normality as-sumptions of the subsequent, second-level analyses.
In a next step, the individual matrices were entered into a second-level general linear model, with age and gender as covariates of no interest, to allow between-group comparisons. The results were reported only when surviving a false discovery rate (FDR) corrected threshold ofp < 0.05 at the seed level.
Mean within- and between-network connectivity In addition, mean within-network and between-network con-nectivity values were computed in the second level of the analysis, to obtain more summary measures of the functional changes in the different groups of participants. The mean within-network connectivity was calculated as an average of the connectivity values between all ROIs within a network, while the mean between-network connectivity corresponded to an average of the connectivity values between all possible ROI pairs in two chosen networks.
Association between connectivity measures and clinical variables Multiple regression analyses were also performed to examine the effect of functional connectiv-ity on fluctuation scores, in the DLB group separately. Variables entered into the model along with the dependent variable included the fluctuation scores as a covariate of interest, and age and gender as covariates of no interest. Results were reported when significant at an uncorrected threshold ofp < 0.05 at the seed level.
Results
Demographic and cognitive measures
Demographic and cognitive data of the participants are
summarized in Table 1. In the VBM cohort, the AD
group was older than the control and DLB groups, while the latter were comparable in age. In the cohort used for the functional analysis (which was the same cohort as for the VBM analysis but with 25 fewer participants), the AD group was older than the control group but not the DLB group, and the latter were comparable in age. In both cohorts, the two dementia groups had lower MMSE scores than the control group, but did not differ from each other for this variable. As expected, the DLB group had higher fluctuation scores than both other groups. Finally, all groups were comparable for gender.
VBM analysis Group comparisons
Compared with the control group, the AD group showed a widespread pattern of atrophy involving mainly the medial temporal lobe. The DLB group differed from the controls by showing more focal patterns of gray matter loss, involving the temporal lobes, the insulae, and the frontal lobes. When comparing the AD and DLB groups, we observed a greater gray matter loss in the medial temporal lobe (including the parahippocampal gyrus, the hippocampus and the amygdala) in AD patients. No re-gions showed greater atrophy in the control group than
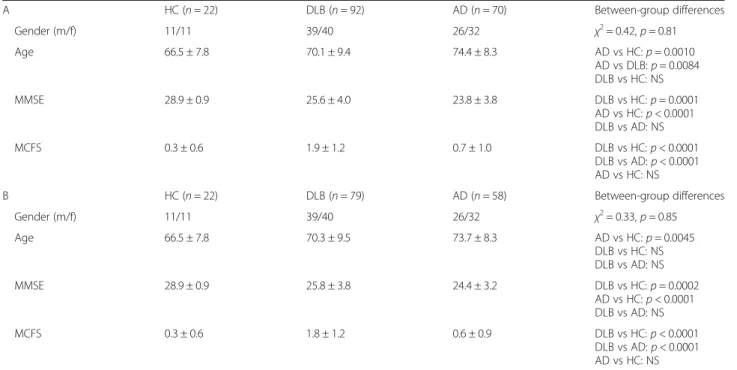
Table 1 Demographics and fluctuation scores of the cohorts
A HC (n = 22) DLB (n = 92) AD (n = 70) Between-group differences Gender (m/f) 11/11 39/40 26/32 χ2= 0.42,p = 0.81 Age 66.5 ± 7.8 70.1 ± 9.4 74.4 ± 8.3 AD vs HC:p = 0.0010 AD vs DLB:p = 0.0084 DLB vs HC: NS MMSE 28.9 ± 0.9 25.6 ± 4.0 23.8 ± 3.8 DLB vs HC:p = 0.0001 AD vs HC:p < 0.0001 DLB vs AD: NS MCFS 0.3 ± 0.6 1.9 ± 1.2 0.7 ± 1.0 DLB vs HC:p < 0.0001 DLB vs AD:p < 0.0001 AD vs HC: NS B HC (n = 22) DLB (n = 79) AD (n = 58) Between-group differences Gender (m/f) 11/11 39/40 26/32 χ2= 0.33,p = 0.85 Age 66.5 ± 7.8 70.3 ± 9.5 73.7 ± 8.3 AD vs HC:p = 0.0045 DLB vs HC: NS DLB vs AD: NS MMSE 28.9 ± 0.9 25.8 ± 3.8 24.4 ± 3.2 DLB vs HC:p = 0.0002 AD vs HC:p < 0.0001 DLB vs AD: NS MCFS 0.3 ± 0.6 1.8 ± 1.2 0.6 ± 0.9 DLB vs HC:p < 0.0001 DLB vs AD:p < 0.0001 AD vs HC: NS
(A) Cohort of the voxel-based morphometry analysis. (B) Cohort of the functional connectivity analysis. Data are presented as mean ± SD except where noted. Abbreviations: AD Alzheimer’s disease, DLB dementia with Lewy bodies, HC healthy controls, f female, m male, MCFS Mayo Clinic Fluctuation Scale, MMSE Mini-Mental State Examination,NS non-significant
in the dementia groups, nor in the DLB group than in the AD group (see Fig.2).
Association between VBM measures and fluctuation scores
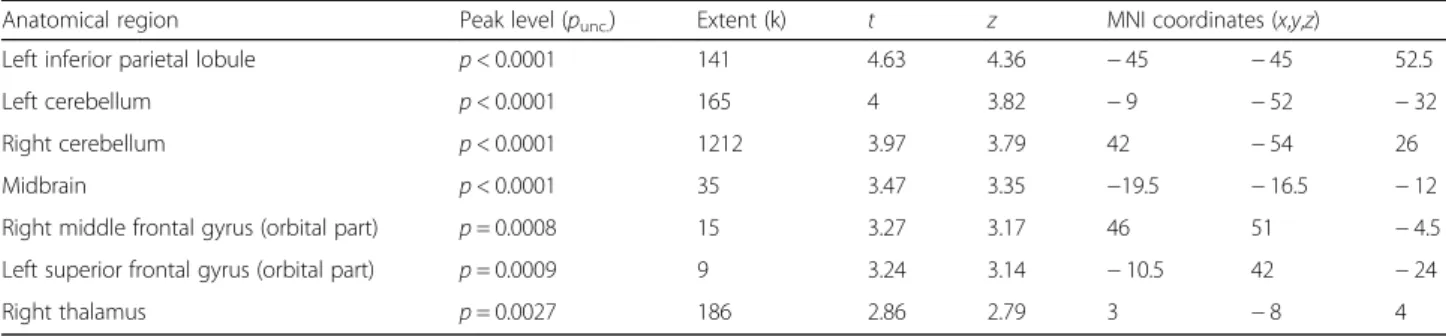
In the DLB group (see Table 2), we found a negative correlation between patients’ fluctuation scores and gray matter volume in clusters including the left inferior par-ietal lobule, the left and right cerebellum, the midbrain, the right middle orbitofrontal gyrus, and the left superior orbitofrontal gyrus. When raising the threshold to p < 0.005, this negative correlation also appeared in the right thalamus.
Among these regions, the midbrain and the thalamus were added as complementary ROIs for the subsequent functional connectivity analysis. The left inferior parietal gyrus and the prefrontal cortex did not need to be added as they already corresponded to nodes of the selected functional networks.
We did not find any cluster where gray matter volume was positively correlated to patients’ fluctuation scores.
Functional connectivity analysis ROI-to-ROI analysis
First, the DLB group showed a significant decrease in functional connectivity between a number of ROIs within the SN, compared to the control group (see Fig. 3). Similar decreases were found between ROIs within the FPN (right lateral prefrontal cortex [LPFC] and right posterior parietal cortex [PPC]) and between ROIs of the FPN and the DAN (right LPFC and right intraparietal sulcus [IPS], respectively). In contrast, a sig-nificantly increased functional connectivity was observed between the medial prefrontal cortex (MPFC) of the DMN and both the right rostral prefrontal cortex (RPFC) of the SN and the right LPFC of the FPN, in DLB patients compared to controls.
Fig. 2 Patterns of significant voxel-wise gray matter loss in the three groups. a AD patients compared to controls, b DLB patients compared to controls, and c AD patients compared to DLB patients, superimposed on three-dimensional MNI surface renders. d DLB patients compared to controls and e AD patients compared to DLB patients, superimposed on a mean T1 image (neurological orientation). All results are represented atp < 0.001 (FDR-corrected) at the voxel level
No significant differences were found between the AD and control groups or between the DLB and AD groups at the set FDR-corrected threshold. At an un-corrected threshold of p < 0.05, AD patients showed a connectivity decrease between several ROIs within the SN and within the DMN, and a higher connectivity between the MPFC of the DMN and the right RPFC of the SN, compared to the control group. When comparing the AD and DLB groups (p < 0.01 uncor-rected), DLB patients had a weaker connectivity be-tween two ROIs within the SN (left RPFC and left anterior insula [AI]), and between ROIs of this net-work and ROIs of the DAN (right frontal eye field [FEF]), FPN (left and right LPFC), and DMN (precu-neal cortex [PCC]). Conversely, they showed a higher connectivity than AD patients between two ROIs within the DMN (right lateral parietal cortex [LP] and PCC) and between the left IPS of the DAN and the left LPFC of the FPN (see Fig. 3).
Mean within- and between-network connectivity
The DLB group and AD group showed a weaker mean functional connectivity within the SN compared to the control group (T154= 2.96, p = 0.0035 and T154= 2.04,
p = 0.0430, respectively). No other within-network and no between-network connectivity differences were found among the three groups.
Association between FC measures and fluctuation scores
In the DLB group, we found a positive correlation be-tween patients’ fluctuation scores and functional con-nectivity for three pairs of ROIs: left SN-RPFC and left DAN-FEF, left SN-AI and right DAN-FEF, right SN-AI and left thalamus. Fluctuation scores were also nega-tively correlated to the functional connectivity between the left SAL-RPFC and the DMN-MPFC, between the right thalamus and all the ROIs of the DMN (MPFC, left and right LP, PCC), between the right thalamus and two
Table 2 Location and peak significance of clusters where gray matter volume was negatively correlated with fluctuation scores in the DLB group
Anatomical region Peak level (punc.) Extent (k) t z MNI coordinates (x,y,z)
Left inferior parietal lobule p < 0.0001 141 4.63 4.36 − 45 − 45 52.5
Left cerebellum p < 0.0001 165 4 3.82 − 9 − 52 − 32
Right cerebellum p < 0.0001 1212 3.97 3.79 42 − 54 26
Midbrain p < 0.0001 35 3.47 3.35 −19.5 − 16.5 − 12
Right middle frontal gyrus (orbital part) p = 0.0008 15 3.27 3.17 46 51 − 4.5 Left superior frontal gyrus (orbital part) p = 0.0009 9 3.24 3.14 − 10.5 42 − 24
Right thalamus p = 0.0027 186 2.86 2.79 3 − 8 4
Fig. 3 Between-group differences in ROI-to-ROI functional connectivity. a DLB > controls, b DLB > AD, and c AD > controls.Abbreviations: ACC, anterior cingulate cortex; AI, anterior insula; DAN, dorsal attention network; DMN, default-mode network; FEF, frontal eye field; FPN, frontoparietal network; IPS, intraparietal sulcus; l, left; LP, lateral parietal cortex; LPFC, lateral prefrontal cortex; MPFC, medial prefrontal cortex; PCC, precuneal cortex; PPC, posterior parietal cortex; r, right; RPFC, rostral prefrontal cortex; SN, salience network; SMG, supramarginal gyrus. The results are represented respectively at apFWE< 0.05, bpunc< 0.01, and Figure S1punc< 0.05, at the ROI level
ROIs of the FPN (left and right PPC), as well as between the left thalamus and the DMN-PCC (see Fig.4).
Discussion
In the present study, we aimed to investigate the struc-tural and functional changes in DLB compared with AD and normal aging and to examine their potential role in the emergence of the fluctuations characterizing these patients.
With regard to structural aspects, the results of group comparisons performed in our VBM analysis were in agreement with the existing literature. In the AD group compared to the control group, we found a typical pat-tern of medial temporal atrophy, as consistently de-scribed in previous studies [28]. In contrast, gray matter loss in the DLB group compared to controls was less ex-tensive and consisted of focal bilateral clusters in the temporal lobes, insulae, and frontal lobes. The changes observed in temporal and frontal regions were consistent with the results of several earlier VBM studies [29, 30]. Similarly, diminished gray matter volumes in bilateral in-sulae were previously reported in DLB patients at both the dementia [31] and prodromal [32, 33] stages. The
insular cortex was also shown to be particularly vulner-able toα-synuclein pathology in these patients [34]. Un-like some previous studies [35–37], we did not find any significant gray matter loss in subcortical structures in the DLB group compared to the control group. This could be explained by the fact that the group compari-sons in most of these studies were performed on chosen segmented subcortical structures rather than on the whole brain gray matter. Another possible explanation to this result is that our DLB patients were at early stages of the disease (prodromal and mild dementia stages), with a mean group MMSE of 25.6 indicating a very mild cognitive decline. Previous studies did not show subcortical gray matter loss in DLB patients at the prodromal stage [32,33], so it is possible that changes in these regions occur later in the disease course. To fur-ther explore the potential subcortical gray matter changes in our DLB group, we evaluated the differences between the DLB and control subjects with a more per-missive threshold ofp < 0.0001 (uncorrected for multiple comparisons). The results are shown in Additional file2: Figure S1. Our early-stage DLB patients showed trends of decreased gray matter volume in the thalamus and in
Fig. 4 Effect of fluctuation scores on functional connectivity in the DLB group.Abbreviations: AI, anterior insula; DAN, dorsal attention network; DMN, default-mode network; FEF, frontal eye field; FPN, frontoparietal network; l, left; LP, lateral parietal cortex; MPFC, medial prefrontal cortex; PCC, precuneus cortex; PPC, posterior parietal cortex; r, right; RPFC, rostral prefrontal cortex; SN, salience network. The results are represented at punc< 0.05 at the ROI level
the brainstem. These slight changes, which are not suffi-ciently marked to reach significance with an FDR correc-tion, are consistent with previous studies showing atrophy in the same regions in these patients at the de-mentia stages [35, 36, 38] and tend to support the hy-pothesis of a later occurrence of subcortical volume loss in DLB. Furthermore, as pointed out in a recent review [39], the most significant subcortical changes reported in DLB patients in the literature relate to functional rather than structural imaging data. Finally, the comparison be-tween the AD and DLB groups revealed a relative bilat-eral preservation of the medial temporal lobe structures in the latter, in line with a number of existing data reviewed by Surendranathan [40].
Among these results, gray matter losses found in the insulae and frontal regions in the DLB group may be relevant with regard to fluctuations. The insula is a com-plex cortical region participating in a wide range of cog-nitive, emotional, somatosensory, and visceral functions [41], and its anterior division forms a major node of the SN. Considering the critical role of the SN for the switching between default-mode and task-positive net-works [42] and the well-known involvement of frontal regions in attentional-executive processes, such atrophic patterns could potentially participate in fluctuations in DLB patients.
However, when investigating more directly the correl-ation between patients’ fluctucorrel-ation scores and gray mat-ter volume in the DLB group, we found a weak negative correlation in the left inferior parietal lobule, the left and right cerebellum, the midbrain, the bilateral prefrontal cortex, and to a lesser extent, the right thalamus. These regions did not correspond to those showing gray matter loss in DLB patients compared to control subjects, which suggests that the relative atrophy of frontal and insular cortices may not be directly involved in the oc-currence of fluctuations. Moreover, the effect of fluctu-ation scores on regional gray matter volume seemed to follow a particular pattern, as the corresponding brain regions were part of the cholinergic system. This system plays an important role in attention and conscious awareness [43, 44] and was shown to be more affected in DLB than in AD [45,46]. The disturbances identified in DLB patients notably include deficits in ChAT [47] and AChE [48] and changes in nicotinic and muscarinic receptors density [49–51] compared to AD patients and healthy elderly subjects. Several studies reviewed by Aarsland et al. [52] also demonstrated that cholinester-ase inhibitors have a positive effect on cognition and neuropsychiatric symptoms in DLB patients, including fluctuating attention, unresponsiveness, and daytime somnolence [53]. Similarly, neuropathological analyses comparing fluctuating and non-fluctuating DLB patients reported significant cholinergic impairments in thalamic
areas in the former [54]. Taken together, these findings suggest that cholinergic impairments may be a deter-minant factor in the etiology of cognitive fluctuations. In the abovementioned regions where gray matter volume was found to be negatively correlated to fluctuation scores, but which are not significantly atrophied in DLB patients compared to controls, it is possible that cholin-ergic synaptic dysfunction may cause microstructural impairments (such as a reduced synaptic density) without frank neuronal loss, thus only leading to subtle volume reductions. Indeed, other neurotransmitter sys-tems involved in attention and arousal, such as norad-renergic or dopaminergic systems, suffer neuronal loss in DLB [55, 56] and could therefore also contribute to a lesser degree to the pathogenesis of this symptom.
Globally, the results of our VBM analysis thus suggest that fluctuations might be more related to microstruc-tural (i.e., slight volume reductions secondary to a loss of synapses) or functional changes, rather than macro-structural modifications.
To investigate the potential spatial correspondence be-tween structural and functional disturbances related to fluctuations in the DLB group, the thalami and midbrain were added as complementary ROIs for the subsequent functional connectivity analysis (the inferior parietal and prefrontal regions did not need to be added as they already corresponded to key nodes of the preselected functional networks).
The second part of our study focused on functional connectivity aspects. At the network level, when com-pared to the control group, the DLB patients showed significant decreases in functional connectivity within the SN and within the FPN, and between ROIs of the FPN and DAN. In contrast, they showed an increased connectivity between ROIs of the DMN and ROIs of both the SN and the FPN. In the AD group, the changes relative to the control group were globally weaker than those distinguishing the DLB group from the control group. They showed a decreased functional connectivity within the SN but also within the DMN, along with an increased connectivity between ROIs from those two networks. Finally, when comparing directly the two de-mentia groups, DLB patients showed a weaker ROI-to-ROI functional connectivity than AD patients within the SN, and between this network and the DAN, the DMN and the FPN. Conversely, the DLB group had a stronger connectivity than the AD group within the DMN, and between ROIs of the DAN and FPN. Additional mea-surements confirmed a weaker mean connectivity within the SN in the DLB and AD groups compared with the control group.
These results tend to identify specific patterns of func-tional connectivity disturbances in DLB and AD. Both groups showed a decreased connectivity within the SN
compared to healthy elderly subjects, which was accom-panied by an increased connectivity between the right RPFC of the SN and the MPFC of the DMN. This in-crease could constitute a compensation process, in order to maintain an effective coupling between the two net-works despite the functional disruptions in the SN. In the DLB group, the increased connectivity between the FPN-LPFC and the DMN-MPFC could similarly be an attempt to compensate for the connectivity disturbances within and between attentional networks. But beyond these similarities, the two groups also revealed distinct profiles of impairments, as SN disturbances appeared to co-occur primarily with attentional network disruptions in the DLB group, while they rather coincided with DMN disruptions in the AD group. In AD patients, this decrease in DMN functional connectivity is a consist-ently reported feature in previous studies, irrespective of the analytical approach used [57]. Regarding the SN, the literature is less consistent: some authors reported an in-creased functional connectivity in this network in AD compared to normal aging [58,59], while others found it was decreased [60, 61]. This could be explained by methodological differences between the analyses (ICA versus seed-based approaches). However, Brier et al. [62] provided another possible explanation by showing in a larger cohort (n = 124) that functional connectivity within the SN was increased in AD patients at a very early stage of the disease (clinical dementia rating [CDR] 0.5), but then decreased at a later stage (CDR 1).
In DLB, our findings are similar to those of Lowther et al. [63], who found a decreased connectivity in the sa-lience and executive control networks compared with AD patients and healthy subjects. The fact that we found decreases specifically within the FPN and the SN and be-tween the FPN and the DAN, may provide some clues about the occurrence of fluctuations and attention defi-cits [1, 3] in DLB patients, considering the particular interaction between these networks. The FPN and DAN show high activity during externally directed attentional focus and are anticorrelated with the DMN, which is ac-tivated during unfocused, internally focused, or explora-tory states [64, 65]. The coupling of these networks, which allows an effective switching between distinct at-tentional states in response to both internal and environ-mental stimuli, was shown to be triggered by the activity of the SN [42, 66]. The functional connectivity disrup-tions that we observed in the DLB group may lead to disturbed transitions from one network configuration (or cognitive state) to another and could thus participate in the etiology of fluctuations.
The multiple regression analysis revealed that the severity of fluctuations in DLB patients was positively correlated to the functional connectivity of the SN with the DAN and the left thalamus and negatively correlated with the connectivity
between the SN and the DMN and between the right thal-amus and both the FPN and the DMN.
First, this suggests that fluctuations could arise from an imbalance of the external connectivity of the SN,
maybe triggered primarily by the disconnections
between the different ROIs within this network, as observed in the group comparisons. The negative correl-ation between fluctucorrel-ation scores and functional connect-ivity between the SN and DMN is striking because it involves the RPFC of the SN and the MPFC of the DMN, a pair of ROIs showing a hyperconnectivity (but with a different lateralization) in DLB patients compared to healthy subjects, which we interpreted as a compensa-tion process. In agreement with this hypothesis, greater fluctuations in DLB patients may thus be linked to a fail-ure of this compensation. Second, these findings tend to confirm the involvement of thalamic functional distur-bances in the etiology of fluctuations in DLB patients, as suggested by previous studies [10,18]. The thalamus has strong functional connections with cortical nodes of the SN, especially the anterior insula hub, and participates with it in a large-scale network integrating interoceptive inputs with cognitive inputs from other networks and generating viscero-autonomic, emotional, and cognitive processes in response to salient stimuli [67, 68]. More-over, the functional and structural connectivity of the thalamus with the DMN [69, 70] and the frontoparietal regions [71] was shown to be crucial for consciousness. The negative correlation between thalamic functional connectivity and fluctuation scores in the DLB group therefore seems concordant with the clinical characteris-tics of this symptom. Furthermore, this correlation could also be consistent with the results of our VBM analysis showing a negative correlation between fluctuation scores and gray matter volume in several cholinergic re-gions. Indeed, as mentioned by Peraza et al. [72], loss of cholinergic function may impair the ability of the cholin-ergic system to inhibit intracortical short-range func-tional connections, which is the mechanism by which the brain can enhance thalamocortical interactions in re-sponse to external stimuli [73, 74]. It is thus possible that both phenomena may contribute to the occurrence of fluctuations in DLB patients. Alternatively, thalamic functional disturbances could also be a consequence of cholinergic function deficits.
Overall, our results indicate that fluctuations in DLB pa-tients may derive more directly from functional connectivity disturbances than from clear structural impairments. This is concordant with recent data supporting the hypothesis that DLB is a primary synaptopathy [75], in which the accumula-tion of phosphorylatedα-synuclein in the form of small ag-gregates may cause synaptic dysfunction and loss that occur prior to Lewy body formation and neuronal loss and that are closely related to cognitive impairment.
This study has some potential limitations. First, DLB and AD patients were diagnosed based on clinical assess-ment, rather than a post-mortem pathological validation. However, diagnosis was made by experienced geriatri-cians, using standardized criteria with a high specificity confirmed by autopsy findings [76], and all participants were followed longitudinally. Second, fluctuations are a complex symptom encompassing attentional, cognitive, and alertness aspects that are mixed in the score obtained from the Mayo Fluctuation Scale, making the interpret-ation of the correlinterpret-ations with MRI measures more diffi-cult. These results thus need to be treated with caution.
Conclusions
Using both structural and functional MRI data, we found that functional connectivity changes, rather than signifi-cant gray matter loss, could play a role in the emergence of fluctuations in DLB patients. Notably, fluctuations in the DLB group appeared to be related to disturbances of the external functional connectivity of the salience net-work (responsible for switching between the default mode network and attentional executive networks), which may lead to less relevant transitions from one cognitive state to another in response to internal and en-vironmental stimuli. Higher fluctuation scores were also related to a lower thalamic functional connectivity, sug-gesting that the thalamus could be a key region for the occurrence of this symptom. More globally, our results underline the interest of considering large-scale brain networks to investigate the neural bases of DLB core symptoms such as fluctuations.
Supplementary information
The online version of this article (https://doi.org/10.1186/s13195-019-0575-z) contains supplementary material, which is available to authorized users.
Additional file 1: Table S1. MNI coordinates and anatomical labels of the regions of interest used in the functional connectivity analysis Additional file 2: Figure S1. Pattern of voxel-wise gray matter loss in DLB patients compared with healthy elderly subjects at a more permissive significance threshold (p<0.0001 uncorrected for multiple comparisons). Abbreviations: BC: brainstem, Thal: thalamus Abbreviations
ACC:Anterior cingulate cortex; AD: Alzheimer’s disease; AI: Anterior insula; ANOVA: Analysis of variance; BOLD: Blood oxygen level-dependent; CDR: Clinical dementia rating; CM2R: Centre Mémoire de Ressources et de Recherche; CPP: Comité de protection des personnes; DAN: Dorsal attention network; DARTEL: Diffeomorphic anatomical registration through
exponentiated lie algebra; DLB: Dementia with Lewy bodies; DMN: Default-mode network; FDR: False discovery rate; FEF: Frontal eye field;
FPN: Frontoparietal network; FWE: Family-wise error; HC: Healthy controls; HUS: University Hospital of Strasbourg; ICA: Independent component analysis; IPS: Intraparietal sulcus; LP: Lateral parietal cortex; LPFC: Lateral prefrontal cortex; MNI: Montreal Neurological Institute; MPFC: Medial prefrontal cortex; MPRAGE: Magnetization-prepared rapid gradient-echo; MRI: Magnetic resonance imaging; PCC: Precuneal cortex; PPC: Posterior parietal cortex; ROI: Region of interest; RPFC: Rostral prefrontal cortex; SI: Substantia innominata; SMG: Supramarginal gyrus; SN: Salience network;
SPECT: Single-photon emission computed tomography; SPM: Statistical Parametric Mapping; VBM: Voxel-based morphometry
Acknowledgements
We thank the patients and control subjects for their participation. We are grateful to Jean-Paul Armspach and Corinne Marrer from the“Plateforme IRIS, Faculté de Médecine, Université de Strasbourg” for MRI acquisition; to Thi-mothée Albasser, Mathias Bilger, Laure Di Bitonto, Emmanuelle Ehrhard, Cath-erine Kleitz, Nadine Longato, Laetitia Monjoin, Géraldine Heim, and Natacha Vogt for conducting neuropsychological assessments; to Marion Sourty and Daniel Roquet for allowing us to use their preprocessing pipeline; to Mary Mondino for her help with programming; to Julien Lamy for his advice and comments; to Anne Botzung and Lucie Rauch for their help with organization; and to Nick Barton for language editing.
Funding
This study was funded by Appel à Projet Interne (API) of the University Hospital of Strasbourg, Alsace Alzheimer 67, Fondation Université de Strasbourg, and Projet Hospitalier de Recherche Clinique (PHRC) inter-régional (IDRCB 2012-A00992-41), and a ministerial PhD scholarship.
Availability of data and materials
The datasets used and/or analyzed during the present study are available from the corresponding author on reasonable request.
Authors’ contributions
EC participated in the design of the study, performed the MRI preprocessing and the statistical analysis, interpreted the data, and drafted the manuscript. VN participated in the design of the study and performed the MRI preprocessing. PLDS optimized the MRI sequences. CD, NP, CM, PA, CMH, and BC examined the patients and diagnosed patients with DLB and AD. FB conceived of the study, participated in its design and coordination, examined patients, diagnosed patients with DLB and AD, interpreted the data, and revised the manuscript. All authors read and approved the final manuscript.
Ethics approval and consent to participate
This research was approved by the local ethics committee (“Comité de Protection des Personnes Strasbourg Est IV”). All participants provided written informed consent to participate.
Consent for publication
Written informed consent was obtained from the participants for publication of their individual details and accompanying images in this manuscript. The consent form is held by the authors’ institution and is available for review by the Editor-in-Chief.
Competing interests
The authors declare that they have no competing interests. Author details
1ICube Laboratory UMR 7357 and FMTS (Fédération de Médecine
Translationnelle de Strasbourg), Team IMIS, University of Strasbourg and CNRS, Strasbourg, France.2CM2R (Research and Resources Memory Centre),
Geriatrics Department, University Hospitals of Strasbourg, Geriatric Day Hospital and Neuropsychology Unit, Strasbourg, France.3INSERM Centre
d’Investigation Clinique 1434, University Hospitals of Strasbourg, Strasbourg, France.4General Hospital Centre, Geriatrics Department, CM2R, Geriatric Day
Hospital, Colmar, France.
Received: 1 May 2019 Accepted: 23 December 2019
References
1. McKeith IG, Boeve BF, Dickson DW, Halliday G, Taylor J-P, Weintraub D, et al. Diagnosis and management of dementia with Lewy bodies: Fourth consensus report of the DLB Consortium. Neurology. 2017;89(1):88–100. 2. McKeith IG, Dickson DW, Lowe J, Emre M, O’Brien JT, Feldman H, et al.
Diagnosis and management of dementia with Lewy bodies: third report of the DLB Consortium. Neurology. 2005;65(12):1863–72.
3. Ballard C, O’Brien J, Gray A, Cormack F, Ayre G, Rowan E, et al. Attention and fluctuating attention in patients with dementia with Lewy bodies and Alzheimer disease. Arch Neurol. 2001;58(6):977–82.
4. Mainland BJ, Herrmann N, Mallya S, Fiocco AJ, Sin G-L, Shulman KI, et al. Cognitive fluctuations and cognitive test performance among institutionalized persons with dementia. Am J Alzheimers Dis Other Dement. 2017;32(7):393–400.
5. Zweig YR, Galvin JE. Lewy body dementia: the impact on patients and caregivers. Alzheimers Res Ther. 2014;6(2):21.
6. Ferman TJ, Smith GE, Boeve BF, Ivnik RJ, Petersen RC, Knopman D, et al. DLB fluctuations: specific features that reliably differentiate DLB from AD and normal aging. Neurology. 2004;62(2):181–7.
7. Walker MP, Ayre GA, Cummings JL, Wesnes K, McKeith IG, O’Brien JT, et al. The clinician assessment of fluctuation and the one day fluctuation assessment scale. Two methods to assess fluctuating confusion in dementia. Br J Psychiatry J Ment Sci. 2000;177:252–6.
8. Van Dyk K, Towns S, Tatarina O, Yeung P, Dorrejo J, Zahodne LB, et al. Assessing fluctuating cognition in dementia diagnosis: Interrater reliability of the clinician assessment of fluctuation. Am J Alzheimers Dis Other Dement. 2016;31(2):137–43.
9. Bradshaw J, Saling M, Hopwood M, Anderson V, Brodtmann A. Fluctuating cognition in dementia with Lewy bodies and Alzheimer’s disease is qualitatively distinct. J Neurol Neurosurg Psychiatry. 2004;75(3):382–7. 10. Delli Pizzi S, Franciotti R, Taylor J-P, Thomas A, Tartaro A, Onofrj M, et al.
Thalamic involvement in fluctuating cognition in dementia with Lewy bodies: magnetic resonance evidences. Cereb Cortex. 2015;25(10):3682–9. 11. Watson R, Colloby SJ, Blamire AM, Wesnes KA, Wood J, O’Brien JT. Does
attentional dysfunction and thalamic atrophy predict decline in dementia with Lewy bodies? Parkinsonism Relat Disord. 2017;45:69–74.
12. Colloby SJ, Elder GJ, Rabee R, O’Brien JT, Taylor J-P. Structural grey matter changes in the substantia innominata in Alzheimer’s disease and dementia with Lewy bodies: a DARTEL-VBM study. Int J Geriatr Psychiatry. 2017;32(6):615–23.
13. Taylor J-P, Colloby SJ, McKeith IG, O’Brien JT. Covariant perfusion patterns provide clues to the origin of cognitive fluctuations and attentional dysfunction in dementia with Lewy bodies. Int Psychogeriatr. 2013;25(12): 1917–28.
14. Peraza LR, Kaiser M, Firbank M, Graziadio S, Bonanni L, Onofrj M, et al. fMRI resting state networks and their association with cognitive fluctuations in dementia with Lewy bodies. Neuroimage Clin. 2014;4:558–65.
15. Bonanni L, Thomas A, Tiraboschi P, Perfetti B, Varanese S, Onofrj M. EEG comparisons in early Alzheimer’s disease, dementia with Lewy bodies and Parkinson’s disease with dementia patients with a 2-year follow-up. Brain. 2008;131(3):690–705.
16. Bonanni L, Perfetti B, Bifolchetti S, Taylor J-P, Franciotti R, Parnetti L, et al. Quantitative electroencephalogram utility in predicting conversion of mild cognitive impairment to dementia with Lewy bodies. Neurobiol Aging. 2015;36(1):434–45.
17. Stylianou M, Murphy N, Peraza LR, Graziadio S, Cromarty R, Killen A, et al. Quantitative electroencephalography as a marker of cognitive fluctuations in dementia with Lewy bodies and an aid to differential diagnosis. Clin Neurophysiol. 2018;129(6):1209–20.
18. O’Brien JT, Firbank MJ, Mosimann UP, Burn DJ, McKeith IG. Change in perfusion, hallucinations and fluctuations in consciousness in dementia with Lewy bodies. Psychiatry Res Neuroimaging. 2005;139(2):79–88.
19. Franciotti R, Falasca NW, Bonanni L, Anzellotti F, Maruotti V, Comani S, et al. Default network is not hypoactive in dementia with fluctuating cognition: an Alzheimer disease/dementia with Lewy bodies comparison. Neurobiol Aging. 2013;34(4):1148–58.
20. Dubois B, Feldman HH, Jacova C, DeKosky ST, Barberger-Gateau P, Cummings J, et al. Research criteria for the diagnosis of Alzheimer’s disease: revising the NINCDS–ADRDA criteria. Lancet Neurol. 2007;6(8):734–46. 21. Kemp J, Philippi N, Phillipps C, Demuynck C, Albasser T, Martin-Hunyadi C,
et al. Cognitive profile in prodromal dementia with Lewy bodies. Alzheimers Res Ther. 2017;9(1):19.
22. Good CD, Johnsrude IS, Ashburner J, Henson RN, Friston KJ, Frackowiak RS. A voxel-based morphometric study of ageing in 465 normal adult human brains. Neuroimage. 2001;14(1 Pt 1):21–36.
23. Ashburner J, Friston KJ. Unified segmentation. Neuroimage. 2005;26(3):839–51. 24. Muschelli J, Nebel MB, Caffo BS, Barber AD, Pekar JJ, Mostofsky SH.
Reduction of motion-related artifacts in resting state fMRI using aCompCor. NeuroImage. 2014;96:22–35.
25. Friston KJ, Holmes AP, Worsley KJ, Poline J-P, Frith CD, Frackowiak RSJ. Statistical parametric maps in functional imaging: a general linear approach. Hum Brain Mapp. 1994;2(4):189–210.
26. Whitfield-Gabrieli S, Nieto-Castanon A. Conn: a functional connectivity toolbox for correlated and anticorrelated brain networks. Brain Connectivity. 2012;2(3):125–41.
27. Desikan RS, Ségonne F, Fischl B, Quinn BT, Dickerson BC, Blacker D, et al. An automated labeling system for subdividing the human cerebral cortex on MRI scans into gyral based regions of interest. NeuroImage. 2006;31(3):968–80.
28. Scheltens P, Leys D, Barkhof F, Huglo D, Weinstein HC, Vermersch P, et al. Atrophy of medial temporal lobes on MRI in « probable » Alzheimer’s disease and normal ageing: diagnostic value and neuropsychological correlates. J Neurol Neurosurg Psychiatry. 1992; 55(10):967–72.
29. Watson R, O’Brien JT, Barber R, Blamire AM. Patterns of gray matter atrophy in dementia with Lewy bodies: a voxel-based morphometry study. Int Psychogeriatr. 2012;24(4):532–40.
30. Burton EJ, Karas G, Paling SM, Barber R, Williams ED, Ballard CG, et al. Patterns of cerebral atrophy in dementia with Lewy bodies using voxel-based morphometry. NeuroImage. 2002;17(2):618–30.
31. Zhong J, Pan P, Dai Z, Shi H. Voxelwise meta-analysis of gray matter abnormalities in dementia with Lewy bodies. Eur J Radiol. 2014;83(10): 1870–4.
32. Blanc F, Colloby SJ, Cretin B, de Sousa PL, Demuynck C, O’Brien JT, et al. Grey matter atrophy in prodromal stage of dementia with Lewy bodies and Alzheimer’s disease. Alzheimers Res Ther. 2016;8(1):31.
33. Roquet D, Noblet V, Anthony P, Philippi N, Demuynck C, Cretin B, et al. Insular atrophy at the prodromal stage of dementia with Lewy bodies: a VBM DARTEL study. Sci Rep. 2017;7(1):9437.
34. Fathy YY, Jonker AJ, Oudejans E, de Jong FJJ, van Dam A-MW, Rozemuller AJM, et al. Differential insular cortex subregional vulnerability toα-synuclein pathology in Parkinson’s disease and dementia with Lewy bodies. Neuropathol Appl Neurobiol. 2019;45(3):262–77.
35. Watson R, Colloby SJ, Blamire AM, O’Brien JT. Subcortical volume changes in dementia with Lewy bodies and Alzheimer’s disease. A comparison with healthy aging. Int Psychogeriatr. 2016;28(4):529–36.
36. Whitwell JL, Weigand SD, Shiung MM, Boeve BF, Ferman TJ, Smith GE, et al. Focal atrophy in dementia with Lewy bodies on MRI: a distinct pattern from Alzheimer’s disease. Brain. 2007;130(Pt 3):708–19.
37. Cousins DA, Burton EJ, Burn D, Gholkar A, McKeith IG, O’Brien JT. Atrophy of the putamen in dementia with Lewy bodies but not Alzheimer’s disease: an MRI study. Neurology. 2003;61(9):1191–5.
38. Shimizu S, Hanyu H, Hirao K, Sato T, Iwamoto T, Koizumi K. Value of analyzing deep gray matter and occipital lobe perfusion to differentiate dementia with Lewy bodies from Alzheimer’s disease. Ann Nucl Med déc. 2008;22(10):911–6.
39. Watson R, Colloby SJ. Imaging in dementia with Lewy bodies: an overview. J Geriatr Psychiatry Neurol. 2016;29(5):254–60.
40. Surendranathan A, O’Brien JT. Clinical imaging in dementia with Lewy bodies. Evid Based Mental Health. 2018;21(2):61–5.
41. Nieuwenhuys R. The insular cortex: A review. In: Hofman MA, Falk D, editors. Progress in brain research: evolution of the primate brain; vol. 195: Elsevier; 2012. p. 123–63.
42. Sridharan D, Levitin DJ, Menon V. A critical role for the right fronto-insular cortex in switching between central-executive and default-mode networks. PNAS. 2008;105(34):12569–74.
43. Perry E, Walker M, Grace J, Perry R. Acetylcholine in mind: a neurotransmitter correlate of consciousness? Trends Neurosci. 1999;22(6):273–80.
44. Klinkenberg I, Sambeth A, Blokland A. Acetylcholine and attention. Behav Brain Res. 2011;221(2):430–42.
45. Tiraboschi P, Hansen LA, Alford M, Merdes A, Masliah E, Thal LJ, et al. Early and widespread cholinergic losses differentiate dementia with Lewy bodies from Alzheimer disease. Arch Gen Psychiatry. 2002;59(10):946–51. 46. Francis PT, Perry EK. Cholinergic and other neurotransmitter mechanisms in
Parkinson’s disease, Parkinson’s disease dementia, and dementia with Lewy bodies. Mov Disord. 2007;22(S17):S351–7.
47. Tiraboschi P, Hansen LA, Alford M, Sabbagh MN, Schoos B, Masliah E, et al. Cholinergic dysfunction in diseases with Lewy bodies. Neurology. 2000; 54(2):407–11.
48. Shimada H, Hirano S, Sinotoh H, Ota T, Tanaka N, Sato K, et al. Dementia with Lewy bodies can be well-differentiated from Alzheimer’s disease by
measurement of brain acetylcholinesterase activity-a [11C]MP4A PET study. Int J Geriatr Psychiatry. 2015;30(11):1105–13.
49. Perry EK, Morris CM, Court JA, Cheng A, Fairbairn AF, McKeith IG, et al. Alteration in nicotine binding sites in Parkinson’s disease, Lewy body dementia and Alzheimer’s disease: possible index of early neuropathology. Neuroscience. 1995;64(2):385–95.
50. Piggott MA, Owens J, O’Brien J, Colloby S, Fenwick J, Wyper D, et al. Muscarinic receptors in basal ganglia in dementia with Lewy bodies, Parkinson’s disease and Alzheimer’s disease. J Chem Neuroanatomy. 2003; 25(3):161–73.
51. O’Brien JT, Colloby SJ, Pakrasi S, Perry EK, Pimlott SL, Wyper DJ, et al. Nicotinic alpha4beta2 receptor binding in dementia with Lewy bodies using 123I-5IA-85380 SPECT demonstrates a link between occipital changes and visual hallucinations. Neuroimage. 2008;40(3):1056–63.
52. Aarsland D, Mosimann UP, McKeith IG. Role of cholinesterase inhibitors in Parkinson’s disease and dementia with Lewy bodies. J Geriatr Psychiatry Neurol. 2004;17(3):164–71.
53. Wesnes KA, McKeith IG, Ferrara R, Emre M, Ser TD, Spano PF, et al. Effects of rivastigmine on cognitive function in dementia with Lewy bodies: a randomised placebo-controlled international study using the cognitive drug research computerised assessment system. DEM. 2002;13(3):183–92. 54. Pimlott SL, Piggott M, Ballard C, McKeith I, Perry R, Kometa S, et al. Thalamic
nicotinic receptors implicated in disturbed consciousness in dementia with Lewy bodies. Neurobiol Dis. 2006;21(1):50–6.
55. Szot P, White SS, Greenup JL, Leverenz JB, Peskind ER, Raskind MA. Compensatory changes in the noradrenergic nervous system in the locus ceruleus and hippocampus of postmortem subjects with Alzheimer’s disease and dementia with Lewy bodies. J Neurosci. 2006;26(2):467–78. 56. O’Brien JT, Colloby S, Fenwick J, Williams ED, Firbank M, Burn D, et al.
Dopamine transporter loss visualized with FP-CIT SPECT in the differential diagnosis of dementia with Lewy bodies. Arch Neurol. 2004;61(6):919–25. 57. Badhwar A, Tam A, Dansereau C, Orban P, Hoffstaedter F, Bellec P.
Resting-state network dysfunction in Alzheimer’s disease: a systematic review and meta-analysis. Alzheimers Dement. 2017;8:73–85.
58. Zhou J, Greicius MD, Gennatas ED, Growdon ME, Jang JY, Rabinovici GD, et al. Divergent network connectivity changes in behavioural variant frontotemporal dementia and Alzheimer’s disease. Brain. 2010;133(5):1352–67.
59. Balthazar MLF, Pereira FRS, Lopes TM, da Silva EL, Coan AC, Campos BM, et al. Neuropsychiatric symptoms in Alzheimer’s disease are related to functional connectivity alterations in the salience network. Hum Brain Mapp. 2014;35(4):1237–46.
60. Wang Z, Xia M, Dai Z, Liang X, Song H, He Y, et al. Differentially disrupted functional connectivity of the subregions of the inferior parietal lobule in Alzheimer’s disease. Brain Struct Funct. 2015;220(2):745–62.
61. Xie C, Bai F, Yu H, Shi Y, Yuan Y, Chen G, et al. Abnormal insula functional network is associated with episodic memory decline in amnestic mild cognitive impairment. Neuroimage. 2012;63(1):320–7.
62. Brier MR, Thomas JB, Snyder AZ, Benzinger TL, Zhang D, Raichle ME, et al. Loss of intranetwork and internetwork resting state functional connections with Alzheimer’s disease progression. J Neurosci. 2012;32(26):8890–9. 63. Lowther ER, O’Brien JT, Firbank MJ, Blamire AM. Lewy body compared with
Alzheimer dementia is associated with decreased functional connectivity in resting state networks. Psychiatry Res Neuroimaging. 2014;223(3):192–201. 64. Spreng RN, Stevens WD, Chamberlain JP, Gilmore AW, Schacter DL. Default
network activity, coupled with the frontoparietal control network, supports goal-directed cognition. NeuroImage. 2010;53(1):303–17.
65. Hellyer PJ, Shanahan M, Scott G, Wise RJS, Sharp DJ, Leech R. The control of global brain dynamics: opposing actions of frontoparietal control and default mode networks on attention. J Neurosci. 2014;34(2):451–61. 66. Goulden N, Khusnulina A, Davis NJ, Bracewell RM, Bokde AL, McNulty JP,
et al. The salience network is responsible for switching between the default mode network and the central executive network: replication from DCM. Neuroimage. 2014;99:180–90.
67. Zhou J, Seeley WW. Network dysfunction in Alzheimer’s disease and frontotemporal dementia: implications for psychiatry. Biol Psychiatry. 2014; 75(7):565–73.
68. Uddin LQ. Salience processing and insular cortical function and dysfunction. Nat Rev Neurosci. 2015;16(1):55–61.
69. Boly M, Tshibanda L, Vanhaudenhuyse A, Noirhomme Q, Schnakers C, Ledoux D, et al. Functional connectivity in the default network during
resting state is preserved in a vegetative but not in a brain dead patient. Hum Brain Mapp. 2009;30(8):2393–400.
70. Fernández-Espejo D, Soddu A, Cruse D, Palacios EM, Junque C,
Vanhaudenhuyse A, et al. A role for the default mode network in the bases of disorders of consciousness. Ann Neurology. 2012;72(3):335–43. 71. Crone JS, Soddu A, Höller Y, Vanhaudenhuyse A, Schurz M, Bergmann J,
et al. Altered network properties of the fronto-parietal network and the thalamus in impaired consciousness. NeuroImage: Clinical. 2014;4:240–8. 72. Peraza LR, Taylor J-P, Kaiser M. Divergent brain functional network
alterations in dementia with Lewy bodies and Alzheimer’s disease. Neurobiol Aging. 2015a;36(9):2458–67.
73. Picciotto MR, Higley MJ, Mineur YS. Acetylcholine as a neuromodulator: cholinergic signaling shapes nervous system function and behavior. Neuron. 2012;76(1):116–29.
74. Lucas-Meunier E, Fossier P, Baux G, Amar M. Cholinergic modulation of the cortical neuronal network. Pflugers Arch - Eur J Physiol. 2003;446(1):17–29. 75. Colom-Cadena M, Pegueroles J, Herrmann AG, Henstridge CM, Muñoz L,
Querol-Vilaseca M, et al. Synaptic phosphorylatedα-synuclein in dementia with Lewy bodies. Brain. 2017;140(12):3204–14.
76. McKeith IG, Ballard CG, Perry RH, Ince PG, O’Brien JT, Neill D, et al. Prospective validation of consensus criteria for the diagnosis of dementia with Lewy bodies. Neurology. 2000;54(5):1050–8.
Publisher’s Note
Springer Nature remains neutral with regard to jurisdictional claims in published maps and institutional affiliations.