HAL Id: inserm-01124422
https://www.hal.inserm.fr/inserm-01124422
Submitted on 6 Mar 2015HAL is a multi-disciplinary open access archive for the deposit and dissemination of sci-entific research documents, whether they are pub-lished or not. The documents may come from teaching and research institutions in France or abroad, or from public or private research centers.
L’archive ouverte pluridisciplinaire HAL, est destinée au dépôt et à la diffusion de documents scientifiques de niveau recherche, publiés ou non, émanant des établissements d’enseignement et de recherche français ou étrangers, des laboratoires publics ou privés.
Infant feeding patterns over the first year of life:
influence of family characteristics
Aisha Betoko, Marie-Aline Charles, Régis Hankard, Anne Forhan, Mercedes
Bonet, Marie-Josephe Saurel-Cubizolles, Barbara Heude, Blandine de
Lauzon-Guillain
To cite this version:
Aisha Betoko, Marie-Aline Charles, Régis Hankard, Anne Forhan, Mercedes Bonet, et al.. Infant feeding patterns over the first year of life: influence of family characteristics. European Journal of Clinical Nutrition, Nature Publishing Group, 2013, 67 (6), pp.631-7. �10.1038/ejcn.2012.200�. �inserm-01124422�
1
Infant feeding patterns over the first year of life: influence of family characteristics 1
Aisha Betoko MPH1,2, Marie-Aline Charles MD MPH1,2, Régis Hankard MD3, Anne Forhan
2
MPH1,2, Mercedes Bonet PhD4,5, Marie-Josephe Saurel-Cubizolles PhD4,5, Barbara Heude
3
PhD1,2, Blandine de Lauzon-Guillain PhD1,2 and the EDEN mother-child cohort study group.
4
1
INSERM, CESP, Centre for research in Epidemiology and Population Health, UMR-S 1018,
5
Epidemiology of diabetes, obesity and chronic kidney disease over the life course, F-94807,
6
Villejuif, France.
7 2
Paris Sud 11 University, UMR-S 1018, F-94807, Villejuif, France.
8 3
INSERM, CIC 0802, Poitiers, F-86000, France; University of Poitiers, Poitiers, F-86000,
9
France.
10 4
INSERM, UMRS 953, Epidemiological Research Unit on Perinatal Health and Women's and
11
Children's Health, F-94807, Villejuif, France.
12 5
UPMC, Paris 06 University, Paris, France.
13 14 Corresponding author: 15 Betoko Aisha, 16 INSERM UMRS 1018 17
15-16 av. Paul Vaillant Couturier, 94807 Villejuif, FRANCE
18
Tel: +33145595194; Fax: +3314726945; aisha.betoko@inserm.fr 19
2
Abstract 21
Background/Objectives: Early eating patterns and behaviors can determine later eating 22
habits and food preferences and they have been related to the development of childhood
23
overweight and obesity. We aimed to identify patterns of feeding in the first year of life and to
24
examine their associations with family characteristics.
25
Subjects/Methods: Our analysis included 1004 infants from the EDEN mother-child cohort. 26
Feeding practices were assessed through maternal self-report at birth, 4, 8 and 12 months.
27
Principal component analysis was applied to derive patterns from breastfeeding duration, age
28
at complementary food (CF) introduction and type of food used at 1y. Associations between
29
patterns and family characteristics were analyzed by linear regressions.
30
Results: The main source of variability in infant feeding was characterized by a pattern 31
labeled ‘Late CF introduction and use of ready-prepared baby foods’. Older, more educated,
32
primiparous women with high monthly income ranked high on this pattern. The second
33
pattern, labeled ‘Longer breastfeeding, late CF introduction and use of home-made foods’ was
34
the closest to infant feeding guidelines. Mothers ranking high on this pattern were older and
35
more educated. The third pattern, labeled ‘Use of adults’ foods’ suggests a less age-specific
36
diet for the infants. Mothers ranking high on this pattern were often younger and multiparous.
37
Recruitment center was related to all patterns.
38
Conclusion: Not only maternal education level and age but also parity and region are 39
important contributors to the variability in patterns. Further studies are needed to describe
40
associations between these patterns and infant growth and later food preferences.
41
42
Keywords: Feeding patterns – Breastfeeding – Complementary feeding – Home-made 43
foods – Ready-prepared foods – Infants – Parents – Sociodemographic factors.
44
45
Number of words (Abstract): 250 46
Number of words (main text): 3000 47
Running title: Infant feeding patterns: the influence of family characteristics 48
3
Introduction 50
Obesity is a worldwide epidemic and numerous studies have focused on the identification of
51
its early determinants. The early postnatal period appears to be a critical window of
52
development. Observational studies showed that rapid infant weight gain increases the risk of
53
overweight and obesity later in childhood1-3. Moreover, childhood obesity seems to track into
54
adulthood4 increasing the risk of chronic diseases5. Early eating patterns and behaviors can
55
determine later eating habits and food preferences6-7 and they have been related to the
56
development of childhood overweight and obesity8. It’s therefore important to identify
57
feeding patterns that emerge in the early infancy and related factors.
58
Most of the pediatric societies recommend exclusive breastfeeding until 6 months of age9-12.
59
Further, there is a general consensus on the fact that complementary feeding should not be
60
introduced to infant diet before 4 months or delayed after 6 months. Results from various
61
studies of infant feeding practices have shown high level of non-compliance with these
62
recommendations. Across studies, lower maternal age and education level appeared
63
consistently related to shorter breastfeeding duration and early complementary food (CF)
64
introduction13-15.
65
There has been a general cultural shift in eating practices over the last decades. Because more
66
women are working longer hours outside home, there is a decrease in time spent in meal
67
preparations and an increased use of ready-prepared foods16-17. Much remains to be learned
68
about how these emerging eating habits affect maternal feeding practices.
69
A few studies showed that dietary patterns emerge in early infancy18-19 and track into
70
childhood20-21. None of those studies have undertaken a global approach of food intake over
71
the first year of life by taking into account type and duration of milk feeding, age at CF
72
introduction and type of food used by the mother. Yet, breastfeeding and complementary
73
feeding practices are interrelated22-23 and there are arguments to suggest that both influence
74
later health24-25. Our aims were to identify feeding patterns over the first year of life, and to
75
examine their associations with parental and infants characteristics.
76 77
4
Material and Methods 78
Study population 79
Subjects were participants of the EDEN mother-child prospective cohort (study of pre- and
80
early postnatal determinants of child health and development). Between 2003 and 2006, the
81
study recruited 2,002 pregnant women aged 18-45 years attending their prenatal visit before
82
24 weeks gestation at Nancy and Poitiers University Hospitals. Exclusion criteria were
83
multiple pregnancies, diabetes history, illiteracy, moving outside the region planned in the
84
next three years. The study received approval from relevant ethics committee. Files have been
85
declared to the ‘National Committee for Processed Data and Freedom’ (CNIL). Written
86
consents were obtained from each participant.
87
Infant feeding assessment 88
Our infant feeding assessment concentrated on qualitative aspects controlled by the parents
89
and did not include amounts of food ingested, which depend for a great part on the infant.
90
Infant feeding mode at discharge was extracted from medical records. In the 4, 8 and
12-91
month self questionnaires, mothers reported (1)type of milk feeding and when necessary date
92
of breastfeeding cessation, (2)age at CF introduction. Among infants whose questionnaires
93
were returned, reported data at the different ages were combined to estimate any and full
94
breastfeeding duration and age at CF introduction. In EDEN study, ages of CF introduction
95
were not collected beyond 8 months for cereals, fruit, vegetables, potatoes, fruit juice, dairy
96
products, dairy desserts, cheeses, biscuits, or 12 months for the other foods. For infants who
97
were not introduced to a specific food by 8 or 12 months, respectively the values 9 or 13 were
98
attributed in order to analyze the variable quantitatively. For infants with available
99
information on diet in at least one questionnaire, missing data for some of the key variables
100
were imputed as follows: when mothers reported that the considered food was not introduced
101
in the first 4 months and information was missing in the following questionnaires, the median
102
age of introduction among all infants who have been introduced to that food between 4 and 12
103
months was attributed (n=27, 0.03%). The same rule was applied for those who were not
104
introduced to foods at 8 months with missing information on at least one CF group at 12
105
months (n=233, 23.2%).
5 An additional questionnaire on type of food used for the baby at 12 months was added to the
107
12-month questionnaire during data collection. It collected information on type
(ready-108
prepared baby foods, home-made foods, ready-prepared adults’ foods) and frequency of use
109
(never, occasionally, regularly, always) of various food and juice groups (dairy products,
110
soups, vegetables and fruit purees, fruit juices, biscuits, cereals, meat and fish). Subjects
111
with >2 missing values on the listed items were excluded (n=183, 15.4%); otherwise modal
112
value of the considered variable was imputed (n=57; 4.8%).
113
Other data 114
Between 24-28 weeks gestation, household income, maternal education and pre-pregnancy
115
weight were obtained by interviewing the mother; maternal height was measured in a clinical
116
examination. Paternal anthropometric measurements were collected at some point between
117
mother’s inclusion and delivery. Details on measurement protocol have been published
118
elsewhere26. When measurements were unavailable from the father, reported weight by the
119
father (11.3%) was used, and reported height by the father (11.6%) or by the mother (6.3%)
120
was used. Parental BMI(kg/m²) were categorized as : underweight (BMI<18.5), normal
121
weight (18.5-<25), overweight (25-<30) and obese (BMI ≥30). Because of small number of
122
underweight fathers in EDEN cohort (n=19; 1.0%), underweight fathers were grouped in the
123
normal BMI categories.
124
From obstetrical and pediatric records, parity, infant gender, birthweight and gestational age
125
were collected. In the 4, 8 and 12-month questionnaires, mothers were asked information
126
about employment status and main type of childcare. Types of childcare were (1)childcare
127
center, (2)licensed family childcare home, (3)family member, neighbor and (4)child’s own
128
home by a nanny or a regular infant sitter or parents themselves. Infants were categorized
129
according to age of first attendance to types (1) and (2).
130
Missing data were handled as follows: when percentage of missing values was <5%, we
131
imputed the modal class value (maternal education and BMI, household income, parity),
132
otherwise subjects were grouped into a separate category (paternal BMI, childcare
133
attendance).
134 135
6
Sample 136
Of the 2,002 recruited women, 96 were excluded because they left the study before or at
137
delivery for personal reasons, 4 because intra-uterine death, 3 because they delivered outside
138
the study hospitals. Birthweight was available for 1,899 newborns. The 4, 8 and 12
month-139
questionnaires of 1,445 infants were returned. Because the additional questionnaire on type of
140
food used at 12 months was added to the 12-month questionnaire during data collection, 496
141
of the recruited families did not receive it. Among the 1,445 families who returned the 4, 8
142
and 12-month questionnaires 1,187 also returned the additional questionnaire and 183 had
143
more than 2 missing data on type of food used. The final sample consisted of 1,004 infants.
144
Compared with the 1,004 included, the 895 excluded mothers were younger (29.0 vs. 29.9
145
years old, p<0.001), less educated (44.6% vs. 59.2% university degree, p<0.001) and often
146
multiparous (58.3% vs. 52.9%, p=0.03). Infants that were not included had lower birthweight
147
and gestational age than that of included infants (3,252g vs. 3,302g, p=0.04; 39.1 vs. 39.4,
148
p<0.001). There was no statistical difference on gender (p=0.18).
149
Patterns derivation 150
All the variables described in the infant feeding assessment section were considered for
151
principal component analysis (PCA). PCA is a statistical technique that aggregates variables
152
on the basis of the degree to which they are correlated to one another, producing components
153
that are uncorrelated linear combinations of the initial variables and that maximize the
154
explained variance27-28. To determine the number of components to retain, we used the Kaiser
155
criterion (eigenvalues>1) in conjunction to scree test (plot of total variance associated with
156
each component) and interpretability of components. The first 3 components were kept from
157
this analysis. We considered that variables with coefficients>|0.3| contribute significantly to
158
the components. Finally, for each participant, a score was calculated as a sum of the products
159
of the values of each of the standardized variables included in the PCA with the
160
corresponding coefficients of the correlation matrix.
161
Statistical analysis 162
Infants’ scores on the feeding patterns were used as continuous dependent variables.
163
Unadjusted relations between patterns scores and recruitment centre, parental (maternal
7 education, age at delivery, BMI and employment status, parity, paternal BMI, income) and
165
infant characteristics (gender, birthweight, gestational age, childcare attendance) were
166
performed by Student t-test or ANOVA for categorical variables, and Spearman correlations
167
for quantitative variables (data not shown). Quartiles of the scores were calculated for
168
presentation purpose. Associations between the pattern scores and family characteristics were
169
examined using multiple regression models. Analyses were executed with SAS software
170
(version 9.2; SAS Institute). A p-value<0.05 was considered statistically significant.
171
Results 172
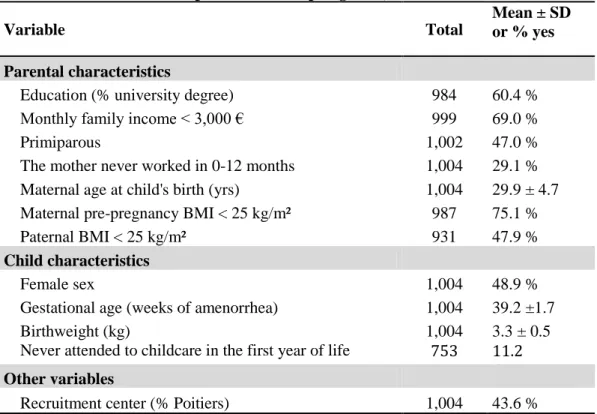
Family characteristics are presented in Table1. The mean birthweight was 3,302 g and 4.1%
173
of the infants were born preterm. The mean duration of full breastfeeding since hospital
174
discharge and age at CF introduction were 2 and 4.5 months respectively. Nearly 26% infants
175
were introduced to solid foods before 4 months.
176
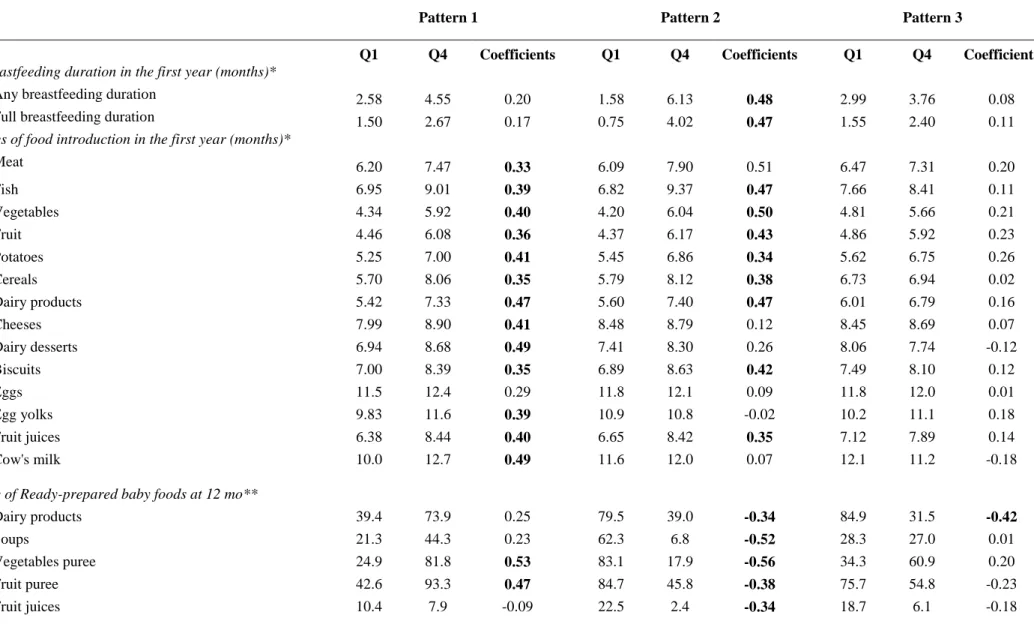
The first pattern (pattern-1) was characterized by high positive coefficients for introduction of
177
all foods and use of ready-prepared vegetables, fruit purees and baby main meals but by high
178
negative coefficients for use of home-made and ready-prepared adults’ foods (Table 2). It was
179
labeled ‘Late CF introduction and use of baby foods’. The second pattern (pattern-2) was
180
termed ‘Longer breastfeeding, late CF introduction and use of home-made foods’ since it
181
showed high positive coefficients for breastfeeding duration, age of introduction of meat, fish,
182
vegetables, fruit, potatoes, cereals, dairy products, biscuits and fruit juices and for use of
183
home-made soups, vegetables, fruit purees and fresh meat and fish but high negative
184
coefficients for use of baby foods. The third pattern (pattern-3) was named ‘Use of adults’
185
foods’ as it was characterized by high coefficients on use of ready-prepared dairy products, 186
soups, fruit purees, fruit juices and biscuits contrasting with lower coefficients on baby dairy
187
products and on home-made fruit and vegetable purees, fish and meat. The patterns explained
188
14.7, 12.7, and 6.0% of the variation in the original data respectively. PCA properties allow
189
maximization of variance along each pattern, contrasting individuals whose characteristics
190
differ most29. Thus, for each pattern, scores define the position of each individual along a
191
gradient. To facilitate interpretation of the pattern coefficients, distribution of the original
192
variables within the first and fourth quartiles of the patterns scores have been presented in
193
table 2. The higher the coefficient of a variable on a pattern, the greater is the variability in its
194
distribution across quartiles of the patterns scores.
8 High scores on pattern-1 were significantly related to high family income, maternal age and
196
education, low parity, tended to be more common in females (Table 3). Mothers of infants
197
with high scores on pattern-2 were more likely to be older, to have high education level, and
198
less likely to be obese. High scores on pattern-3 were significantly associated with low
199
maternal age, being multiparous. None of the patterns was significantly related to paternal
200
BMI and infant’s gestational age.
201
We ran the same multivariate models, excluding premature infants (n=27, 0.03%), then
202
excluding subjects having missing values on parental characteristics (n=88, 5.5%). Results
203
remained similar to those presented above (data not shown). Further analyses were performed
204
excluding infants with missing value on CF introduction between 4-12 months (n=27, 0.03%),
205
between 8-12 months (n=233, 23.2%) and type of food use at 12 months (n=57; 4.8%).
206
Results were similar to those presented except for centre that was no longer significantly
207
related to pattern-2 (0.10[-0.07, 0.26]) and pattern-3 (-0.16[-0.32, 0.01]).
208
Discussion 209
In our study, the main source of variability in infant feeding was characterized by pattern-1
210
labeled ‘Late CF introduction and use of ready-prepared baby foods’. Older, more educated,
211
primiparous women with high monthly income ranked high on this pattern. Pattern-2, labeled
212
‘Longer breastfeeding, late CF introduction and use of home-made was the closest to infant
213
feeding guidelines. Mothers with high scores on this pattern were older and more educated.
214
Pattern-3, labeled Use of adults’ foods suggests a less age-specific diet for the infants.
215
Mothers ranking high on this pattern were often younger and multiparous.
216
Recent studies in infants have applied PCA on various food items (from food frequency
217
questionnaires (FFQ)) to derive dietary patterns with a transversal approach18-19. Our study is
218
original in its longitudinal aspect: we used breastfeeding duration, age at CF introduction and
219
type of food used at 12 months. This approach enabled us to appreciate the prospective aspect
220
of infant feeding in the first year of life. Although some differences in variables included, our
221
second pattern was similar to the ‘infant guidelines’ pattern of the Southampton Women
222
Study18 and to the ‘Breastfeeding’ pattern of ALSPAC study19, both extracted at 6 months and
223
characterized by longer breastfeeding, high frequency of consumption of home-made foods
224
but low frequency of use of baby foods.
9 In our study, mothers of infants ranking high on pattern-1 and pattern-3, more often recruited
226
in Nancy, were more likely to use ready-prepared foods but in pattern-1, types of food were
227
adapted to infants whereas in pattern-3, types of food were less specific to infants. In patterns
228
1 and 2, age of introduction of eggs contributed little to the characterization of early or late
229
introducers of CF, showing that the recommendation of late introduction of eggs (see table 2
230
footnote) is well met by the mothers in our cohort. Higher scores on pattern-1 seem to be
231
explained by awareness of specific nutritional needs for infant, lack time or culinary skills to
232
implement it and income allowing the use of ready-prepared infant foods. Higher scores on
233
pattern-3 were mainly related to low maternal age and increased parity. Young mothers of our
234
study seem to cook less and the presence of older children in the household decreases the
235
likelihood for a specific diet for the infant. Unlike others, mothers ranking high on pattern-2,
236
more often recruited in Poitiers, breastfed longer, introduced CF later and were more likely to
237
cook meals. These mothers may be more aware of infant feeding guidelines and may have
238
more time to spend for meals preparation. These findings are consistent with previous results
239
that showed a negative relation between age, education and household size and
ready-240
prepared foods use in general population30-32, which may be explained by lack of time or
241
ability and/or willingness to ‘cook from scratch’16
. Local culture as well as food availability
242
and prices play a major role in determining where, how and what foods are eaten33. Type of
243
jobs and time spent in transportation, which are likely to differ between the regions of Poitiers
244
and Nancy may also explain the differences in feeding patterns. Nancy region is more
245
urbanized than Poitiers region (population density of their regions in 2009: 100 people/km
246
sq.34 vs. 68 people/km sq.35). We have to acknowledge that nowadays, ready-prepared foods
247
are widely used and ‘home-made’ meals sometimes include the help of various
ready-248
prepared products36. We were not able to evaluate this aspect in our study.
249
Longer breastfeeding duration has been positively associated with later CF introduction22-23,
250
higher maternal age and education level13,37-38, parity37,39. Early CF introduction has been
251
related to lower maternal age and education13,38,40, higher birthweight22,41 and infant
252
gender38,40,42. Our findings are consistent with those results. When considering the whole
253
feeding in the first year of life, infants’ characteristics were not related to the patterns except
254
for a tendency for earlier CF introduction in boys as already published38,40,42. Early return to
255
employment in the postpartum period has been negatively associated with breastfeeding
256
duration43-44; relations with CF introduction have less been examined. Evidences showed that
10 infants cared in non-parental care compared with parental care were shorter breastfed45-46 and
258
early introduced to CF45. In our study, maternal employment and childcare attendance were
259
not strongly associated with parental feeding practices suggesting that they are not major
260
factors explaining the variability in infant feeding.
261
In accordance with other studies18-19, we found a significant association between the feeding
262
patterns and maternal BMI. Previous analyses suggested that women who are
263
overweight/obese before pregnancy are more likely to discontinue breastfeeding earlier than
264
do normal-weight women47-50. In our results, mothers with high scores on pattern-2 were less
265
likely to be obese in contrast to mothers with high scores on pattern-3 who were more likely
266
to be obese. Paternal BMI, marker of a familial obesogenic environment besides maternal
267
BMI, was not related to the patterns.
268
Our study had some limitations. The EDEN population is not representative of the general
269
population. Compared to the national perinatal survey carried out on 14,482 women who
270
delivered in France in 200351, women included in EDEN study were slightly older, more
271
educated and more often employed. We were however able to show differences in infant
272
feeding practices according to maternal age, education, household income, and region even if
273
our sample was more homogenous than the general French population according to these
274
criteria. We did not found association regarding employment status although our sample did
275
not lack variability on this criterion (29% of the mothers never worked between 0-12 months).
276
Therefore, we believe that the relationships observed are of interest for the general population
277
of infants born in France from middle class parents.
278
Our questionnaire on infant feeding has not been validated as most questionnaires used to
279
assess food habits in infancy (ref JAND). Nevertheless, some questions were repetead in in
280
the 4, 8 and 12-mo questionnaires, which allow to correct for inconsistency in maternal report.
281
As we did not use a FFQ in our study, we were not able to go into details on qualitative
282
aspects of diet at different ages to reproduce published results. However, interesting patterns
283
emerged from our analyses and we believe that our approach provides complementary
284
information to existing publications on feeding practices in the first year of life. Data on
285
breastfeeding duration and age at CF introduction were missing at some ages between 0-12
286
months. However we were able to retrieve information by combining data from three
287
questionnaires. Imputations that were performed in infants with incomplete data probably lead
11 to a loss of information in terms of variability of maternal practices but represent a fairly good
289
approximation of early or late CF introduction/breastfeeding discontinuation according to the
290
current guidelines.
291
In summary, our study allowed the identification of well individualized feeding patterns in the
292
first year of life, which explain a large part of the variability in our samples. It highlighted that
293
not only maternal education level and age but also parity and region are important
294
contributors to the variability in patterns. Our results reflect constraints regarding cooking
295
skills, spendable time on meals preparation, cost and availability of fresh foods in different
296
regions, factors that could be analyzed in depth in future studies.
297
Acknowledgements: We thank the heads of the maternity units, the investigators and all the 298
women who participated in the surveys. We acknowledge all funding sources for the EDEN
299
study: Fondation pour la Recherche Médicale (FRM), French Ministry of Research:
300
Federative Research Institutes and Cohort Program, INSERM Human Nutrition National
301
Research Program, and Diabetes National Research Program (through a collaboration with the
302
French Association of Diabetic Patients (AFD)), French Ministry of Health, French Agency
303
for Environment Security (AFSSET), French National Institute for Population Health
304
Surveillance (InVS), Paris–Sud University, French National Institute for Health Education
305
(INPES), Nestlé, Mutuelle Générale de l’Education Nationale (MGEN), French speaking
306
association for the study of diabetes and metabolism (ALFEDIAM), National Agency for
307
Research (ANR non thematic program), National Institute for Research in Public health
308
(IRESP: TGIR cohorte santé 2008 program).
309
The research leading to these results has received funding from the European Community's Seventh 310
Framework Program (FP7/ 2007-2013) under the grant agreement n°FP7-245012-HabEat. 311
Aisha Betoko was supported by a research grant from the French Ministry for Higher
312
Education and Research.
313
Contributors: The EDEN Study group, coordinated by MAC and BH, was responsible for 314
study design and data collection. MAC and BLG were involved in all aspects from study
315
conception to manuscript writing. AB, AF and MB participated in data management for the
316
present analyses. AB analyzed and interpreted the data and wrote the initial draft of the
317
manuscript. BH, RH, MJSC and all the co-authors critically reviewed all sections of the text
12 for important intellectual content. MAC is the guarantor of the study. All authors had full
319
access to all of the data in the study and can take responsibility for the integrity of the data
320
and the accuracy of the data analysis.
321
Members of the EDEN Mother-Child Cohort Study Group: MA Charles, A Forhan, M de 322
Agostini, B Heude, P Ducimetière (Inserm, CESP U1018), M Kaminski, MJ
Saurel-323
Cubizolles, P Dargent, X Fritel, B Larroque, N Lelong, L Marchand, C Nabet (Inserm U953),
324
I Annesi-Maesano (Inserm U707), R Slama (Inserm U823), V Goua, G Magnin, R Hankard,
325
(Poitiers University Hospital), O Thiebaugeorges, M Schweitzer, B Foliguet (Nancy
326
University Hospital), N Job-Spira (ANRS).
327
Conflict of Interest Statement: None of the authors have any conflicts of interest. 328
References 329
1. Monteiro PO, Victora CG. Rapid growth in infancy and childhood and obesity in later life--a 330
systematic review. Obes Rev 2005; 6, 143-154. 331
2. Botton J, Heude B, Maccario J, Ducimetiere P, Charles MA. Postnatal weight and height 332
growth velocities at different ages between birth and 5 y and body composition in adolescent 333
boys and girls. Am J Clin Nutr 2008; 87, 1760-1768. 334
3. Druet C, Stettler N, Sharp S, et al. Prediction of childhood obesity by infancy weight gain: an 335
individual-level meta-analysis. Paediatr Perinat Epidemiol 2012; 26, 19-26. 336
4. Reilly JJ, Methven E, McDowell ZC, et al. Health consequences of obesity. Archives of Disease 337
in Childhood 2003; 88, 748-752. 338
5. Morrison JA, Glueck CJ, Wang P. Childhood risk factors predict cardiovascular disease, 339
impaired fasting glucose plus type 2 diabetes mellitus, and high blood pressure 26 years later 340
at a mean age of 38 years: the Princeton-lipid research clinics follow-up study. Metabolism 341
2012; 61, 531-541. 342
6. Coulthard H, Harris G, Emmett P. Long-term consequences of early fruit and vegetable 343
feeding practices in the United Kingdom. Public Health Nutr 2010; 13, 2044-2051. 344
7. Beauchamp GK, Mennella JA. Flavor perception in human infants: development and 345
functional significance. Digestion 2011; 83 Suppl 1, 1-6. 346
8. Lanfer A, Knof K, Barba G, et al. Taste preferences in association with dietary habits and 347
weight status in European children: results from the IDEFICS study. Int J Obes (Lond) 2012; 348
36, 27-34. 349
9. Boland M. Exclusive breastfeeding should continue to six months. Paediatr Child Health 350
2005; 10, 148. 351
10. Gartner LM, Morton J, Lawrence RA, et al. Breastfeeding and the use of human milk. 352
Pediatrics 2005; 115, 496-506. 353
11. Turck D. Allaitement maternel : les bénéfices pour la santé de l'enfant et de sa mère. 354
Archives de Pédiatrie 2005; 12, Supplement 3, S145-S165. 355
12. Agostoni C DT, Fewtrell M, Goulet O, Kolacek S, Koletzko B, Fleischer Michaelsen K, Moreno 356
L, Puntis J, Jacques Rigo, Shamir R, Szajewska H, Turck D, and van Goudoever J. 357
13
Complementary feeding : a commentary by the ESPGHAN Comitte on Nutrition. Journal of 358
Pediatric Gastroenterology and Nutrition 2008; 46, 99-110. 359
13. Dubois L, Girard M. Social inequalities in infant feeding during the first year of life. The 360
Longitudinal Study of Child Development in Quebec (LSCDQ 1998-2002). Public Health Nutr 361
2003; 6, 773-783. 362
14. Wijndaele K, Lakshman R, Landsbaugh JR, Ong KK, Ogilvie D. Determinants of Early Weaning 363
and Use of Unmodified Cow's Milk in Infants: A Systematic Review. Journal of the American 364
Dietetic Association 2009; 109, 2017-2028. 365
15. Schiess S GV, Scaglioni S, Luque V, Martin F, Stolarczyk A, Vecchi F, Koletzko B; European 366
Childhood Obesity Project. Introduction of complementary feeding in 5 European countries. J 367
Pediatr Gastroenterol Nutr. 2010; 50, 92-98. 368
16. Lang T, Caraher M. Is there a culinary skills transition? Data and debate from the UK about 369
changes in cooking culture. J HEIA 2001; 8, 2-14. 370
17. Jabs J, Devine CM. Time scarcity and food choices: an overview. Appetite 2006; 47, 196-204. 371
18. Robinson S, Marriott L, Poole J, et al. Dietary patterns in infancy: the importance of maternal 372
and family influences on feeding practice. Br J Nutr 2007; 98, 1029-1037. 373
19. Smithers LG, Brazionis L, Golley RK, et al. Associations between dietary patterns at 6 and 15 374
months of age and sociodemographic factors. Eur J Clin Nutr 2012. 375
20. North K, Emmett P. Multivariate analysis of diet among three-year-old children and 376
associations with socio-demographic characteristics. The Avon Longitudinal Study of 377
Pregnancy and Childhood (ALSPAC) Study Team. Eur J Clin Nutr 2000; 54, 73-80. 378
21. Northstone K, Emmett P. Multivariate analysis of diet in children at four and seven years of 379
age and associations with socio-demographic characteristics. Eur J Clin Nutr 2005; 59, 751-380
760. 381
22. Wright CM, Parkinson KN, Drewett RF. Why are babies weaned early? Data from a 382
prospective population based cohort study. Arch Dis Child 2004; 89, 813-816. 383
23. Scott JA BC, Graham KI, Oddy WH. Predictors of the early introduction of solid foods in 384
infants: results of a cohort study. BMC Pediatr 2009; 9, 60. 385
24. Van Rossum CMT, Büchner FL, Hoekstra J. Quantification of health effects of breastfeeding : 386
Review of the literature and model simulation. RIVM report 350040001/2005. Available at 387
http://www.rivm.nl/bibliotheek/rapporten/350040001.pdf. Accessed July 6, 2012. 2006. 388
25. Ziegler AG, Schmid S, Huber D, Hummel M, Bonifacio E. Early infant feeding and risk of 389
developing type 1 diabetes-associated autoantibodies. JAMA 2003; 290, 1721-1728. 390
26. Regnault N, Botton J, Forhan A, et al. Determinants of early ponderal and statural growth in 391
full-term infants in the EDEN mother-child cohort study. Am J Clin Nutr 2010; 92, 594-602. 392
27. Joliffe I, Morgan B. Principal component analysis and exploratory factor analysis. Statistical 393
Methods in Medical Research 1992; 1, 69-95. 394
28. Michels KB, Schulze MB. Can dietary patterns help us detect diet-disease associations? Nutr 395
Res Rev 2005; 18, 241-248. 396
29. Joliffe IT, Morgan BJ. Principal component analysis and exploratory factor analysis. Stat 397
Methods Med Res 1992; 1, 69-95. 398
30. Brunner TA, van der Horst K, Siegrist M. Convenience food products. Drivers for 399
consumption. Appetite 2010; 55, 498-506. 400
31. Buckley M, Cowan C, McCarthy M. The convenience food market in Great Britain: 401
Convenience food lifestyle (CFL) segments. Appetite 2007; 49, 600-617. 402
32. Olsen NV, Menichelli E, Sørheim O, Næs T. Likelihood of buying healthy convenience food: An 403
at-home testing procedure for ready-to-heat meals. Food Quality and Preference 2012; 24, 404
171-178. 405
33. Mela DJ. Food choice and intake: the human factor. Proc Nutr Soc 1999; 58, 513-521. 406
14 34. French National Institute of Statistics and Economic Studies (Insee). The Lorraine region : 407
Population structure and evolution (Document in French). 408
http://www.recensement.insee.fr/exportPDF.action?codeZone=41-REG&idTheme=3. 409
Accessed Septembre 25th, 2012. 410
35. French National Institute of Statistics and Economic Studies (Insee). The Poitou-Charentes 411
region : Population structure and evolution (Document in French). 412
http://www.recensement.insee.fr/exportPDF.action?codeZone=54-REG&idTheme=3. 413
Accessed Septembre 25th, 2012. 414
36. Carrigan M, Szmigin I, Leek S. Managing routine food choices in UK families: the role of 415
convenience consumption. Appetite 2006; 47, 372-383. 416
37. Thulier D, Mercer J. Variables associated with breastfeeding duration. J Obstet Gynecol 417
Neonatal Nurs 2009; 38, 259-268. 418
38. Kristiansen AL, Lande B, Overby NC, Andersen LF. Factors associated with exclusive breast-419
feeding and breast-feeding in Norway. Public Health Nutr 2010; 1-10. 420
39. Bolling K, Grant C, Hamlyn B, Thornton A. Infant Feeding Survey 2005. The Information Centre 421
Part of the Government Statistical Service, London 2007; Available at 422
http://www.ic.nhs.uk/statistics-and-data-collections/health-and-lifestyles-related-423
surveys/infant-feeding-survey/infant-feeding-survey-2005. Accessed on November 16, 424
2010. 425
40. Erkkola M, Salmenhaara M, Nwaru BI, et al. Sociodemographic determinants of early 426
weaning: a Finnish birth cohort study in infants with human leucocyte antigen-conferred 427
susceptibility to type 1 diabetes. Public Health Nutr 2012; 1-9. 428
41. Schack-Nielsen L, Sørensen TI, Mortensen EL, Michaelsen KF. Late introduction of 429
complementary feeding, rather than duration of breastfeeding, may protect against adult 430
overweight. The American Journal of Clinical Nutrition 2010; 91, 619-627. 431
42. Alder EM, Williams FLR, Anderson AS, Forsyth S, Florey C, van der Velde P. What influences 432
the timing of the introduction of solid food to infants? British Journal of Nutrition 2004; 92, 433
527-531. 434
43. Gielen AC, Faden RR, O'Campo P, Brown CH, Paige DM. Maternal employment during the 435
early postpartum period: effects on initiation and continuation of breast-feeding. Pediatrics 436
1991; 87, 298-305. 437
44. Visness CM, Kennedy KI. Maternal employment and breast-feeding: findings from the 1988 438
National Maternal and Infant Health Survey. Am J Public Health 1997; 87, 945-950. 439
45. Kim J, Peterson KE. Association of infant child care with infant feeding practices and weight 440
gain among US infants. Arch Pediatr Adolesc Med 2008; 162, 627-633. 441
46. Benjamin SE, Rifas-Shiman SL, Taveras EM, et al. Early child care and adiposity at ages 1 and 3 442
years. Pediatrics 2009; 124, 555-562. 443
47. Hilson JA, Rasmussen KM, Kjolhede CL. Maternal obesity and breast-feeding success in a rural 444
population of white women. Am J Clin Nutr 1997; 66, 1371-1378. 445
48. Baker JL, Michaelsen KF, Sorensen TI, Rasmussen KM. High prepregnant body mass index is 446
associated with early termination of full and any breastfeeding in Danish women. Am J Clin 447
Nutr 2007; 86, 404-411. 448
49. Amir LH, Donath S. A systematic review of maternal obesity and breastfeeding intention, 449
initiation and duration. BMC Pregnancy Childbirth 2007; 7, 9. 450
50. Mok E, Multon C, Piguel L, et al. Decreased full breastfeeding, altered practices, perceptions, 451
and infant weight change of prepregnant obese women: a need for extra support. Pediatrics 452
2008; 121, e1319-1324. 453
51. Blondel B, Supernant K, Du Mazaubrun C, Breart G. Trends in perinatal health in metropolitan 454
France between 1995 and 2003: results from the National Perinatal Surveys. J Gynecol Obstet 455
Biol Reprod (Paris) 2006; 35, 373-387. 456
15
457
458
16
460
Table 1: Characteristics of parents and offspring (n=1,004).
Variable Total
Mean ± SD or % yes
Parental characteristics
Education (% university degree) 984 60.4 %
Monthly family income < 3,000 € 999 69.0 %
Primiparous 1,002 47.0 %
The mother never worked in 0-12 months 1,004 29.1 % Maternal age at child's birth (yrs) 1,004 29.9 ± 4.7 Maternal pre-pregnancy BMI < 25 kg/m² 987 75.1 %
Paternal BMI < 25 kg/m² 931 47.9 %
Child characteristics
Female sex 1,004 48.9 %
Gestational age (weeks of amenorrhea) 1,004 39.2 ±1.7
Birthweight (kg) 1,004 3.3 ± 0.5
Never attended to childcare in the first year of life 753 11.2
Other variables
Recruitment center (% Poitiers) 1,004 43.6 %
17
Table 2: Description of infant feeding variables within quartiles (Q) of pattern scores and PCA coefficients, n=1004.
Pattern 1 Pattern 2 Pattern 3
Q1 Q4 Coefficients Q1 Q4 Coefficients Q1 Q4 Coefficients
Breastfeeding duration in the first year (months)*
Any breastfeeding duration 2.58 4.55 0.20 1.58 6.13 0.48 2.99 3.76 0.08
Full breastfeeding duration 1.50 2.67 0.17 0.75 4.02 0.47 1.55 2.40 0.11
Ages of food introduction in the first year (months)*
Meat 6.20 7.47 0.33 6.09 7.90 0.51 6.47 7.31 0.20 Fish 6.95 9.01 0.39 6.82 9.37 0.47 7.66 8.41 0.11 Vegetables 4.34 5.92 0.40 4.20 6.04 0.50 4.81 5.66 0.21 Fruit 4.46 6.08 0.36 4.37 6.17 0.43 4.86 5.92 0.23 Potatoes 5.25 7.00 0.41 5.45 6.86 0.34 5.62 6.75 0.26 Cereals 5.70 8.06 0.35 5.79 8.12 0.38 6.73 6.94 0.02 Dairy products 5.42 7.33 0.47 5.60 7.40 0.47 6.01 6.79 0.16 Cheeses 7.99 8.90 0.41 8.48 8.79 0.12 8.45 8.69 0.07 Dairy desserts 6.94 8.68 0.49 7.41 8.30 0.26 8.06 7.74 -0.12 Biscuits 7.00 8.39 0.35 6.89 8.63 0.42 7.49 8.10 0.12 Eggs 11.5 12.4 0.29 11.8 12.1 0.09 11.8 12.0 0.01 Egg yolks 9.83 11.6 0.39 10.9 10.8 -0.02 10.2 11.1 0.18 Fruit juices 6.38 8.44 0.40 6.65 8.42 0.35 7.12 7.89 0.14 Cow's milk 10.0 12.7 0.49 11.6 12.0 0.07 12.1 11.2 -0.18
Use of Ready-prepared baby foods at 12 mo**
Dairy products 39.4 73.9 0.25 79.5 39.0 -0.34 84.9 31.5 -0.42
Soups 21.3 44.3 0.23 62.3 6.8 -0.52 28.3 27.0 0.01
Vegetables puree 24.9 81.8 0.53 83.1 17.9 -0.56 34.3 60.9 0.20
Fruit puree 42.6 93.3 0.47 84.7 45.8 -0.38 75.7 54.8 -0.23
18
Biscuits 24.9 36.8 0.15 41.8 20.7 -0.18 42.2 18.9 -0.26
Cereals 53.0 37.1 -0.12 58.6 33.1 -0.27 58.6 42.3 -0.13
Main meals (including meat, fish and vegetables) 33.3 84.6 0.46 91.2 17.5 -0.65 37.9 67.3 0.25
Use of ready-prepared adults' foods at 12 mo**
Dairy products 72.3 26.7 -0.41 36.9 56.2 0.11 25.5 79.8 0.48 Soups 18.5 6.7 -0.37 9.2 6.8 -0.06 1.6 21.0 0.40 Vegetables puree 34.1 17.0 -0.48 10.4 17.5 0.09 7.6 25.8 0.25 Fruit puree 44.2 5.1 -0.49 16.5 20.7 0.00 4.8 45.6 0.50 Fruit juices 17.7 0.0 -0.44 7.6 7.6 -0.09 2.0 12.9 0.31 Biscuits 51.4 4.7 -0.48 27.3 20.3 -0.11 8.0 46.0 0.41 Cereals 12.9 1.2 -0.32 5.2 2.8 -0.04 2.4 10.1 0.19
Processed meat and fish 31.7 3.2 -0.45 10.8 15.9 0.06 9.6 18.6 0.11
Use of home-made foods at 12 mo**
Dairy products 18.1 1.2 -0.45 4.0 13.9 0.08 11.2 4.0 -0.04 Soups 60.6 11.5 -0.44 10.0 68.5 0.46 61.8 24.2 -0.32 Vegetables puree 68.7 22.1 -0.43 12.5 89.6 0.62 74.9 33.1 -0.39 Fruit puree 25.3 10.3 -0.24 4.8 52.2 0.52 33.5 10.1 -0.28 Fruit juices 8.0 0.8 -0.22 0.4 6.4 0.15 6.8 2.8 -0.15 Biscuits 12.6 17.4 -0.40 1.6 8.0 0.14 6.0 6.5 0.02
Fresh meat and fish 69.5 13.4 -0.48 8.4 76.5 0.52 70.9 27.8 -0.39
* Values in Q1 and Q4 are means. ** Values in Q1 and Q4 are proportion of subjects using the considered type of food regularly or always.
Patterns coefficients ≥ |0.3| are shown in bold. Pattern 1: 'Late complementary food introduction and use of baby foods’, Pattern 2: 'Longer breastfeeding, late complementary food introduction and
use of home-made foods’, Pattern 3: 'Use of adult’s foods'. French recommendations on introduction of various CF groups are available in the infant’s personal health record and are the following:
fruit, vegetables, potatoes, cereals, meat and fish should be introduced to the infant between 5 and 7 month; dairy products and cheeses between 6 and 7 months; eggs from 7 months.
19
Table 3: Multivariate associations between infant feeding patterns and family characteristics in EDEN cohort study, n=1004.
Feeding patterns
n
Late CF* introduction and use of baby foods
Longer breastfeeding, late CF* introduction and use
of home-made foods
Use of adults' foods
β 95% CI** β 95% CI β 95% CI
Recruitment center
Nancy 566 Referent Referent Referent
Poitiers 438 -0.25 -0.38, -0.13 0.16 0.03, 0.29 -0.20 -0.33,-0.07
Parental characteristics
Mother's age at child's birth(y) 1004 0.02 0.00, 0.03 0.03 0.01, 0.04 -0.03 -0.04,-0.01
Maternal Education
No diploma 240 -0.32 -0.51, -0.14 -0.61 -0.80, -0.41 0.11 -0.08, 0.30
High school diploma 170 -0.22 -0.41, -0.03 -0.36 -0.56, -0.17 -0.03 -0.23, 0.17
2-year university degree 225 -0.11 -0.26, 0.05 -0.28 -0.45, -0.12 -0.07 -0.24, 0.09
≥ 3-year university degree 369 Referent Referent Referent
Monthly family income (euros)
<1501 113 -0.50 -0.76, -0.25 -0.03 -0.29, 0.23 0.19 -0.08, 0.45
1501-2300 300 -0.22 -0.40, -0.04 -0.09 -0.27, 0.09 0.06 -0.12, 0.25
2301-3000 281 -0.11 -0.27, 0.05 -0.04 -0.20, 0.13 0.15 -0.02, 0.32
>3000 310 Referent Referent Referent
Maternal employment status in the first year
Worked from 0-4m 397 Referent Referent Referent
Worked from 4-8m 243 0.06 -0.13, 0.26 0.07 -0.13, 0.26 0.03 -0.17, 0.22
Worked from 8-12m 72 -0.07 -0.37, 0.23 0.04 -0.27, 0.34 0.24 -0.07, 0.55
Never in the 1st year 292 -0.15 -0.44, 0.13 -0.00 -0.29, 0.29 0.28 -0.02, 0.58
Parity
1 473 Referent Referent Referent
2 359 -0.15 -0.29, -0.02 -0.01 -0.15, 0.13 0.30 0.15, 0.44
20
Maternal BMI
Thin 84 0.12 -0.10, 0.34 0.03 -0.19, 0.26 -0.03 -0.28, 0.22
Normal 674 Referent Referent Referent
Overweight 169 -0.19 -0.35, -0.03 -0.13 -0.29, 0.04 0.06 -0.07, 0.20
Obese 77 0.00 -0.23, 0.23 -0.24 -0.47, -0.00 0.17 -0.07, 0.41
Paternal BMI
Missing 73 -0.06 -0.30, 0.18 -0.15 -0.40, 0.09 -0.03 -0.28, 0.22
Normal 481 Referent Referent Referent
Overweight 370 -0.08 -0.21, 0.05 0.04 -0.09, 0.17 0.06 -0.07, 0.20
Obese 80 0.03 -0.20, 0.26 0.08 -0.16, 0.32 0.17 -0.07, 0.41
Infant characteristics
Birthweight (kg) 1004 0.00 -0.15, 0.15 0.11 -0.04, 0.26 0.04 -0.12, 0.19
Gestational age (weeks of amenorrhea) 1004 -0.01 -0.05, 0.04 0.02 -0.03, 0.07 0.01 -0.03, 0.06 Gender
Male 513 -0.12 -0.24, -0.00 -0.02 -0.14, 0.10 -0.04 -0.16, 0.09
Female 491 Referent Referent Referent
Infant’s age at first attendance to childcare
Missing 251 0.08 -0.21, 0.38 0.29 -0.01, 0.59 -0.21 -0.52, 0.09
0-4m 364 Referent Referent Referent
4-8m 208 0.11 -0.09, 0.31 0.12 -0.09, 0.32 -0.09 -0.30, 0.12
8-12m 69 0.06 -0.25, 0.37 0.25 -0.06, 0.57 -0.22 -0.54, 0.10
Never in the 1st year 112 -0.00 -0.23, 0.22 0.11 -0.12, 0.34 -0.01 -0.25, 0.22 * CF : complementary food, ** CI : Confidence interval
463
464