HAL Id: ird-01230541
https://hal.ird.fr/ird-01230541
Submitted on 18 Nov 2015
HAL is a multi-disciplinary open access
archive for the deposit and dissemination of
sci-entific research documents, whether they are
pub-lished or not. The documents may come from
teaching and research institutions in France or
abroad, or from public or private research centers.
L’archive ouverte pluridisciplinaire HAL, est
destinée au dépôt et à la diffusion de documents
scientifiques de niveau recherche, publiés ou non,
émanant des établissements d’enseignement et de
recherche français ou étrangers, des laboratoires
publics ou privés.
Rainfall characteristics (delta18O, delta2H, DeltaT and
DeltaHr) in Western Africa : regional scale and influence
of irrigated areas
Jean-Denis Taupin, A. Coudrain-Ribstein, Robert Gallaire, G.M. Zuppi, A.
Filly
To cite this version:
Jean-Denis Taupin, A. Coudrain-Ribstein, Robert Gallaire, G.M. Zuppi, A. Filly. Rainfall
charac-teristics (delta18O, delta2H, DeltaT and DeltaHr) in Western Africa : regional scale and influence of
irrigated areas. Journal of Geophysical Research. Oceans, Wiley-Blackwell, 2000, 105 (D9),
pp.11,911-11,924. �ird-01230541�
JOURNAL OF GEOPHYSICAL RESEARCH, VOL. 105, NO. D9, PAGES 11,911-11,924, MAY 16, 2000
Rainfall
characteristics 5:H, AT and
•[/r) in western
Africa:
Regional scale and influence of irrigated areas
Jean-Denis
Taupin, Anne
Coudrain-Ribstein,
3 Robert
Gallaire,
4 Gian Maria
Zuppi,
and Annick Filly 6
Abstract. A sumn•ary
of previous
isotopic
studies
of rainfall in western
Africa (0 ø- 17øN;
0 ø- 15øE)
together
with
the
isotopic
analyses
of rainfall
events
from 15 stations
in 1989
shows
that
(I) the
Gulf
of Guinea is the main source
of water vapor in the Sudan-Sahelian
zone (minimum of monthly
mean of
8180 contemporaneous
with
the
heart
of the
mort.
soon),
(2) the
reevaporated
water
from
previous
local
rainfalls is an important
source
of water vapor 6f subsequent
rainfalls (lack of-continental
effect, where
the majority
of rain
events
present
isotopic
signature
either
evaporated
or'
fed by evaporated
water),
and (3) no isotopic
data support
the Indian Ocean as a source
of vapor. Isotopic ratios combined
with
variations
of temperature
and relative humidity associated
with rain events in 1989 mirror the
increasing
aridity from south to north and from west to east. Flowever, a Sahelian
station,
Birni
N'Konni, presents
all the features
of a humid station with a large contribution
of continental
vapor
(60% of rain events with d>i0•c, -2 K<AT<2 K and AHr<10%). This observation
can be attributed
to
continental
vapor originating
from irrigated fields 100 km upstream
of the dominant
monsoon
currents,
in the Sokoto valley of Nigeria. This is corroborated
by the difference
in the evolution
of
rainfall amounts
and relative
humidity
at Niamey and Birni N'Konni since 1951, signaling
an
important
effect of !and use changes
on regional
climate conditions.
I. Introduction
As reported by l,e B•trbd and Lebel [1997, p. 44] it might be said "that, during the 80s, opinions of the nature and the statistical significance of the Sahelian drought have fluctuated almost as much as the rainfall conditions themselves. As underlined by ,htnicot c, ld t'ontaine [1993], this may be partly attributed to tl•e variety of mechanisms involved" In this context. it is interesting to examine •,,hat ca• be learned from isotopic signatures of rains, even if these results are initially Clualitative, as argued by Go•tg and l'ihcd•ir[19961. For example, continental vapor can contribute to meteoric precipitation through recycling by evapotranspiration, and this contribution can be identified by isotope analyses,
particularly
of the
deuterium
excess
expressed
as d = 82H
- 88180
[l)ansg, aard, 1964; •h!/oztbe, 1971 ]. This parameter d has been extei•sivel.,, used [e.g., ,llerlivat and 3ottzel, 1979; Rindsberger el al., 1990: Gat. 1996: ,trmen,q'at•d et al., 19981 in the characterization of hydrological systems (evaporatio• from falling rain droplets and contributio• of evaporated moisture to rainfitll)
•Laboratoire
ti'Etudes
des
Translefts
en Hydrologie
et Environnement,
lnstitut de Recherche pour le Ddveloppement, Grenoble, France.
2Now at UMR Sisyphe, IRD-Universit6 Pierre et Marie Curie, Paris, France.
•UMR Sisyphe, CNRS-Universit6 Pierre et Marie Curie, Paris, France.
4IRD, CP 9214, La Pax, Bolivia.
•Dipartimento di Scienze Ambientall, Universita Ca Foscari di Venezia
Venice, Italy.
6Laboratoire d'Hydrologie et de Gdochimie lsotopique, URA 723,
CNRS, Universitd Paris XI, Orsay, France.
Copyright 2000 by the American Geophysical Union.
Paper number 1999JD901032.
0148-0227/00/1999JD901032509.00
md also well as an indicator of paleoclimatological Col•ditions in
proxy materials such as ice cores.
According
to the review by Rozanski
et al. [1993], isotopic
analyses
of continental
precipitation
((5180
and
(52H)
have
been
performed in Europe and North America for- 40 years. By meansof these
analyses
the origin of air masses
and the processes
that
lead to precipitation can be characterized. Isotope data from the African continent are scarce, especially for the northern andwestern
part of Africa (Figure 1). During the EPSAT-Niger
program
[Lebe!
et al., 1996], rain events
were sampled
in Niger
and Benin (Figure 2). The oxygen-18 and deuterium were analyzed in addition to the measurements of two air parameters,the temperature
variation and the relative humidity variation
associated with a rain event. The purpose of the present study is to obtain better answers concerning the sources of water vapor and
the feedback between climate and surface water from these rainfall
event measurements over a region of 1500 km x 1500 km on the African continent.
•mato•og•ca• Features
•e climate of western Africa is characterized by the
succession of two seasons whose extreme conditions are
summarized as follows after f:ontaine [1991] and Le Barbd et al.
119931:
1. During the boreal winter the subtropical anticyclone near the Azores favors a northerly wind component at the surface. Dry
air masses (Harmatari) circulate toward the south, and the
intertropical confluence zone (tTCZ) of wind cells fi'om both hemispheres is situated close to the geographical equator.
2. During the boreal summer the North Atlantic subtropical anticyclone moves northward, and a low-pressure system develops over the Sahara because of the intense surface win'ming. %e
circulation of humid air masses is directed from the South Atlantic 11,911
11,912 TAUPIN ET AL.: RAINFALL ISOTOPICAI. DATA IN WESTERN AFRICA
2O
16
12
altitude
> 1000
m
I
surface
waters
ß . '" ß Bol .:; .,,....,....,'-.,
3
':õ'
...
'"
...
"'
i•'"
/ "/
ß
'.-....
i•
1
Kano N' D•_.a"r;ne n a ,,' ,: ,"
Longkat
- 5:4
-3.7' "..-,5.1...."
•)eli
'.,. Mt Car•erou n -2 ..: Gulf de Guinea -2 0 2 4 6 8 10 12 14 16Longitude
Figure I. Location of stations where isotopic rainfall data were published in the region. Horizontal axis shows
longitude
in degrees.
Vertical
axis
shows
latitude
in degrees
north.
Numbers
are
the
weighted
mean
values
of 8180
in per mil at observation stations. For Longkat and Mount Cameroon each value corresponds to a different station
at a different altitude (Table 1).
subtropical anticycione toward the North, and the ITCZ extends up to - 13øN. The limit of the ITCZ in the lower layers is the intertropical front (ITF, 3 km high). The different thermal
behaviors of ocean and continent induce a circulation fi'om east to
west (Tropical Easterly Jet at - 100 mbars and north-east African
Jet at - 500 mbars).
The main features of the spatial e. volution of rains according to
Charre [19741 are as follows:
1. In the southe,'•; r,.gion (lower than 10øN) the rainy season has two maxima (spring and fall) corresponding to the period when the II'CZ crosses the region. Air masses from the subtropical anticyclone become laden with moisture when crossing the South Atlantic Ocean. These monsoon rains originate in a 200-kin-wide bane. on both sides of the ITCZ where strong
ascending
occurs.
The
annual
amount
is - 1200
mm
yr
-1.
2. In the northern region occupied by the ITF, currents from
the eastern block cause the ascendance of humid air masses.
Precipitation can occur if perturbations such as squall lines allow this structure to change. There is only one maximum in August,
and
the rainfall
amount
decreases
to 130
mm yr
-1 in Agadez.
At
the Sahelian latitude (13øN) the annual amount decreases from west (Niamey) to east (N'guigmi).
Evapotranspiration is an important source of water vapor in these regions as documented by micrometeorological data
[Monteny and Casenave, 1989] and by the use of a mass balance model based on temperature, relative humidity, wind, and latent heat flux data [Gong and Eltahir, 1996]. However, the distribution of this flux between evaporation and transpiration is still poorly documented.
The Indian Ocean as a possible source of vapor at the latitude of the Sahel is still being debated [Charre, 1974; De Felice et al.,
1982; Dhonneur, 1985; Fontaine, 1991; Joseph and Aranyossy,
1989]. The challenge for future work is to understand the origin of the climatic variations such as, for example, the last 20-year drought over the region that is well characterized as to the rainfall data [e.g., Le Barbd and Lebel, 1997; Paturel et al., 1997]. One
way of addressing this question is to incorporate the isotopic cycles into a general circulation model (GCM) of the atmosphere [douzel et al., 1987]. Considering the great heterogeneity of isotopic data regarding the continent, acquisition and publication
of new data are of special importance.
3. Previous Isotopic Studies of Rainfall in Western
Africa
The results obtained in previous isotopic studies of the African region in question (0ø-15øE, 0ø-17øN) are summarized below and in Table I and Figure 1. The source of vapor from the Gulf of
'FAUPIN ET AL.: RAINFALL ISOTOPICAL DATA IN WESTERN AFRICA 11,913
[•1 altitude
> 1000
m I
surface
waters
20 ..'
18
!
ß
r"-]-o
.3 ß
1
] ...
."
• '•
•
T•dqoua
- 2 6' 5
- 4 :"•
;- 1
11.
4 -}'"
....
'...
•
• .... - 3.9•;
8 ,• •, •'
•i[•[N,
guigmi
... , ... • •, L•oure [-71 ....-"
ß
•
.,.
• ..SLaLion •18 O. d
•
Gulf de Guinea
• 30% rain
evt. •18 O>0
• 30% rain evt. d •10
----• I ' I ' I ' I' ' ' ... [ I • I ' I ' ....
-2 0 2 4 6 8 10 12 14 16
Longitude
Figure 2. Location of stations sampled during the 1989 rainy season (EPSAT program). Numbers are the weighted
mean
values
in per
rail of 8180 and
deuterium
excess
for this
period.
Shaded
squares
are
stations
where
more
than
30% of rainfall
events
have
8180>0%o
(numerous
rainfall
events
affected
by evaporation).
Hatched
circles
are
stations where more than 30% of rainfall events have a deuteriun• excess of more than 10%c (contribution of vapor
originating fi'om evaporation over the continent).
Guinea is clearly the main source of water vapor according to climatic evidence. From the isotopical point of view, as moisture is gradually removed fi'om air masses moving inland and condensation processes preferentially remove heavy isotopes more
negative
8180 should
be observed
with increasing
distance
fi'om
the coast. This feature known as the "continental effect" is observed over Europe and the Amazon basin [Rozanski eta/.,
YYD]. UVUI WUbtUlll hillgit tllU L<IJLI<IJLiy i8, Oil tlJ< COlltlitly, iiot at all clear at the regional scale (Figure 1) nor at the larger scale, along the trajectory of the Atlantic monsoon flow from Kano
(12.03øN, 8.32øE) toward Khartoum (15.36øN, 32.33øE). An
apparent
increase
of 8180 with
increasing
distance
from
the
coast
is even observed from -3.8%0 at Kano to -2.1%o at Khartoum[R,,zanski et al., 1993]. Locally, over the AYr massif (fi'om 17øN to
20øN)
an increase
in 8180 is due
to the increasing
aridity
to',:ard
the north [Gal/aire et al., 1995].
Disregarding the continental effect, what other isotopic arguments are in favor of an Atlantic source of water vapor in the rains between 0 ø and 17øN and 0 ø and 15øE? One argun, ent is the
V shape
of the evolution
over
a year
of the monthly
mean
8180
values. This type of graph is reported for stations located between 12øN and ITøN, Kano and N'djamena [International d[omic
Energy Ageno: (IAEA), 1992], Barogo [Mathieu et al., 19931, and Niamey [1'aupin eta/., 1997]. Ranging between +4 and -8%r. the
•180 values
present
their
minimum
values
in August,
which
has
the highest rainfall amount associated with the most noaherly position of the ITCZ. Another argument is presented by Mathieu et al. [1993] for Barogo and by Taupin et al. [1997] for Niamey.
%e regional
isotopic
meteoric
lines
of these
stations
fitted
on 82H
ve•'sua o'• uata texc•uu•g rain events affected by evaporation) have almost the same equation for all stations, which argues for considerable amount of water vapor from a common source, the Gulf of Guinea. For the AYr fo•ation the same point of view is defended by Gal/aire et al. [1995]. In that case, evaporation
affects
all the rainfalls,
and the argument
is that the 8180
coordinate of the intersection between the fitted line on all datapoints and the World Meteoric Line is close to -5%0, which might
indicate an oceanic source at the latitude of the Gulf of Guinea
[Rozanski et al., 1993].
%e continental source of water vapor is propounded in several isotopic studies. On the basis of the data from the IAEaWorld Meteorological Organization (WMO) network [MEA, 1992], the apparent increase, quoted above, of the weighted mean value of
11,914 TAUPIN ET AL.: RAINFALL ISOTOPICAL DATA IN WESTERN AFRICA
Table
1. Available
Weighted
Mean
Values
of $180
in Western
Africa
(0ø-17øN,
0ø-15øE)
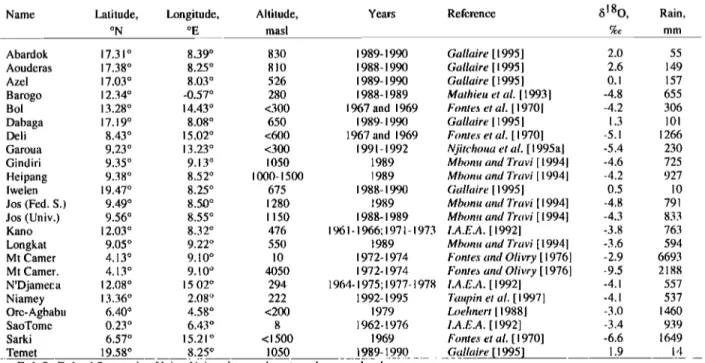
Name Latitude, Longitude, Altitude, Years Reference øN øE masl
b180,
Rain, mm Abardok 17.31 o 8.39 ø 830 1989-1990 Gallaire [ 1995] Aouderas 17.38 ø 8.25 ø 810 1988-1990 Gallaire [ 1995] Azel 17.03 ø 8.03 ø 526 1989-1990 Gallaire [ 1995]Barogo 12.34 ø -0.57 ø 280 1988-1989 Mathieu et al. [ 1993]
Bol 13.28 ø 14.43 ø <300 1967 and 1969 Fontes et al. [1970]
Dabaga 17.19 ø 8.08 ø 650 1989-1990 Gallaire [ 1995]
Dell 8.43 ø 15.02 ø <600 1967 and 1969 Fontes et al. [1970]
Garoua 9.23 ø 13.23 ø <300 1991-1992 Njitchoua et al. [ 1995a1
Gindiri 9.35 ø 9.13 ø 1050 1989 Mbonu and Travi [ 1994]
Heipang 9.38 ø 8.52 ø 1000-1500 1989 Mbonu and Travi [ 19941
Iwelen 19.47 ø 8.25 ø 675 1988-1990 Gallaire [ 1995]
Jos (Fed. S.) 9.49 ø 8.513 ø 1280 1989 Mbonu and Travi [I 994]
Jos (Univ.) 9.56 ø 8.55 ø I 150 1988-1989 Mbonlt and Travi [ 1994]
Kano 12.03 ø 8.32 ø 476 1961-1966;1971-1973 I.A.E.A. [ 1992]
Longkat 9.05 ø 9.22 ø 550 1989 Mbonu and 7)'avi [ 1994]
Mt Camer. 4.13 ø 9.10 ø 10 1972-1974 Fontes and Olivry [1976l
Mt Camer. 4.13 ø 9.10 ø 4050 1972-1974 Fonte•s and Olivry [1976]
N'Djamena 12.08 ø 15.02 ø 294 1964-1975;1977-1978 I.A.E.A. [1992]
Niamey 13.36 ø 2.08 ø 222 1992-1995 Taltpin et al. [ 1997]
Ore-Agbabu 6.40 ø 4.58 ø <200 1979 Loehnert [ 1988]
SaoTome 0.23 ø 6.43 ø 8 1962-1976 I.A.E.A. [ 1992] Sarki 6.57 ø 15.21 ø < 1500 1969 Fontes et al. [ 1970] Temet 19.58 ø 8.25 ø 1050 1989-1990 Gallaire [1995] 2.0 2.6 0.1 -4.8 -4.2 1.3 -5.1 -5.4 -4.6 -4.2 0.5 -4.8 -4.3 -3.8 -3.6 -2.9 -9.5 -4.1 -4.1 -3.0 -3.4 -6.6 1.9
Fed. S., Federal Secretariat; Univ., University; masl, meters above sea level.
55 149 157 655 306 101 1266 230 725 927 10 791 833 763 594 6693 2188 557 537 1460 939 1649
by a continental vapor source [Rozanski et al., 1993]. Mathieu et al. [1993] in the case of Barogo and Taupin and Gallaire [19981 for Sahelian stations point to the fact that deuterium excess (d) values overpass 10%• to prove that the continental source is important for the rains at the edges of the rainy season. Values of d as high as 16.5%• are also reported in May and June 1989 near Jos in Nigeria [Mbonu and Travi, 1994].
Under arid conditions the raindrops evaporate while falling toward the soil surface. This increases the high isotope contents so that points corresponding to evaporated rain are under the Global
World
Meteoric
Line (GWML)
in a $2H versus
$180 graph,
the
deuterium excess is lower than 10%,,. Such features are reported for Niamey [Taupin et al., 1997] and for Barogo [Mathieu et al.,
1993] at the edges of the rainy season and for all the rains of the
AYr stations [Gallaire, 1995].
The altitude effect is well illustrated by the case of Mount
Cameroon close to the ocean. The $180 values show an almost perfect gradient with respect to altitude [Fontes and Olivry, 1976]
with a decrease
of 0.15%o
of $18
0 per 100 m. This value
is
relatively small and could be explained after Gonfiantini [1998] by a liquid/vapor ratio increasing linearly with the altitude. At the Jos plateau a small value is also reported [Mbonu and Travi,
1994]. Farther inland, in the AYr formation, the increasing aridity
obliterates the altitude effect [Gallaire et al., 1995].
The "amount effect" corresponds to an inverse relationship
between
the amount
of monthly
precipitation
and its $180
composition [Dansgaard, 1964]. On tropical islands, covered by
the IAEA/WMO network, a clear decrease is observed fi*om values
of 1%, for small monthly amounts down to -6%• for a monthly amount of • 350 mm [Rozanski et al., 1993]. Rozanski et al. [1993] relate this phenomenon to the higher vertical velocity of
ascending air masses during storms and to the smaller effects of
exchanges between air and raindrops when the amount is higher.
For the region under study, monthly data at Barago [4athieu et
al., 1993] and Niamey [Taupin et al., •997] show a '•',qther clear inverse relation where the first and last months of the •; ,ny seasor•
show enriched isotopic ratios (>-4%0). However, the rmnfall event data, when available, include some light rains with very negative
$180
values
and
some
heavy
rains
with
high
$180
values.
This
is
the case for the Niamey region [I•tupin and Gallaire, 1998; Taupin et al., 1997], Barogo [Mathieu et al., 1993], Garoua [Njitchoua et al., 1995bl, and the AYr stations [Gal/a'.-.,, 1995]. Small depleted rains might be explained by air mas•,e • .scending to very high/cold altitudes as co•robora!•e,• by infrare½ Meteosat and radar data [I•upin and Galloire, 199d]. iteav•, r•i:;falls that are isotopically enriched mighl be related to a large continental
source.
4. The Data Collected in 1989
The data were collected during the rainy season of 1989 as part of the EPSAT-Niger experiment designed to study the structure of Sahelian rain fields [Lebel et al., 1996]. They were collected from meteorological stations chosen along a SSW-NNE line (Figure 2), from Cotonou (6ø21'N) to Agadez (17øN), and an E-W line from N'guigmi (13ø23'E) to Niamey (2ø08'E). The first transect corresponds to the Guinean monsoon trajectory. The second corresponds to the movement of the convective systems that originate in central Africa and the Sahel.
Rainwater was collected from 15 meteorological stations (Figure 2 and Table 2). According to the statistical study by Le Barb• and Lebe! [1997], the rain amounts over the Niger in 1989 were close to the mean values during the dry period of 1968-1990. For each station, isotope analyses were then made for a number of rain events whose total amount corresponds to 90% of the total rainfall over the period under consideration. The lower limit of analyzed rain events was 8 mm for the Sudanese region, 5 mm for the Sahel, and I mm for the subdesert region. There were 347 samples analyzed in oxygen-18 and deuterium. For hydrogen assay the water was first decomposed at 450øC using zinc metal to generate hydrogen gas. For oxygen isotope assay a gas preparation technique was used which relied on isotopic exchange of the
TAUPIN ET AL • RAINFALL ISOTOPICAL DATA IN WESTERN AFRICA 11,915
Table 2. Coordinates and Mean Values of the Parameters for the 15 Stations
Station
Rain
818Op 82Hp dp
AT All
r
Name Latitude, Longitude, Elevation, Rim R89 N89 %• %, %c K % øN øE masl Agadez 16.59 ø 7.59 ø 500 138 130 26 -0.3 -2 1 -7.1 23.6 Birni N'Konni 13.47 ø 5.22 ø 272 534 450 48 -3.7 -19 11 -1.8 7.7 Bohicon 7.10 ø 2.04 ø 167 1150 895 58 -3.2 -20 5 -2.5 8.2 Chikal 14.37 ø 3.26 ø 250 276 39 -1.7 -23 -9 -4.3 14.9 Cotonou 6.21 ø 2.23 ø 4 1250 913 45 -4.5 -38 4 -2.0 6.3 Diffa 13.14 ø 12.25 ø 350 288 221 22 -1.8 -10 4 -5.0 25.8 Gays 11.53 ø 3.27 ø 180 819 576 50 -4.2 -30 5 -4.2 19.1 Gour6. 13.49 ø 10.07 ø 451 335 289 33 -2.6 -15 5 -5.0 21.5 Maradi 13.29 ø 7.13 ø 388 541 587 36 -3.9 -22 8 -5.0 21.4 N'guigmi 13.51 ø 13.23 ø 289 218 109 16 -4.4 -35 0 -5.5 22.0 Niamey i 3.36 ø 2.08 ø 222 566 600 .31 -4.7 -35 4 -6.1 20.5 Parakou 9.21 o 2.36 ø 320 I 190 1171 64 -4.1 -31 2 -3.3 12.0 Sav6 7.59 ø 2.28 ø 198 1100 740 57 -4.0 -24 9 -3.0 8.6 Tahoua 14.54 ø 5.21 o 384 389 362 51 -4.3 -30 4 -5.1 20.2 Zinder 13.34 ø 8.54 ø 489 460 318 36 -4.2 -25 9 -4.7 19.7
Rim
(mm
yr
-l) is the
yearly
tnean
of annual
rainfall
amount
(1925-1984
after
Le Barbd
et al. [1993]
for the Benin
and 1950-1989
after
Le Barbd
and
Lebel
[1997]
for the
Niger).
R8•(mm
yr
-1) is the
rainfall
amount
during
the
rainy
season
in 1989.
N89
is the
number
of studied
rainfall
events
in 1989.
Values
8'8Op,
82Hp
and
dp
are
the
mean
values
weighted
by
rainfall
mnounts
for
the
analyzed rainfall events in 1989. Values AT and AH r are the average variation of temperature and of relative humidity in the rainfall
events of 1989.
oxygen in water with oxygen of known isotopic composition in carbon dioxide gases. Analysis was performed by using a VG- Micromass 602E mass spectrometer. The analytical errors were 0.2%0 for 8180 and 2%0 for 82H.
Water samples were collected and stored in glass bottles of 20 mL kept in a cold and dark place until the analysis was performed in France at the University of Orsay. Isotopic data of one sample from Niamey and of six samples from Tahoua have been disregarded. They present d values of less than -50%0, which seems excessive and may correspond to samples evaporated after they were collected. For all other data the conformity has been checked by comparison with the measurements of temperature and relative humidity and, for Niamey, with the set of data on samples of 1992-1995 [Taupin et al., 1997].
Temperature and relative humidity, which control the isotopic ratios of water [Craig e! al., 19631, were measured before and after each rain event. In tropical areas, saturation of the air is far from being reached, and the variation of the air parameters during a rainfall event is an integrating indicator of the exchanges between the raindrops and the air. If the air is almost saturated, the decrease in temperature and the increase in humidity should be small. On the contrary, if it is far fi'om being saturated, exchanges
dilU tU d 111 tk• i I i[dk. I lit Ul k.,
increase in relative humidity.
5. Spatial Evolution of Rain Characteristics
5.1. The 82H, 8180 and
Deuterium
Excess
The rain event
values
of 8180 range
between
-11 and 4.2%0
when the d values range between 27 and 26%0. These ranges are smoothly lowered when the weighted mean values are considered
(Table
3). The large
range
of monthly
mean
8180 values
(-7.1 to
4.2%,,) is especially noticeable for rainfalls of small amounts (<100 mm in Figure 3). This reflects either evaporation or convection up to high altitudes [Taupin and Gallsire, 1998].
When
monthly
or rain
event
data
, 5180 are plotted
versus
the
rain amount for one particular station, no amount effect is
observed. When all the monthly data h'om the 15 statioos are considered, only a smooth trend is observed that mirrors the
geographical variation: where an enriched isotopic ratio corresponds to a small amount of rain from more arid regions and
lower values of the isotopic ratio correspond to greater amounts of precipitation from humid regions.
The spatial evolution of the seasonal weighted mean values of
73180
(Figure
2) shows
that
from
Cotonou
to Niamey
and
between
Zinder and Niamey the values are close to -4%o. This value
corresponds to oceanic rains at thes• latitudes [Craig and Gordon, 1965; Rozanski et al., 1993] and is corroborated by data from groundwater in Nigeria [Loehnert, 1988], Ghana [Akiti, 19801, and in the Niamey region [Leduc and Taupin, 1997]. This lack of continental effect with increasing distance from the Gulf of Guinea argues in favor of a continental source of vapor.
The main source of vapor in the region under study is obviously the Gulf of Guinea. In addition to climatological evidence, the isotopic data show that in most cases the minimum
values
of 8180 are contemporaneous
with the heart of the
monsoon (Table 3 and Figure 4). The Sahelian stations between Niamey and N'guigmi, show a V shaped evolution of the event
8180 value
with
the
minimum
values
in August
at the heart
of the
rainy sea•on. At the edge of the rainy season the ... lOl 1 illlllilll U3Uilt3 higher values because of the evaporation of the raindrops as they
fall.
Joseph et al. [1992] developed an isotopic argumentation leading to an Indian Ocean source for the rains over the Sudan-
Sahelian zone (10øN-15øN) in the whole African continent.
Isotopic data on rainfall were then available for nine stations
between the Indian Ocean and Dakar. These authors associated
these scarce data with some others from shallow aquifers and presented a graph of an apparent decrease from east to west over 70 ø of longitude. They explained this by a major contribution of moisture from the Indian Ocean. Today, the 13 available data over only 20 ø of longitude (Figures I and 2) allow us to conclude that
the
weighted
mean
values
of 8180,
ranging
between,-4.9
and
11,916 TAUPIN ET AL.: RAINFALL 1SOTOPICAL DATA IN WESTERN AFRICA a) 4 2 +
0 +_ +g
-2 ß 4 6 8 +Oo
e O
eoo
q- o+•
ß 0
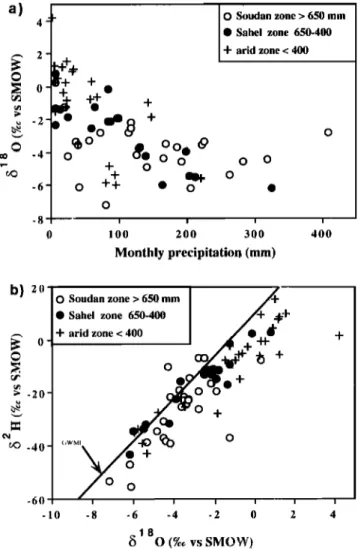
0 Soudan zone > 650 mm ß Sahel zone 650-400 q- arid zone < 400 o o o ß i i i i 100 200 300 400 Monthly precipitation (ram)b) 20 •' .20 t• -40 0 Soudan zone > 650 mm ß Sahel zone 650-400 q- arid zone < 400 ß • + o -60 , , , i '-B-•' ! -10 -8 -6 -4 -2 0 2 4 18 15 0(%• vsSMO
Figure 3. Monthly weighted
mean values
from rainthll event
values
from
1989:
(a) $180
versus
rain
amount
and
(b) $2H
versus
$180. Sudanese zone includes Bohicon, Cotonou, Parakou, Save,
and Gaya;
Sahelian
zone
includes
Birni N'Konni,
Maradi,
Niamey,
and Zinder; and Arid zone includes Agadez, Chikal, Diffa, N'guigmi, Gour6, and Tahoua. SMOW, Standard mean oceanwater.
relatively
wide
range
of 15180
in the
phreatic
aquifer
in the
region
of Niamey, between -2.5 and -5.2%0 [Leduc and Taupin, 1997],
demonstrates that an isolated value from an aquifer should not be
used without a thorough hydrogeologic study. Finally, isotopic
and chemical data on rain samples in Senegal [Travi et al., 1987, 1993] show that the main source of vapor is the Atlantic Ocean.
•The previous argumentation of an Indian source of vapor feeding
rainfall as far as Senegal is therefore no longer valid.
A continental source of vapor is related either to the nonfractionating transpiration from vegetation or to the
fractionating evaporation from water bodies. Transpiration adds
vapor to the atmosphere which tends to offset the continental
effect
by lowering
the expected
depletion
of $180 values
but not
modifying the deuterium excess value. A source of vapor related to evaporation adds vapor to the atmosphere and tends to decrease
$180
values
and
enhance
d values
(e.g.
Gat
and
Matsui
[ 1991
] for
the Amazon basin). In the region under study, water mass balance
shows that a large amount of rainfall returns to the atmosphere, up
to 90% in the Sahelian zone of Niger [Leduc and 72tupin, 1997] and up to 70% in the Sudanese zone in Benin [Le Barbd et al.,
19931.
We shall now try to identify the rainfalls for which
transpiration tnay be the major source of water vapor. Let us
assume
that
these
rainfalls
have
a $180 value
ranging
between
-3
and -5%0 and a d value ranging between 8 and 12%o. Only a few
data from Save and some other stations close to Birni N'Konni fit
this criterion (Table 2 and Figures 2 and 4). Even Cotonou, Bohicon, and Parakou, where humid tropical vegetation exists, do not have rainfalls fitting the criterion. Hence the contribution of
transpiration appears to be poorly inscribed in the isotopic data.
Either this source •s quantitatively weak, which is surprising in the tbrested region, or •ts contribution is masked by another process such as evaporation of raindrops.
We shall check the d>10%o as a tentative criterion to
characterize the rainfalls for which one source of vapor could be water evaporation on the continent. For the mean values of the season (Table 2), only Bimi N'Konni fits the criterion. Considering the monthly values (Table 3), 12 of 70 data fit the criterion. They belong to nine stations mainly distributed in the Sudan-Sahelian zone. Considering the rainfall event data, all the
Table
3. Monthly
Mean
Values
of $180
and
d
May June July August September October Percentage With d
Stations
(N)
•180 d
15180 d
•180 d , •180 d
15180 d
15180 d
<5%½ >10%c
Agadez (13) 0.9 -3 -0.7 4 Bimi N'Konni (30) -0,! 4 -3.7 14 Bohicon (27) -2.5 8 -3.5 7 -2.8 13 Chikal (22) -0.4 0 -3.5 3 Cotonou (22) -6.2 10 -2.8 -2 -3.3 13 Diffa (16) 1.0 7 -0.6 0 Gaya (20) -0.9 -5 -5.9 11 Goure (I 8) -0.9 0 Maradi (26) - 1.2 8 -3.9 9 N'guigmi (10) 4.2 -15 0.5 -5 Niamey (24) -I.8 3 -1.9 0 Parakou (41) -3.5 7 -3.3 4 -4.4 -3 Save (25) 0.3 -10 -3.4 10 -3.2 10 Tahoua(25) 1.3 -3 1.6 -5 0.3 -3 2.1 6 -0.8 I 0.3 -7 69 8 -6.0 13 -2.5 7 30 60 -2.2 I 1.2 -27 -4.2 2 33 15 -1.8 -13 -0.7 -9 86 0 -7.1 4 -2.8 3 -4.5 0 45 32 -4.8 I I 1,2 -2 1.2 -6 69 12 -5.8 4 45 30 -4.4 I I -2.5 3 61 22 -5.5 10 -2.1 4 -I.3 3 42 35 -5.4 I 0.2 8 90 0 -6.2 5 -4.2 2 - 1.3 I 65 12 -4.5 5 -3.6 2 -6.1 6 42 15 -4.2 9 -4.3 20 4.9 5 36 52 -5.6 5 -1•5 4 64 12 -5.4 11 -2,3 7 0.8 -3 48 33 •i_n_d_er_(2! )Values
are
weighted
by r•-ir•fall
amount,
N is the
number
of taipei'all
events
analyzed
tbr oxygen-
18 and
deuterium.
The
two
last
columns
show
TAUPIN ET AL.' RAINFALL. ISOTOPICAL DATA IN WESTERN AFRICA 11,917 a) 20 • 10 0 -10 -20 -30 , I
I,I.L
-10 -12150 • Cotonou
125
100 50o , I II
! - 12520
0 -10 -20 175 225 275 -3O 4 2 -8 -10 -12 150 125 100 75 5O 25 0 125 Bohicon -10 : -20 -3OI,I
ß I?' I' 4 2 -8 -10 -12 Save150
-!
125 100 75 50 125 175 175 225 275 225II ,I
I. I, 275,ill,.,,
i,[ll...l,
I,
I --
-•o -I .-20
•
Auguslt
-30 4 -10 -12150 Parakou
•'125
,• 100
• 50• 2•
J
125 175 225 275 Time since the 0•01/89 (day)20 lO 0 -10 -20 -30 4 2 0 -2 -4 -6 -8 -10 -12 150 - Birni N'Konni 125 100 75
I
0 •,11,,•l •.,,!
20 lO 0 -10 -20 -30 4 2 0 -2 -4 -6 -8 -10 -12150 Agadez
125 100 75 5O 25 0 , 125ikl! , ,
,I,
I , .__.
!.,,L
,I ,, ,
125 175 225 275 175 225 275Figure 4. Rainfall
event
data from 1989, including
rain amount,
oxygen-18
and d versus
time. (a) Stations
from
.... ,h rr,^, ... • t,, north t a,,•4o,,• (b) qltatianq fram we•t (Niamey/to east (N'm]iemi/ in the Sahelian zone./•1•:1..-,1 and nt' ß ß
stations except the very arid u•c• of ,•m,,.a, l, gulgml present
events
fitting the criterion.
The percentage
of rainfall
events
fitting
the criterion (Table 3) is as high as 60% for Birni N'Konni and 30% for six other stations. It is very likely that everywhere in theregion
one important
source
of vapor
is continental
evaporation.
Now the question is: Where does this evaporated water come from? There are two large, open water bodies. One is lake Chadthat
can
reach
20,000
km
2. This
lake
and
the
vapor
above
it were
sampled
in the late sixties
[Fontes
et al., 1970].
Evaporation
from
the lake is evident
from its $180 values
ranging
between
0 and
15%o
and
from
the slope
of 5.2 in a $2H versus
$180 graph.
Vapor
sampled
between
June
and August
shows
high values
of d
•,•ow and low'
values
of $18
0 (_ 15 to 1
•oz•x
r).-,•..•..•..,:
.... t
N'guigmi are most probably related to a contribution of vapor from the lake that was not dry in 1989 [Olivry et al., 1996]. However, they are not associated with d values exceeding 10%o; it is very likely that evaporation affected the falling raindrops. The other large, open water body is Kainji dam, but no station is sufficiently close to it to be able to characterize its specific influence. Finally, if vapor originating from evaporation is prevalent in the region, the source could be the soil water wetted by previous rainfall events or even water evaporated from these events.
11,918 'I'AUPIN ET AL RAINFALL ISOTOPICAL DATA IN WESTERN AFRICA 20 -] 10 0 -10 -20 -30 2 0
-2
-8 -10 -12 150125
10075
50 25 0 , 125I,II
Niamey [ ! , [ 175 225 Ill I i20
1ot
o -1o -20 -30 4 2 o -2 -4 -6 -8 -lO -12 Maradi15o
-I
125
!
100t
5O 25 0 • , 125,.I I iill,
i
'l ]1
']["l['
I
i I i [ i 175 225 275 20 l0 0 -10 -20 -30 4 2 0 -2 -4 -6 -8 -10 -12 150 125 100 75 5O 25Illl
',1'11r
Zinder 125 , [ 1 175 225 275 2O • 10 0 -lO -20 -•0 4 -10 -12 150125
10075
50 25 0 , 125 Gour6 '- r ... i i i 175 225 275 Time since the 01/01/89 (day)i 20 -, 10 ß
ø
t
-10 -20 -30 4 0 -2 -4 -- -6 -8 -10 -12 Diffa 150 125 100 75 5O 25 I 0 [ 125'l
2O 10 -10 -20 175 225 275 275 Figure 4. (continued) -3O -8 -10 -12150 N'guigmi
125 100 75 5O 25,
o , , ,__,
•!11,3
',
125 175 225chosen as d<5%o. At the seasonal scale, nine of the stations period under consideration the maximum duration ranges between
between
Agadez
and Cotonou
and between
N'guigmi
and Niamey 10 and
23 days.
The maximum
duration
of the dry event
preceding
(Table
2) fit the criterion.
At the monthly
scale,
44 of the 70 data the rainfall
events
that present
d values
exceeding
10%o
is 2 days
again
fit the criterion
(Table 3). At the event
scale,
52% of the in Agadez,
5 days
at Sahelian
stations,
and is unlimited
in the
rainfall events
would be affected
by evaporation
(40% in the Sudanese
zone.
In these
semi-arid
and arid regions
the available
Sudanese
zone and 61% in the Sahelian
zone). All the stations water
from previous
rainfalls
has "disappeared"
after these
2 or 5
from
Sahelian
and
arid zones
present
an evaporated
signal
at the days.
In the Sudanese
zone
there
is no limit to the duration
of the
beginning
of the
rainy
season
(•5180>-4%o
and
d<10%o,
Figure
4). dry
event,
water
is always
available
for evaporation.
It is very likely that this phenomenon
hides
the isotopic
signature To conclude,
isotopic
data
provide
arguments
for excluaing
the
of the vapor
sources.
Conversely,
this process
constitutes,
on its Indian
Ocean
as a noticeable
source
of vapor
for Sahelian
rainfall
own, a source
of vapor
that is able to feed the subsequent
rainfalls. and including
various
other sources
of vapor: the maritime
one
An argument
in favor of this hypothesis
comes
from the study
of from the Gulf of Guinea transported
by the monsoon
and the
the dry event
between
two rainfalls.
For all the stations
and the continental
one transpired
(less)
and evaporated
(more)
from soil
TAUPIN ET AL.' RAINFALL ISOTOPICAL DATA IN WESTERN AFRICA 11,919
Table 4. Temperature and Relative Humidity Variation Associated With Rain Events Name N Mean Rainfall Events Rainfall Events
AT, K With AT<-2 K, With AT>-2 K, %
small rains, % % Agadez 13 -7.1 46 15 23.6 42 Bimi N'Kom,i 50 - 1.8 8 66 7.7 10 Bohicon 58 -2.5 17 36 8.2 19 Chikal 31 -4.3 26 29 14.9 16 Cotonou 45 -2.0 9 53 6.3 4 Diffa 21 -5.0 14 24 25.8 20 Gaya 48 -4.2 40 29 19.1 44 Gourd 17 -5.0 18 29 21.5 18 Maradi 27 -5.0 7 18 21.4 I 1 N'guigmi 16 -5.5 44 31 22.0 50 Niamey 30 -6.1 20 20 20.5 13 Parakou 64 -3.3 30 27 12.0 31 Sav6 57 -3.0 25 40 8.6 14 Tahoua 33 -5.1 30 27 20.2 36 Zinder 15 -4.7 7 33 19.7 6
Mean Rainfall Events Rainfall Events
All r, With Attr>10% With Altr< 10%, %
% small rains, % 15 62 55 48 78 20 29 23 22 19 40 42 63 21 31
N is the
number
of rain
events
w•tl•
•-c--•d AT and
AIt
r values.
Rainfall
events
with
A/k-2
K, small
rains
are
the
percentage
of rainfall
events with a large decrease of temperature for rain with small amounts (less than 5 mm at the arid-Sahelian stations and less than 10 mm at the
others). Rainfall events with A75.-2 K are the percentage of rainfall events with a small decrease of temperature for any amount of rain. Rainfall
events with AHr>10%, small rains are the percentage of rainfall events with large variations of relative humidity for rain with small amounts.
Rainfall events with Altr< 10% arc the percentage of the rain events with s•nall variations of relative humidity for any amount of rain.
and rain. In the Sahelian zone the previous rainfall generally feeds the subsequent one when the dry event lasts less than 5 days. A dominant process in the region is the evaporation of raindrops. 5.2. Evolution of Climatic Parameters AT and Att r
The difference in temperature (AT) and humidity (Altr) measured at ground level between the end and the beginning of a rainfall event is presented in Table 4. During the 1989 rainy season in the studied area, the variations in temperature during rainfall events range between- 2 and -16 K •.Figure 5). In the following text, large variatio•ls of temperature refer to A7' values
ranging between -2 and -16 K. Variations of relative humidity range between 50 aml -10% (Figure 6), disregarding the probably erroneous value of-21% at Agadez. In the following, large
variations of relative humidity refer to AHr values ranging
between 10 and 50%.
Over the period under consideration, the mean values of AT (Table 4) vary fi'om -2 K at Cotonou to -7.1 K at Agadez. The mean values of AtI r (Table 4) vary similarly from 6% at Cotonou to more than 20% at Agadez and Diffa. This progressive increase
in the variations of temperature and relative humidity during
rainfall indicates an increase in the exchanges linked to a deficit of
0 -5 -15 0
-s
-10 -15 ,• 0 40 80 120 Rain amount (ram)o -5
-•u
.• •
Tahoua
-15 -5 .:., ,-10 o '
15 0 40 80 12015 !.3
Parako,,
o -5 -!o15
•t' '
Agadezl
5 0 -5 -10 -15 0''
N'guigmi]
I '1'1' I'1' I'1'1 '1'1 '1'1' I'1
40 80 120
Figure 5. Variation
of temperature
AT versus
rainfall amount
for nine stations.
In the upper
hatched
rectangles
limited below by AT=-2 K, dots correspond to rains with low temperature variations for any rain amount. In the shaded left-hand rectangles, dots correspond to rains with small amounts and large temperature decreases.11,920 TAUPIN ET AL.: RAINFALL ISOTOPICAL DATA IN WESTERN AFRICA 3O 2O 10 -10
øtl
ß
Niamey 50 i!
I øl?L
.'
Tahoua
40 -l..-•r ø ß o I 40 i:. o 30 ß ß20
20
0 10 0-20
-10
ß . BirniN'Konni
31) •
10
0 -10 -20 0 40 80 120 Rain amount (mm)50•o
:o Gour•
30 10 010 I'1 '1'1' I'1' I"1'1 '1'1 "1"1" I" 30 20 10 0
i•
ßParakou
ß ß•0
I!:l
*
Agadez
000
N 'guigmi
5O :- 40 30 2Oo I"1-'1"1' I'1' I'1'1 '1'1 "1'1' I'
0 40 80 120 0 40 80 120
Figure 6. Relative humidity variation versus rainfall amount for nine stations. In the shaded left-hand rectangles limited by AH r -- 10%, dots correspond to rains with high variations of relative humidity and small amounts. In the lower hatched rectangles, dots correspond to rains with small variations of relative humidity for any rainfall amount.
atmospheric humidity. Over the Sahel zone the mean AT values range between -6 and -4 K except for Birni N'Konni, where the AT value (-2 K) is close to that of coastal stations. Similarly in this zone, the mean Att r values range between 15 and 26% except for Bimi N'Konni, where the Aft r value (8%) is also close to that of the coastal stations.
Stations in humid tropical areas (Cotonou, Bohicon, and Save)
and the Sahelian station Bimi N'Konni have small mean values (-3
K<AT<-2 K) and more than 30% of rainfall events (Table 4) with small temperature variations (-2 K<AT<2 K and AHr<9%). More arid stations (Agadez, Tahoua, and N'guigmi) present greater temperature and relative humidity variations associated with rainfall events (-7 K<AT<-5 K in Figure 5 and AHr>20% in Figure 6) and over 30% of these events are small rainfall events with large temperature or relative humidity variations (-15 K<AT<-2 K and AHr> 10% in Table 4).
The set
of data
of 6180,
deuterium
excess,
AT and
AHr shows
very good correlation and can be used to characterize atmospheric processes. Evaporation is well defined at arid stations (Agadez, N'guigmi, and Tahoua) where 30% of the rainfall events present
positive
values
of 5180,
and
30% also
show
small
amounts
with
large decreases in temperature (-15 K<AT<-2 K) as well as large increases in relative humidity (10%<A/-Ir<50%). Vapor recycling
is well characterized for stations (Cotonou, Save, and Bimi
N'Konni) where reevaporation from the continent constitutes an important contribution to the precipitation. At these stations, 30%
of rainfall events have large values of deuterium excess (d>10%,,)
and small variations in temperature and relative humidity. The different parameters are less well correlated for the other stations that are either subjected to intermediate climatic conditions or subjected to the influence of peculiar geographical characteristics.
6. Particularity of the Area of Birni N'Konni
The peculiar isotopic ratio and climatic data in the region of Bimi N'Konni could be explained by regeneration of air masses
through evapotranspiration from local free water bodies. The anomalies in the isotopic data of rain and air characteristics are
corroborated by the vegetation index map based on satellite images in August 1989 which present higher relative values in the region of Birni N'Konni than in the surrounding areas at the same
latitude [Rigal, 1989].
The geological
map (Figure
7) shows
outcrops
of sedimentary
formations overlying the crystalline bedrock of the Pan-Africanshield 150 km south
of Bimi N'Konni. The Sokoto
valley is a
zone of natural
recharge
of the sedimentary
aquifers
[Geyh and
Wirth, 1980]
and may constitute
a potential
source
of water
vapor
during the rainy season.
The main land use change in the region is the Kainji dam
(Figure
1) on the Niger
River.
Its water
surface
area
is 1250
km2;
it was first filled in 1968 [Beadle, 1981 ] and is mainly used for theproduction of electrical power. A smaller but closer modification
is the Bakolori Dam on the Sokoto River (Figure 7). It was filled
in 1983 during the rainy season and has a water surface area of 80
km
2. About
230 km
2 of land
are irrigated
from
this
reservoir
[Adams, 1996; Bird, 1985]. In the Sokoto valley, rice crops have been grown since a few years after the dam was built [Larousse,
1984] and seem to be continued [Serryn, 1988; Serryn and
Blasselle, 1994].
If these land use changes have a real impact on the isotopic and climatic parameters in the Birni N'Konni region, what effects have
been recorded? The data available to test whether or not these