HELEN T. CONLEY
SUBMITTED IN PARTIAL FULFILLMENT OF THE REQUIREMENTS FOR THE
DEGREE OF BACHELOR OF SCIENCE
at the
MASSACHUSETTS INSTITUTE OF TECHNOLOGY
May 1980
© Massachusetts Institute of Technology
| Signature redacted
Signature of Author _a Kejartment of Mechanica) Engineerin
Sj t dacted May 3.1950
ignature redacted ™
Certified by oo BN
lr RAP 2" Robert 0. Ritchie
Signature redacted Tess Supervisor
Accepted by —. ve
| / Chairman, Department Committee
ARCHIVES
SST
by
AN ACCELERATED XIsac TEST FOR
HIGH-STRENGTH STEELS IN HYDROGEN
HELEN T. CONLEY
Submitted to the Department of Mechanical Engineering on May 9, 1980 in partial fulfillment of the requirements for the Degree of Bachelor of Science in
Mechanical Engineering
ABSTRACT
An accelerated method was used to estimate the threshold
stress intensity, Kisco, for crack growth under sustained loads in
gaseous hydrogen, for a 300-M ultrahigh-strength steel, tempered for
1 hr. at 300 °C. The method consists of a one-hour test, in which
the load is applied monotonically to a compact tensile test specimen
in a hydrogen gas environment. The test was conducted at room
temperature with the gas at a pressure of 138 kPa (20 psig). The load was ramped linearly, so that the stress intensity ranged
approxitately from 0 to KIc over a period of one hour
(KR = 1.1 MPaTm/min = 1.0 ksiTin/min). By this accelerated method,
called a rising load Krsge test, KIiscc was found to be 34.4 MPaim
(31.3 ksifin). This method overestimated Kiscc by 85%. A better estimate might be obtained if the loading rate was slower (perhaps
K = 0.1 MPa m/min).
When used in Wei and Landes superposition model, the
rising load KiscC value did not adequately predict the fatigue
crack growth behavior in a gaseous hydrogen environment, for load
ratios, R, of 0.05 and 0.30, at 50 Hz.
Thesis Supervisor: Robert O. Ritchie
I would like to thank the M.I.T, Mechanical Engineering
Department, especially Professor Robert 0. Ritchje and John
Toplosky, for all their help and guidance throughout this project.
I would also like to thank Professor Stanley S., Backer for his encouragement and support while I've been at M.I.T.
Pag.
TABLE OF CONTENTSa
ABSTRACT... | Ceeee. E
ACKNOWLEDGEMENTS. ovo veeeees aerveenernecaaennrneneneananenen 3
TABLE OF CONTENTS. enue i eiveeaeiaanrenennensanoneaenns 4
LIST OF FIGURES .uvueervurterenenenenenenenenennnenanenenes ©
1. INTRODUCTION... Cece ier eeeeee.. 8
> THE RISING LOAD METHOD OF DETERMINING Kisegrrorrrmrenees 12
2.1 Summary of Method. .... cover iiineeirnnennnnn 12
2.2 Specimen Configuration, Dimensions and Preparation.. 12
2.3 The Fatigue Crack... ‘es A
2.4 Calibrating the Clip Gage...cvveerveererneeenneea. 14
2.5 The Kic Test Procedure. ...cociiiievicnncanacennss 16
2.6 Calculating STILEERERES vié Einuiibdenenvszies IB
2.7 The Kisce Test Procedure...cvet-. 4 0
2.8 Calculating the Rising Load Kigegerorrrrrrrrmrnnenns 21
2.9 Accelerated Test Results and Discussion... 21 The Superposition Model for High-Strength Steels... 32
3.1 Wei and Landes Superposition Model... . .. ... 32
3.2 Using the Accelerated K Test to find the
Environmental Contributigh’ to the Superposition
CUPVE. teeters imieeeaeine eine eeeeee. oo. 36
REFERENCES « «+ ve eevee ee eee eee eee ee eee eta BT
APPENDIX A: EVALUATION OF f(a/W) in Equation 2... B53
APPENDIX B: CALCULATION OF Ki(vueveonrvenarneranarnennnnnnnen. 54 APPENDIX C: CALCULATION OF Kigppeessenesnenrnnenrnannsneaeancns 56
VG. Po
5
LIST OF FIGURES
2s “age
1 The Superposition Model for High-Strength Steels... 11Z Standard Compact Tensile Test Specimen (1)... 13
’ Standard Compact Tensile Test Specimen Modified To
Measure Kimeeeeeeeeeeeni none vin cvinonecnnanc:naaa 15
IC
l Specimen Mounted in MTS Machine for Kisce Test... 17
3 Principal Types of Load-Displacement Records... 18 6 Test Record of Accelerated Kisee Test and Kic Test.... 26
” Scanning Electron Micrograph of K C Test Specimen
(Magnification of 3000x). Fracture by Microvoid |
COATES CENCE. teeter ears ren creatine eeeeeae.
Scanning Electron Micrograph of Rising Load K C
Test Specimen (Magnification of 1000x). Fract pg
by Intergranular Cleavage Along Prior-Austenite
Grain Boundaries... eee eins iveniarerionnennnnenncrneas 29
9 Effect of Loading Rate on Apparent Kise (14)... 31
10 Typical Crack Growth Curves for High Strength Steels.... 38 11 Schematic Diagram Showing Regimes of Hydrogen- .
Assisted Growth (9) ..vevnr tienen ii ii iiiereenenann. iP
12 Schematic Diagram Illustrating the Suggested Methods
of Analysis. (a) Stress Intensity Spectrum in Fatigue
(top left); (b) Rate of Crack Growth Under Sustained
Load in Aggressive Environment (top right); (c)
Environmental Contribution to Crack Growth in Fatigue
(bottom left); and (d) Integrated Effects of
Environ-mental and Mechanical Effects (3).everenrens ov eewene.on 3
13 One Load Cycle. ene enve ones tier eter eoennaoannanonens 38
14 Sustained-Load Crack Growth in AISI 4340 Steel
(Tempered at 204°C) in Dehumidifed Hydrogen a3
at 133KPa. (15). iieii iii ities ir iireannnnannannns
CHAPTER 1: INTRODUCTION
An understanding of the fatigue crack growth behavior of
high-strength steels in a corrosive gaseous hydrogen environmen: ¢s im-portant in many applications. Plans for coal gasification pressure
vessels require material that can withstand cyclic loading. high
pressures, and a highly corrosive hydrogen environment. Carrcsive
fatigue is also important in the design of offshore driiiing
plat-forms because of the hydrogen produced by electrochemical reaction between iron and seawater. Cracks initiate and propagate from
material flaws. It is safe to assume that flaws exist and that scre-where a crack will initiate. It is then important to know how fast
the crack will propagate so that inspections can detect cracks
be-fore they lead to eventual fracture.
Kisce is the plane-strain stress intensity factor below which
an existing crack will not grow due to stress corrosion. A standard Kisco test consists of applying a constant load for typically 1,000 hrs. in the corrosive environment. The stress intensity below which no cracks will propagate, at least over the 1.000 hr. period, is taken to be K;c... This test does not, unfortunately, produce re-liable results for use in all designs. Values of Kisee Will vary, ge-pending upon the patience of the experimenter. Table ] shows values
of Kisce varying with the length of the test.
Tes™ ' .me Apparent :.
MPalm keiliin
ro es oo 179 TT1,000 127 115
10,000 oo 28 100 LJ 7 art 28-predict the crack growth behavior in cyclic loading. A method is needed to predict the cyclic crack growth behavior in hydrogen, and one that will take less time than the 1,000 hrs. of the
standard Kisce test.
Wei and Landes (1969) have proposed a superposition method of
determining the fatigue crack growth behavior of high-strength steels in hydrogen, at stress intensities above Kiscel3) This
method consists of superimposing the cyclic crack growth curve in air with a monotonic crack growth curve in hydrogen to predict the
cyclic crack growth curve in hydrogen (Fig. 1).
To shorten testing time, this project seeks to evaluate
whether an accelerated Kiscc test, called a rising load Kise test,
can be used to determine the monotonic environmental contribution
“SGU |
a |
dt
L v =.
wtf
CHAPTER 2: THE RISING LOAD METHOD OF DETERMINING Kicpe
2.1 Summary of Method
In a Ke test a cracked specimen is loaded linearly and a plot is obtained of the load vs. crack tip opening displacement (COD). A rising load Kisce test follows the same specifications and pro-cedure as the Kic test except, the specimen is placed in the corrosive environment prior to, and during loading, and a slower rate of loading
is required. Ki. is calculated according to ASTM standards (1) from
the test record. Kisec 18 then determined as the stress intensity at which the hydrogen curve deviates from the Kic curve.
2.2 Specimen Configuration, Dimensions, and Preparation
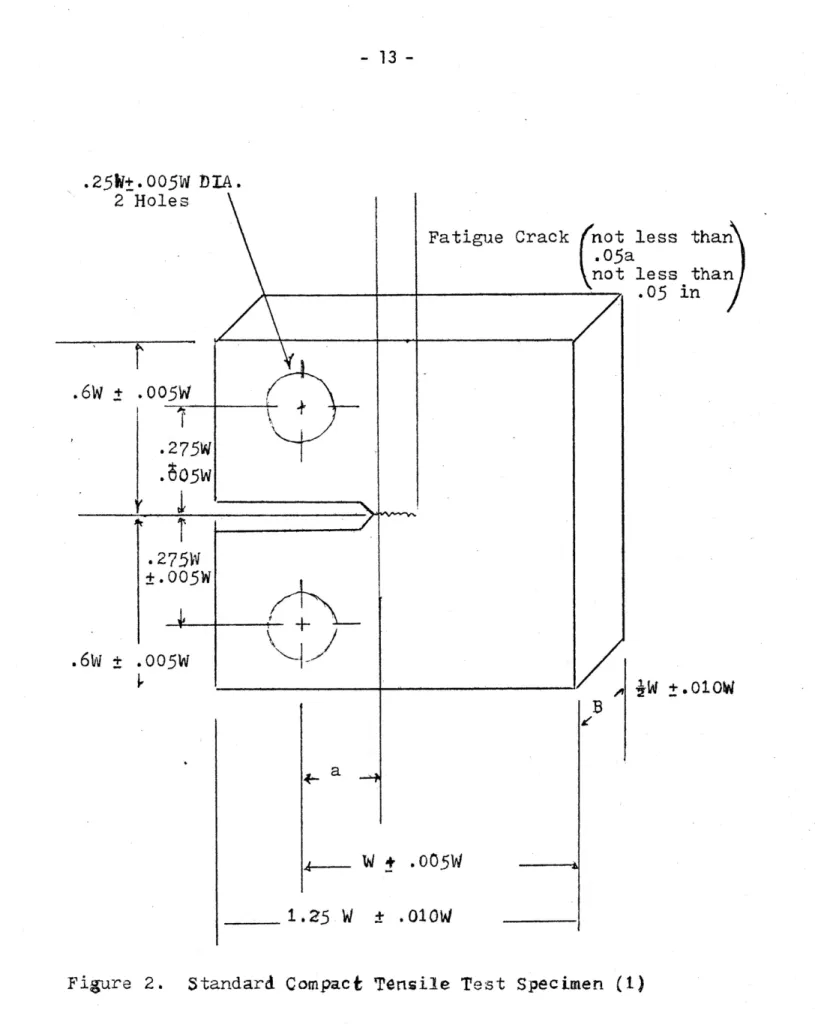
A compact tensile test specimen (Fig. 2) is used if it meets the specifications of the ASTM standards (1), so that the correl--ations between load and COD, based on linear elastic stress analysis, may be used. The specimen thickness, B, and the crack length, a,
must exceed 2.5 (K;o/oyc)®s where oye is the 0.2% offset yield
strength of the material for the temperature and loading rate of the test. This is to ensure that conditions of plane-strain exist at the crack tip by making sure that all significant dimensions are much larger than the plastic zone size. The crack length, a, must be nominally equal to the thickness, B, and must be between 0.45 and 0.55 times the depth, W. The crack-starter slot configuration must lie
Shu
Fatigue Crack fnot less than)
.05a
not less than J oe V4 .05 in / GW + 078 27 5W
BOsW
< Ak +,005W! v b OW + .005W | k FW +.0°7 WwW in oo W + .005W Sawithin the envelope, as shown in Fig. 2. To facilitate fatigue cracking at low levels of stress intensity the notch root radius should be 0.08mm or less. The specimen should be cleaned and
polished in the area around the notch where the crack will propagate.
2.3 The Fatigue Crack
A fatigue crack is to be extended from the notch at least 0.05 in. (1.3mm), in accordance with the above. During the last stage of the fatigue crack extension, for at least the terminal 2.5% of the overall length of notch plus crack, the ratio of the maximum
stress intensity of the fatigue cycle to the Young's modulus,
. 1/2 1/2
Kemax/ Es shall not exceed 0.002 in (.0032m'"“). Also, Kfmax
should not exceed 60% of the Kic value determined in the following Kic test. The stress intensity range should be not less than 0.9
“fma *
A fatigue crack is grown to ensure a small crack tip radius and thus a small plastic zone size at the crack tip. Then the equations developed from linear elastic stress analysis will be valid.
Knife edges are glued to the notched side so that the clip gage can be attached to measure the COD (Fig. 3).
2.4 Calibrating the Clip Gage
{
Clip Gage | (
(Ex tensome ter)
Qutput on
VoltsFa BA
Knife |W
Edges
|
Tw
Figure 3. Standard Compact Tenslle Test Specimen Modified
expected COD. This should be done twice to check for resettability. A record should be kept of the output voltage as a function of
dis-placement.
2.5 The Kic Test Procedure
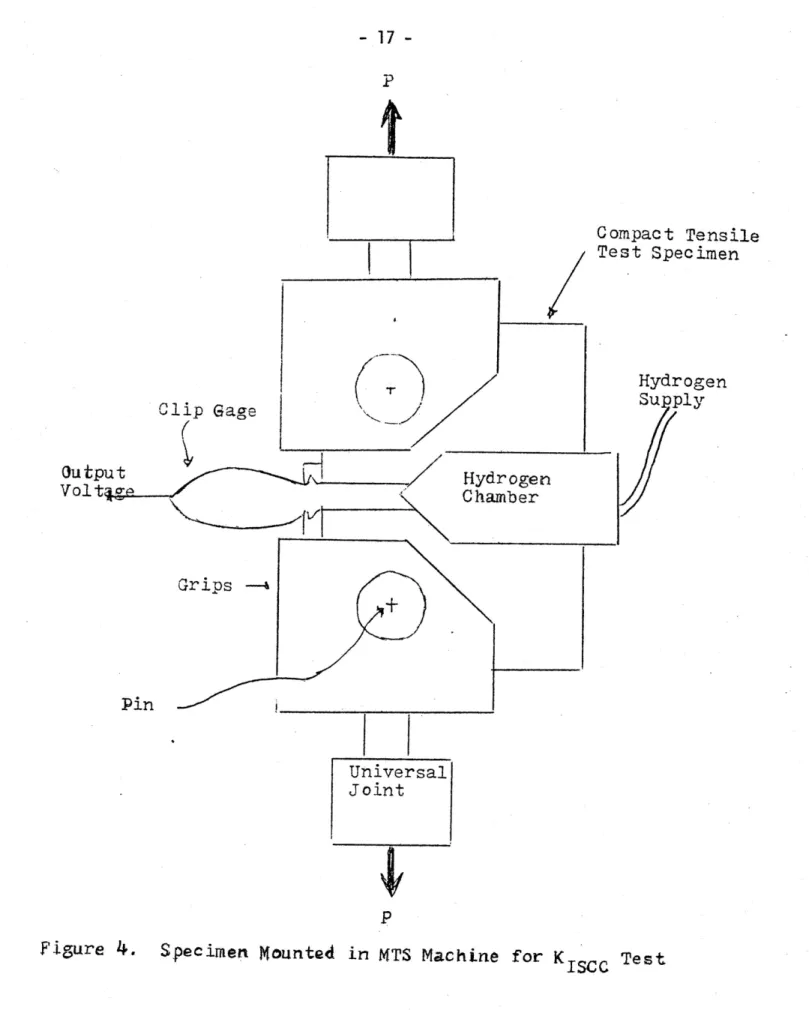
The specimen is mounted on the MTS (Materials Testing System) machine with a clevis and pin arrangement at both the top and bottom of the specimen, to allow rotation as the specimen is loaded (Fig. 4) A clip gage is attached between the knife edges. The MTS is pro-grammed to linearly increase the load. When the test is initiated the x-y recorder plots the load vs. clip gage voltage (proportional to the COD, which is proportional to the crack length, a). When the specimen fractures, the clip gage is removed.
2.6 Lalguloting Kic
To determine Kio the stress intensity at wnich the crack be-gins to grow, it must be determined whether the deviation from the linear elastic region of the test record is due to plasticity or crack growth; then at this point on the curve, knowing the load, P, and the COD (proportional to the crack length, a), Kic can be calcu-lated. The ASTM procedure is as follows:
Figure 5 shows a sample test record.
Pin
Compact Tensile
Test SpecimenHydrogen
Supply
Clip Gage
Qutput {nd Hydrogen
Voltage_ Chamber- 11
Grips — Universal Joint[ ¥
LOAD, | C
CTYPE1 J TYPE TI eR
A fo [fo
to Pe if the load at every point on the record which
pre-cedes Py is lower than Pg (Type 1 in Fig. 5). If the
maximum load preceeds Pg then, Pq = Pn
The ratio Prax’ Pq is calculated, where Pas is the maximum
load that the specimen was able to sustain. If Prax’ Pg is less than or equal to 1.10, then the test is valid. If not, the elastic stress analysis cannot apply. The specimen
geometry should be changed according to (1).
The crack length, a, is measured to the nearest 0.5% at five positions, at the center of the crack front, midway between the center and both sides, and at both ends. The average crack length is used in the calculations for Kic-If the difference between any two of the crack length
measurements exceeds 5% of the average, or if any part of the crack front is closer to the machined notch root than
5% of the average crack length, or 0.05 in. (1.3mm) minimum,
then the test is invalid.
Kic (in units of psivin) is calculated from the following
or. lL Nhere.
Ke = (Pg/BH' 7%) 29.6 (a/W)V/2 - 185.5 (au)?
+ 655.7 (a/M)®/2 - 1017.0 (a/w)’/? (1.)+ 638.9 (a/u)”/?
-= I's salle [2Kic = LPq/BW 1 f(a/W) 2.)
f(a/W) = polynomial function of a/W evaluated in Appendix A.
c
5. Calculate 2.5 (Kie/oys)
If this quantity is less than both the thickness, B, and the crack length, a, of the specimen then the test is invalid. In this case, refer to the ASTM Standards (1) for geometry changes that may produce
a valid test.
2.7 The Kisce Test Procedure
The specimen configuration, dimensions, and preparation are the same as those for the Kic test (Sec. 2.2).
The specimen is mounted on the MTS, like in the Kic test, but an environmental chamber is fitted over the crack tip (Fig. 4). The air is flushed out of the system and the chamber is pressurized to
K = 1.1 MPavin/min (1.0 ksivin/min). The Kc.. test is plotted on the same record as the Kic test. When the specimen fractures the clip gage and environmental chamber are removed. For high-strength
steels, intergranular cracking along prior austenite grain boundaries
is often indicative of hydrogen embrittlement (13). The fracture
surface should be examined; if the fracture mechanism was not
affected by the hydrogen throughout the test, the loading rate, K, was much too fast, and the test should be repeated at a slower
K
2.8 Cateulating the Rising Load Kisce
The Kisce curve is plotted over the Kic test record; the deviation from the Sh curve can be attributed to stress corrosion
cracking. The point where deviation begins corresponds to Kisces
which is then calculated using Eq. 2.
2.9 Accelerated Test Results and Discussion
An accelerated Kisee test was run on a 300-M
ultrahigh-strength steel, tempered for 1 hr. at 300°C. This steel is a silicon modified AISI 4340 steel used in the aircraft industry
; N 51 5 p \
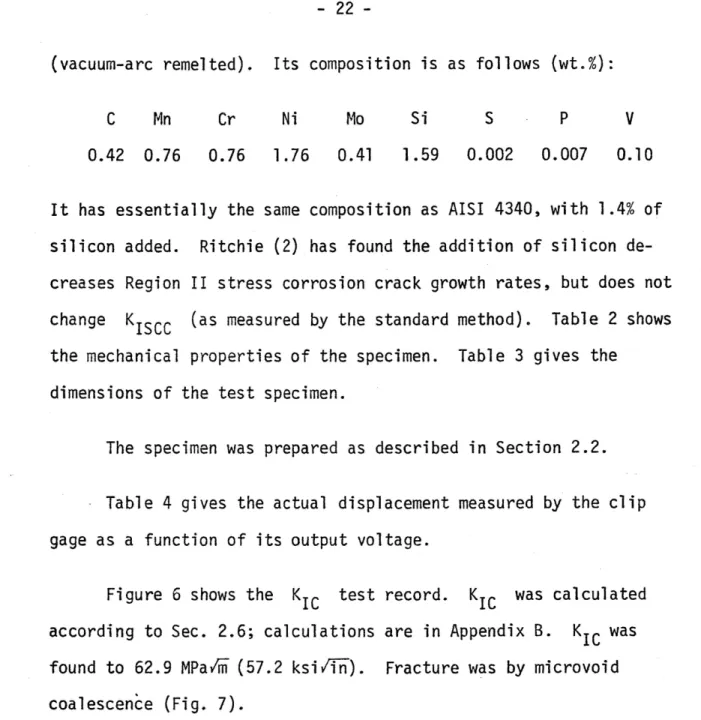
(vacuum-arc remelted). Its composition is as follows (wt.%):
c Mn Cr Ni Mo wr ’
0.42 0.76 0.76 1.76 0.41 1.59 0.002 0.007 0.10
It has essentially the same composition as AISI 4340, with 1.4% of silicon added. Ritchie (2) has found the addition of silicon de-creases Region II stress corrosion crack growth rates, but does not
change Kisco (as measured by the standard method). Table 2 shows
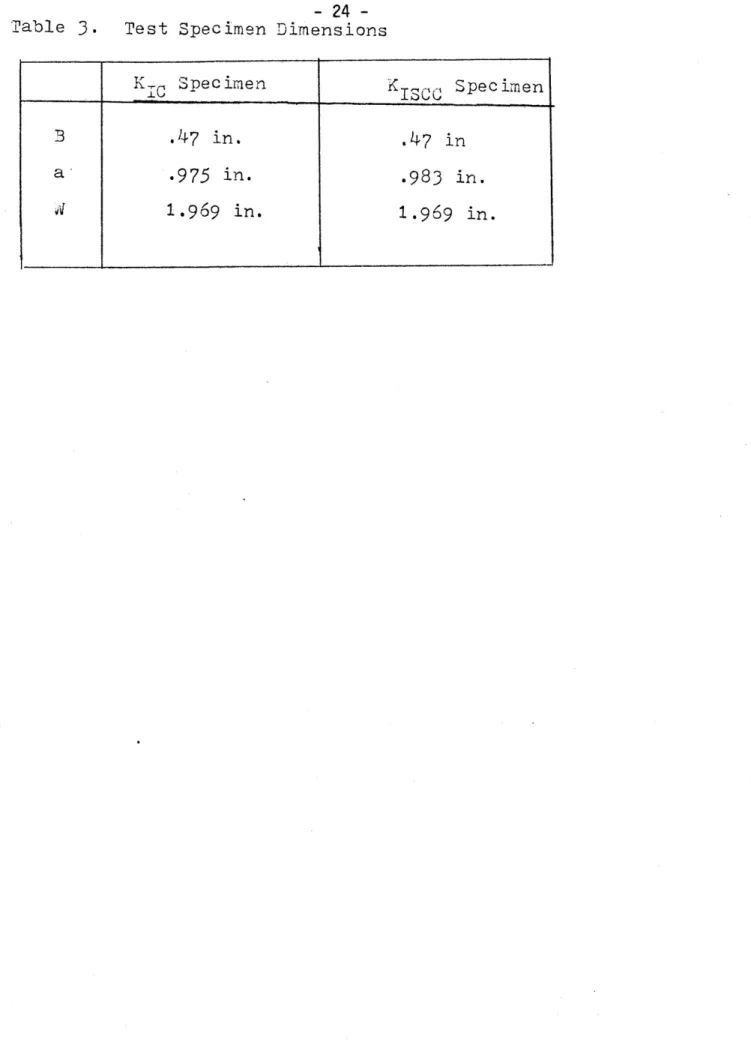
the mechanical properties of the specimen. Table 3 gives the dimensions of the test specimen.
The specimen was prepared as described in Section 2.2.
Table 4 gives the actual displacement measured by the clip
gage as a function of its output voltage.
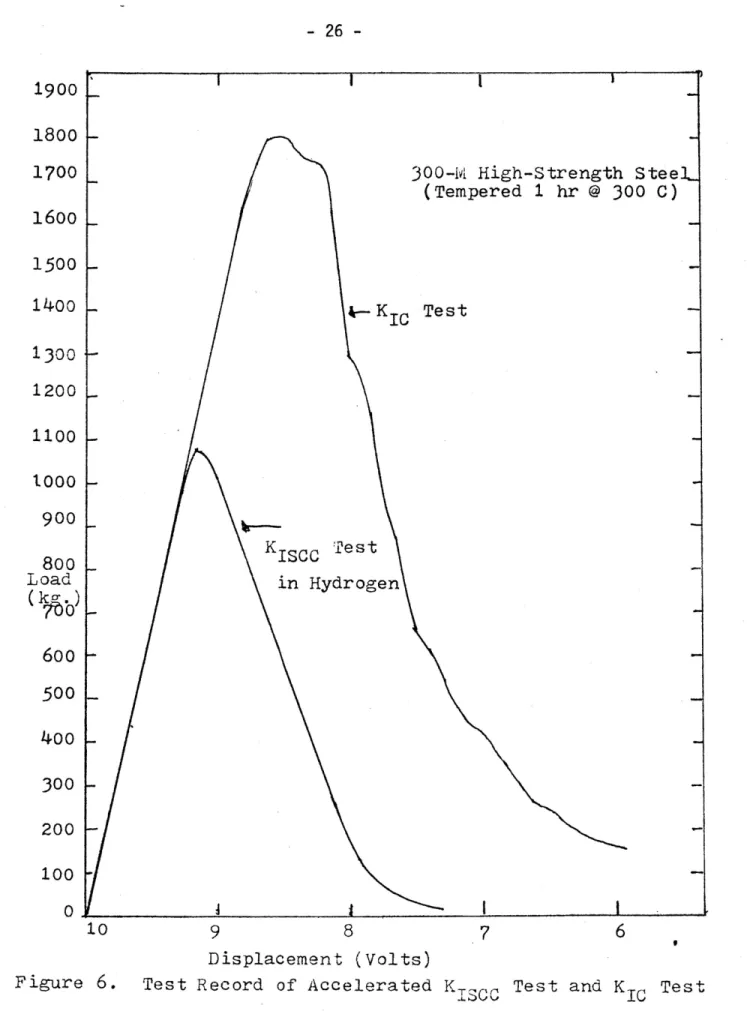
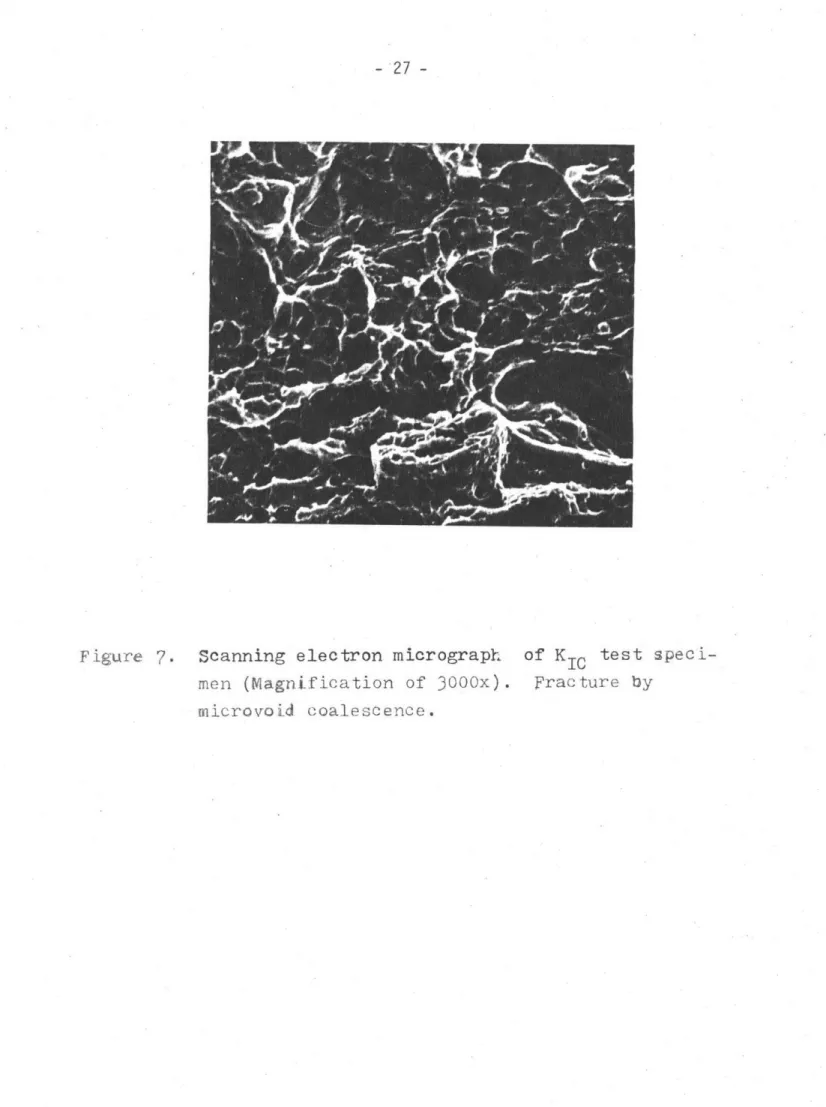
Figure 6 shows the Kic test record. Kic was calculated
according to Sec. 2.6; calculations are in Appendix B. Kic was found to 62.9 MPavm(57.2 ksiv/in). Fracture was by microvoid
coalescence (Fig. 7).
For the first rising load test in gaseous hydrogen, the load was ramped so that the stress intensity would range approxi-mately from 0 to K;. in 10 min. (K = 6.5 MPavm/min. =
5.9 ksiv/in/min). Examination of the fracture surface showed very little intergranular cleavage, suggesting that the hydrogen did
Monotonic Yield Stress =~ 1737 MPa
U.T.S. - 2005 MPa
To Elong.’ - 12
1. Measured on 25.4% mm gauge length
-- Ea
Table 3. Test Specimen Dimensions
- S cin n ’ ~t tot im
| Rig Spe Hen Bsc Specimen
47 in. Lb? in
2 .975 in. .983 in. J 1.969 in. 1.969 in.
Dispiacenent Thitzas Dispiacement Voltage
(in.) Jin. Li -10.01 , 283 -3.49.193 -9.65 .288 -3.16
.198 -9.28 «293 -2.83
203 -8.93 «298 -2.52
.208 -3.58 .303 -2.18 .213 -3.24 . 308 *.85 .218 -7.90 313 :. 58 2273 -7.55 .318 -1.28 228 -7.20 .323 -1.00 2373 -5.85 .328 -0.98.238 -6.51
L243 -6.16
20.8 -5.82
257 - 5.48 .258 -5.142673 ~-4,80
+268 bi 277 Ll 278 - 3,81 LBS . uti aA - "0) _
1900 | |
1800 }- |
1700 | 300-ii High-Strength Steel
(Tempered 1 hr @ 300 C)
1600 |
1500 id 1400 +— Ky; Test1300
1200 | : 1100 11000
f-900 |
xX Test 800 | ISCC |a in Hydrogen)
CRS.700’ |
600 + —~500 L
400 L
300 I
web |
too Co
ok
Displacement (Volts)
Figure 7. Scanning electron micrograph of K1c test
speci-men (Magnification of 3000x). Fracture by microvoid coalescence.
The second test was run over a longer period of time; the
load was ramped so that the stress intensity would range
approxi-mately from O to Kia over a period of 1 hr.,
k = 1,1 MPa¥fi/min (1.0 ksiJin/min). The specimen was placed in
the hydrogen environment for 1 hr. before loading. Examination of
the fracture surface showed that the fracture mechanism was
inter-granular throughout (Fig. 8).
Figure 6 shows the test record for the second test in hydro-gen with the fracture toughness test record. This illustrates the
effect of hydrogen decreasing the threshold stress intensity at
which crack growth will occur.
saa was calculated according to Sec. 2.8. Calculations are shown in Appendix C. Ki... Was found to be 34.4 MPaim
(31.1 ksifin). Krgoo at @ static load for 100 hrs. in distilled was found to be 18.6 MPafm (2). A small difference between Ks soc in gaseous hydrogen and KIsco in distilled water was expected, however, the difference between these values is large enough to suggest that the rising load X1s0c test procedure overestimated
Ks for gaseous hydrogen.
Clark and Landes (1976), in evaluating rising load K;..q tosting in gaseous hydrogen, showed that the rising load K;... value varies with the loading rate, K. (14)
Figure 8. Scanning electron micrograph of rising load Kise
Test specimen (magnification of 1000x)
Fracture by intergranular cleavage along prior-austenile grain boundaries.
Figure 9 shows that for a slower K a lower Kisce may be obtained. For the steel used in this project it would be advantageous to run
a rising load Kisco tests at a K of 0.1 MPavm/min (0.1 ksivin/min)
to see how much Kisce varies with loading rate.
Rising load Kisce data may also vary with temperature and
hydrogen gas pressure (14). This dependence will not be considered here since both the cyclic crack growth data and the monotonic crack growth data, to be used in the superposition model, were taken at the same temperature and pressure as the rising load Kisce test.
The rising Toad Kic.. (measured with K = 1.1 MPavm/min = 1.0 ksivin/min) will be used as an approximation for Kisce in
the superposition model. A rising load K;c.. at a Tower K
%
C
x : Qa. a. _4o =. Long Time Test KIsce = 26 to 34 wet Tin
7 10
1 A.SA
Loading Rate, K, ksijin/min
Figure 9. Effect of Loading Rate on Apparent Krece (14)
CHAPTER 3: THE SUPERPOSITION MODEL FOR HIGH-STRENGTH STEELS
3.1 Wei and Landes Superposition Model
The dominant mechanism of corrosion fatigue is governed by whether the cyclic stress intensity level is above or below the
threshold stress intensity value for hydrogen-induced crack growth
under static load, and by the stress ratio and cyclic frequency
em-ployed during the testing (11). Wei and Landes superposition model applies when the cyclic stress intensity exceeds Kisees A model
that also applies to stress intensities less than Kisce is the
Process Competition Model, (11).
The superposition model seeks to comprehensively treat
en-vironmentally enhanced crack growth under sustained load, "stress
corrosion cracking", as well as cyclic loading, "corrosion fatigue", as the same problem. Studies by Johnson, Hancock, and Wilner (5,6) suggest that the fracture mechanism is the same in both stress corrosion cracking and corrosion fatigue. They looked at the pre-dominant paths of fracture in a 18 Ni (250) maraging steel tested in dehumidified hydrogen and found them to be the same for both sustained load and cyclic load. While the cycling frequency was found to
affect the crack growth curve of this steel in hydrogen, it had no
effect in argon (an inert environment) (3). This evidence suggests
the frequency effect is due to the hydrogen environment, rather than
As a first approximation, the cyclic crack growth rate in hydrogen is considered to be the algebraic sum of these two compo-nents. The mechanical component is the fatigue crack growth in the absence of a corrosive environment. It is determined experimentally by running a cyclic test in an inert environment. Wei suggests that the environmental component may be determined from experimental
crack growth data under sustained loading in the appropriate environ-ment and the fatigue load profile would incorporate both the loading
variables (mean load, load amplitude, and wave form), and frequency.
Testing time would be considerably shortened if the accelerated
method of finding Kisce would be sufficient to determine the environ-mental contribution.
Figure 10 shows a typical crack growth for a high-strength steel in air, and an expected crack growth curve of a high-strength steel in hydrogen. The sharp acceleration in crack growth is
thought to be due to the environmental contribution. This region of accelerated growth varies with the frequency and with the load ratio. Figure 11 shows the factors that affect the hydrogen tribution to fatigue crack growth. If the environmental
con-tribution could be determined, then the cyclic crack growth curve in
AIR (ys HYDROGEN
da
dN L } MRan | Hydrogen Gas
.SC3
Ww on
,— Air (independent of Frequency)
Figure 11. Schematic Diagram Showing Regimes of Hydrogen-Assisted Growth. (4)
AKwhere.
Figure 12 is a graphical presentation explaining how fre-quency and load ratio vary the amount of environmental contribution. Assuming that the crack length, a, is constant over one cycle, then the stress intensity factor varies linearly with the load (K is
proportional to the load, P, and the crack length, a). Figure 12a
shows the stress intensity over one cycle. Figure 12b shows a mono-tonic crack growth curve in hydrogen. Those portions of the loading
cycle above Kisee contribute to crack growth. Figure 12c shows the
environmental contribution to crack growth per cycle. Integration over time gives the environmental contribution. Figure 12d shows the superposition of the mechanical contribution and the environmental contribution.
3.2 Using the Accelerated Kisce Test to Find the Environmental
Contribution to the Superposition Curve
Figure 13 depicts the stress intensity varying sinusoidally
with time. At stress intensities above Kisce the crack will grow by
stress corrosion caused by the environment. To determine the time per cyclé, T, that K exceeds Kisce: K is expressed as a function of time,
K(t) = Kio + aK/2 + aK/2 cos [(2nf)t] .)
= frequency (cps)
| Kisco! —
) wt log da/dt
. D.. LLI0rn
mental | Air (cyclic)
. Contris, .
da/dt | bution ; log Kix
,wrogen
(cyclic)
oo T “logaa/BN
Figure 12. Schematic diagram illustrating the suggested
method of analysis. (a) stress intensity
spectrum in fatigue (top left); (b) rate of
crack growth under sustained load in aggressive
environment (top right); (c) environmental
contribution to crack growth in fatigue (bottom left); and (4d) integrated effects of
9
K *
Bay f |
150C te,
Kin
tf ra 1% ahere, (5 ge Lee
Substituting K(b) into Eg. 3:
Kisce = Kip + AK/2 + AK/2 cos(2xfb) | 2
The total time per cycle, T, where K > Kise is equal to 2b. Solving
Eq. 5 for 2b = T:
_ 1
-T = 1/af cos~[2/AK(Kisee-Kin-AK/2)]2)
The load ratio, R, is defined as the ratio of Kain to Knax®
~ (
R Kin’ Knax 7.)
He.
Knax = the maximum stress intensity of the cycle.
The alternating stress intensity amplitude, AK, is
A = Kinax = Kin oo)
Manipulating Eqs. 7 and 8 yields,
Knax = AK/(1-R) ‘a.
= - h
Substituting Kin into Eq. 6,
T = 1/nf, {cos™ 2 [Kiepo/BK = (mom + 2)1} (10.) > ISCC T-R 2 oe
Table 5 lists T as a function of AK for f = 50 Hz at R=0.05, and
Table 6 for R=0.30.
Figure 14 shows Simmons, Pao, and Wei's (1978) sustained-load
crack growth data for a 4340 steel (oy = 1344 MPa = 195 ksi) in de-humidified hydrogen gas (Pus = 133 kPa = 19 psi). As discussed in Sec. 2.7, the 300-M steel is slightly more resistant to Stage II crack growth than AISI 4340. From Figure 14 it can be seen that for stress intensities greater than the threshold stress intensity, the
crack growth rate, da/dt, always exceeds 1074 mm/sec. A mean value
of the sustained load crack growth is approximately 8 x 10⁷% mm/sec. ,
with the minimum crack growth data being 4 x 1072 mm/sec.
To estimate the total environmental contribution to the
fatigue crack growth rate per cycle, da/dN, the time per cycle, T, (K > Kisce) is multiplied by the mean sustained crack growth rate,
da/dt = 8x 10⁷% mm/sec, to obtain da/dN:
da/dN = T x da/dt (11.)
Calculated values of da/dN due to the environment are also listed in Tables 5 and 6.
260 020C
tT ” da/dN T da/dN
"Mpa fm) (sec) (mm/cycle) ‘sec) (oo oe )
20 . 0046 3.6L ~ 107" 2° .0075 6.00 x 10⁷ 30 | .0091 7.31 x 10⁷% 25 | L003 2.72 x 10⁷ .0103 8.21 x 10⁷%
40 | . 0058 4,62 107% 0111 8.90 x 10⁷%
bs | .0072 5.77 x 10⁷% .0118 9.44 x 1075 | .0083 6.60 x 10⁷ .oizh 9.88 x 10⁷
55 0.0091 7.25 x 10⁷° 0128 1.03 x 10⁷°
60 | . 0097 7.79 x TO 0132 1.06 x 10⁷°6c | .0103 8.2k x 107 013% 1.09 x 10⁷
70 | .0108 8.62 x 10⁷ 0139 1.11 x 1072 ve 0112 8.9% x 107 olh2 1.13 x 1073 80 0116 9.26 x TO ,0144 1.15 x 10⁷°| 0 160x100 y 1.60 x 10⁷° |
Table 5. T as f(AK) for KXX , R=0.05, f=50Hz, and
Jz Oh . 0200
Acs. hrgay = 34.4 Mpain Side ~ qq = 18.6Mpalm
Te when AK=24, 1Mpa /m Kov Brsce when AK=13.0¥pala
TL when A K=80, 3Mpa JT Kyo = Krggg When AK=43,4Mpa/m |
Using The Acc. K1sce Using The Std. Kisco
(Hoa B (Lec ) (und2He ) {edu ) (Sajal 1 )
TTT 005% TESI0.,
‘° .0100 “2 10zn .0030 2.37 x 10⁷% .0124 9.93 x 10⁷%
29 | ,0071 5.71 x 10⁷% 0142 1.14 x 1073 =r ,0093 7.45 x 10⁷% .0159 1.27 x 1073 Wy .0109 8.71 x 10⁷% .0176 1.41 x 1073 re 4 ,0121 9.71 x 10⁷% ar 0132 1.06 x 10⁷° - ,0142 1.17 x 1073 60. .0150 1.20 x 10⁷° = .0159 1.2% x 107° pn . ,0168 1.7 x 1077 ce. 0178 1. = 1070 80 .0196 1,8 + 107°| #200 1.60 x 1073 ; 1.60 x 10⁷°
: |Table 6. T as £{(AK) for KOK , R=0,30, f=50Hz, and
a
, 2 | ) !» {
41 | " “ -ro £ AISI A340 . or DsPo oa
: Temp = 22°C: 2 |
- | <1072 | L Ll
30 40 50 60 70 80 Stress Intensity Factor (Mpa m)Figure 14. Sustained-load Crack Growth in AISI 4340 Steel
( tempered at 204°C) in dehumidified Hydrogen
5.2 Results and Discussion of Using the Accelerated Kisce in the
Superposition oo
Figure 15 shows the cyclic crack growth data in air and hydro-gen gas for 300-M, tempered at 300°C, at a frequency of 50 Hz and load ratio, R, of 0.05. Figure 16 is the cyclic crack growth data
for a load ratio of 0.30 in gaseous hydrogen. It can be seen from
Figures 15 and 16 that, except for initiation, the data in hydrogen does not differ significantly from that of air, for AK less than 8MPavm (7.3 ksiv/in). Figures 17 and 18 show the crack growth curves estimated from the superposition model for alternating stress
in-tensities greater than 8 mPavm. The rising load Kisce values, when
used in the superposition model, predict the onset of stress cor-rosion cracking at higher AK's than in the data (Figures 15 and 16).
The standard method Kisce value, when used in the superposition model.
better estimates the onset of stress corrosion cracking but, as with
the rising load Kisce value, it does not accurately predict the
magnitude of the crack growth rates.
Ritchie showed that the sustained-load crack growth rates in water of 300-M were lower than those of AISI 4340 by approximately
a factor of 10, though both materials were of equal yield strength (2). This suggests that to evaluate the applicability of the superposition model for 300-M, tempered at 300°C, sustained load crack growth
; Be I 2h : i ur i ~ +? v
L 107% A &
3 i #1 Ho. . = ) 7 Rr a 1076 - A— gE
of = _— =& 1077 ¥
be ji g = «a 2 iy 2 6 7 8 10 ) ’Alternating Stress Intensity
Figure 15. Cyclic Crack Growth Data For R=0.05 AK (MPafm)
~ Austenized at 870°C, oil quenched and tempered @ 300°C eo °° 7
: " Environment: dry hydrogen (138kPa pressure) at 23° © 4
: Frequency: 50Hz wn 5 ‘ - R = 0.05 LF H i -— R = 34 0 Bo E 10 4 J Co f— AE = ~ | Cw an’ r g. oP - - Sone -5 5 4 3 10 — . % a4 Z ws Cow r _ 9 5a — R=0.30= ;
f 0% F
| iY R=0.,05 etd— % L i— © bo § Qn + w - =oo - . Threshold Kg
od yl
5 6 7 8 9 10 20 23 2Alternating Stress Intensity, AK (Mpaim)
Figure 16. Cyclic Crack Growth Data for R=0.30
" ie
107° _
= Superposition Curve JE
nil a Fi
(Using Std. Kroon) Loe
- 3 Gc 5 v o “lf ~ . KE
10 = he LLIN Superposition Curve
. |
- a (using Acc Brean)!
Hay
©)
z | : -5 wo —! ge 10 ~ = Environmental Env. Cont.
E % Bogus Contribution (Ace. Kiann)
Fe (Std. Konnn)
oo “+ ICC S710° |
& po . rj Cyclic Data in H, , R= 0.05: a 7 Cyclic Data in air, R= 0,05
oy 1077 »
© -8 = o — wd — 0 =& 8 |
AO | ed cep) _ Ee 7 8 9 10 25 30 3Alternating Stress Intensity &K(Mpa[m)
Lh 0 —_— ¢ Superposition Curve
B 3 (Using std. Kran?
i nl E § ov © a 9 - a 3 3 — 7 VV ’. Superposition
aa wi Curve (usingAcc. Kpgna)
Sol
= [bs «Env. Cont. : - Environmental
: (std. Krams) iy
- | KIsce
5 1078 V Cyclic Data in Air, R=0.05
«nt i© Cyclic Data in H, y B=0.30
57
1078 | | [i |
y & 9 10 20 30 50
Alternating Stress Intensity AK(MPa ii)
hydrogen (Phyo = 138 kPa = 20 psig), for a 300-M ultrahigh-strength steel, tempered for 1 hr. at 300°C. This estimate was evaluated for use in the superposition model to predict the fatigue crack growth curves in a gaseous hydrogen environment. The Kisce was estimated to be 34.4MPavm(31.3ksivin). From this study the
following conclusions can be made:
| The rising 10ad Kigee test (kK = 1.1MPavii/min =
1.0ksiv/in/min) overestimated the Kisce (as determined
by the standard method) by 85%.
¢«. The estimated Kiscc did not adequately predict the cyclic crack growth curve in gaseous hydrogen of 300-M, tempered at 300°C, for load ratios of 0.05 and 0.30 at a cycling frequency of 50 Hz.
3. In the superposition model, the standard, static-load Kisce value predicted the onset of stress corrosion
cracking, but did not accurately predict the increase in crack growth rates for a load ratio of 0.05.
? The model might better predict the crack growth curves
(a) the rising load Kisce test was performed at
a lower loading rate; perhaps K = 0.1 MPavm/min.
(b) sustained load crack growth curves were obtained of 300-M (tempered at 300°C) in gaseous hydrogen.
"Ritchie, R.0,, Cedeno, M.H,, Zackay V,F., & Parker, E.R.,
"Effects of Silicon Additions and Retained Austenite on Stress
Corrosion Cracking in Ultrahigh Strength Steels", Met, Trans.,
Vol, 9A, Jan, 78, p. 35.
© Wei, R.P., & Landes, J.D,, "Correlation Between
Sustained-Load and Fatigue Crack Growth in High-Strength Steels", Mat. Res. & Stds., July 1969, p. 25,
"Hertzberg, R.W., Deformation andFracture Mechanics of
EngineeringMaterials, p. 382,
* Johnson, H,H., & Wilner, A.M., "Moisture and Stable Crack Growth
in a High Strength Steel, "Applied Materials Research, Vol. 4,
1965, p. 34,
& Hancock, G.G., & Johnson, H,H,, "Hydrogen, Oxygen, and Sub-Critical Crack Growth in a High Strength Steel”, Transactions,
Metallurgical Soc., Institute Mining, Metallurgical,& Petroleum
Engrs., April 1966,
Ritchie, R.0., "Near-Threshold Fatigue Crack Propagation in
Ultra-High Strength Steel: Influence of Load Ratio and Cyclic
Strength, J. of Engr. Materials& Technology, July 77, Vol. 99,
p., 195.
£ Toplosky, J., "On Fatigue Crack Growth of Short Cracks in 300-M
Ultra-High Strength Steel", S.B. Thesis, Mech. Engr. Dept.,
M.I.T., June 1979.
: Suresh, S., Moss, C.M., & Ritchie, R.0., "Hydrogen-Assisted
Fatigue Crack Growth in 2 1/4-Cr-1Mo Low Strength Steel",
Proceeding of Second Int'l Japan Inst. of Metals Symposium on
Hydrogen (JIMIS-2) Minakami Spa, Japan, Nov. 26-29, 1979.
1% Ritchie, R.0., "Influence of Impurity Segregation on Temper
Embrittiement and on Slow Fatigue Crack Growth and Threshold
Behavior in 300-M High Strength Steel"., Metal. Trans. A, Vol. 8A, July 77, p. 1131.
11. Austen, I.M,, & McIntrye, P., "Corrosion Fatigue of
High-Strength Steel in Low-Pressure Hydrogen Gas", Met. Sci,,
July 1979, p, 420,
12, Gerberich, W.W., & Chen, Y.T., "Hydrogen-Controlled Cracking
An Approach to Threshold Stress Intensity", Metal. Trans. A, Vol. 6A, Feb, 1975, p, 271.
13. Broek, D., Elementary Engineering Fracture Mechanics, Sijthoff &
Noordhoff, The Netherlands, 1973, p. 62.
14. Clark, W.G,, & Landes, J.D., “An Evaluation of Rising Load
K Testing", ASTM STP 610, 1976, p. 108,ISCC
15. Simmons, G.W., Pao, P.S., & Wei, R.P., "Fracture Mechanics and Surface Chemistry Studies of Subcritical Crack Growth In AISI
Ly ds w
fe o= 1, Lu " y
9. or
a/y | f(a/w) z #4] f(a/W)
0.450 8.34 n.505 9.75 0.455 8.45 0.510 9.90 0.460 8.57 0.515 10.05 0.465 8.69 0.520 10.21 0.470 8.81 0.525 10.37 0.475 8.93 0.530 10.54 0.480 9.06 0.535 10.71 0.485 9.19 0.540 10.89 0.490 9.33 0.545 11.07 0.495 9.46 0.550 11.26 0.500 © en
Lyd
APPENDIX B: CALCULATION OF Kic
1. Calculation of P
_ ——Q
The slope of the tangent to the initial linear portion of the load-displacement curve of Figure 6 is 1.39,
(P/V), = 1.39
Section 2.6.1 gives the relationship,
(P/V)g = .95(P/V) = .95(1.39) = 1.32
The intersection of the tangent line with the load-displacement
curve is at P = 1800kg. The load displacement curve is a Type I
curve (Fig. 5), therefore,
Pe = Pq = 1800kg = 396910
Checking to see if the test is valid;
Prax’ Pq = 1850kg/1800kg = 1.03 < 1.10,
therefore, the test is valid according to Section 2.6.2.
2. Calculation of Kic
Substituting the specimen dimensions in Table 3 and the
£(.495) = 9.51 .
From Eq. 2,
Kie = [Py/8H' 72] f(a/W) = [3968(1b)/(.47in)(1.969in)/2](9.51)
APPENDIX C: CALCULATION OF Kisce
From the load-displacement record of Figure 6, the load
at which the Kisce curve deviates from the Kic record is,
Pa = 980 kg = 2156 1b
Using the dimensions in Table 3 to find f(a/W) in Appendix C,
f(a/W) = £(.983in/1.968in) = f(.499)
Interpolating from the values in Appendix A,
f(a/W) = 9.57
From Eq. 2 Kisee is found to be,
- ; . 11/2
Kisce = [2156 1b/(0.47in)(1.968in)''~] (9.57)