Profiling food consumption :
comparison between USA and EU
Duquesne, B., Matendo, S., Lebailly, Ph.
Food Consumption ObservatoryDepartment of Economics and rural development Gembloux Agricultural University
B - 5030 Gembloux (Belgium)
[email protected] , [email protected] , [email protected]
Abstract: Today, consumer demand is a governing force of agricultural production and the agri-food industry. Faced with the globalisation of the foodstuff trade, differences in consumers’ preferences throughout the world have to be taken into account. The objective of this study is to compare, on the basis of sources of available data, food consumption habits in the USA and in Belgium, a country that proves to be a good indicator of European food consumption since most data concerning it correspond to the average of the Europe of the 15.
The analysis comprises, on the one hand, the trend of food consumption over the last fifty years and, on the other hand, the current share of food spending in the household budget together with the socioeconomic determinants likely to have an impact on expenditure.
Keywords: Food Consumption, Demand, Consumer Expenditures
1. Introduction
At the beginning of the 21st century, the law of demand is supplanting the law of supply in food
production. Today, the organisation of agriculture and the agri-food industry must come up to consumers’ expectations.
A corollary of fast economic growth is that more stringent demand from consumers is emerging in many regions of the world. They demand an increasingly varied range of high-quality food together with food safety assurance. In addition to ethical concerns about production and environmental impacts, consumers also require that food should be quick and easy to prepare.
Recent health crises (BSE, bird flu, etc.) show the need to take a fresh look at the organisation of agricultural production systems. Likewise, the emergence of obesity and diseases related to unhealthy food habits cannot be overlooked by agri-food industry leaders and politicians.
Faced with rapid changes in consumers’ food behaviour patterns and, considering their impact on production systems, it is important to have tools capable of analysing food consumption trends.
The Belgian Food Consumption Observatory was set up in 2003 with this outlook in mind and its tasks precisely involve collecting and analysing information concerning food consumption so as to clarify consumer behaviours and determine market trends.1
2. Data sources
Available sources of information are decisive factors in the analysis of food product consumption. The food consumption trend in the USA and in Belgium from 1955 to 2004 will be studied on the basis of the Supply balances while the analysis of household food purchases will be carried out according to the 2004 Surveys into Household Budgets specific to each of the countries. The interpretation of findings should be considered distinctly depending on whether they come from an approach based on supply balances or they are drawn up from a panel.
2.1. Supply balances
The supply balances of basic agricultural products are drawn up on a yearly basis for each Member State of the EU by the European Statistics Office (EUROSTAT). For the USA, all the data come from the United States Department of Agriculture (USDA): Economic Research Service (ERS), Food Consumption (Per Capita) Data System (known also by the name of “Food Availability”, or “Disappearance Data”).2
This type of statistics, based on the estimation of the quantities produced on the national territory together with the balance of foreign trade, provides an estimate of the quantities apparently consumed per capita and per year. The qualifier “apparent” comes from the fact that it is an estimate concerning quantities of raw materials in the rough state which are not necessarily directly consumed by the population but enter – partly or wholly, according to the products – into the agri-food chain. Consequently, consumption data taken from supply balances are mainly used to observe the overall trend during the time when the basic agricultural products are being used and are also a way to make spatial comparisons.
2.2. The household budget survey
The Belgian National Institute of Statistics (INS) has a panel of consumers for conducting the household budget survey (EBM). The quantitative study of food consumption based on the household budget surveys conducted by the INS from 1999 concerns approximately 400 headings. Every month, the INS questions a sample of about 300 households exhaustively.
The main objective of this survey, which became an annual one from 1999, is to provide data about the average annual budget per capita or per household to the Ministry of Economic Affairs in charge of calculating the consumer price index so as to work out the weighting of the sample products composing the basket of this index.
The standardisation of the household budget survey (EBM) according to the recommendations by the European Statistics Office (EUROSTAT) further makes it possible to establish comparisons between the different Member States and over the long term.
In the USA, data about household spending (consumer units) come from the “U.S. Department of Labor - Bureau of Labor Statistics” (BLS), Consumer Expenditure Survey (CE). The CE is composed of two separate sections. The first sectionis a quarterly survey by panel using interviews to collect most of the data about household spending for items such as rent, transport, buying a car, insurance, medical care, education, (mainly major items of expenditure that people can remember after 3 months or more). The second section is a diary survey making it possible to collect detailed daily data mainly concerning everyday expenditure (food and drinks, both at home and away from home; household cleaning articles, personal care products and services, etc.). Even if, for each of these sections, a separate questionnaire and sample are used, the data from both surveys are subsequently integrated and are used in many research areas (business, labor, academic ...) and for the revision of the Consumer Price Index (CPI). These integrated data form the data supplied by the Bureau of Labor Statistics.3
3. Food Consumption Trend
Over a long period, the analysis of the combined effects of nutritional and economic constraints makes it possible to account for the trend of the level and of the structure of food consumption in most developed countries4.
As soon as income and supply constraints allow it, the trend of food consumption in these countries is characterised by three distinct phases: a phase of quantitative growth of consumption of all foods up to a calorie saturation level, then a phase of evolution of the structure of the ration (nutritional transition), and lastly a phase of stationarity of energy intakes and widespread food differentiation.5
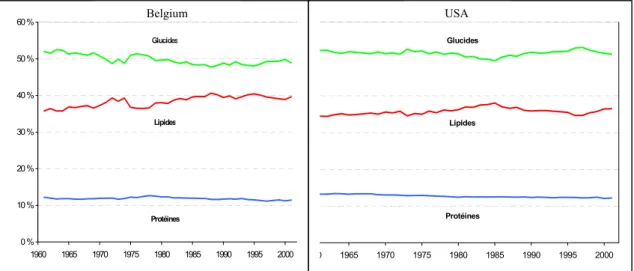
The period from 1955 to 2004 belongs to the stationarity phase since, in Belgium as in the USA, the nutritional transition has been completed since the beginning of that period (Figure 1). If the protein fraction is appreciably the same, a larger share of lipids is noted in Europe and of glucides in the United States.6
Figure 1: Trend of the energy intake structure Source: FAO
The food trend, in the last five decades, is reflected in very pronounced and almost identical changes in many European countries.
With higher quantities consumed both at the beginning and at the end of the period in the United States, the trend of consumption is comparable to the situation in Belgium, namely an increase in the total consumption of meat and a decrease in the total consumption of milk. (Figure 2)
0 % 10 % 20 % 30 % 40 % 50 % 60 % 1960 1965 1970 1975 1980 1985 1990 1995 2000 Protéines Lipides Glucides 0 1965 1970 1975 1980 1985 1990 1995 2000 Protéines Lipides Glucides Belgium USA
56 99 102 97 59 128 122 126 93 83 141 141 128 178 0 20 40 60 80 100 120 140 160 180 200 1955 1960 1965 1970 1975 1980 1985 1990 1995 2000 2004 Beverage milk(B) Meat(B) Total dairy products(B) Meat(US) Beverage milk(US) Total dairy products(US)
Figure 2 – Trend of total consumption of meat and dairy products in Belgium and in the United States Source: Supply balances - INS-Belgium- USDA (ERS)
3.1. Trend of meat consumption from 1955 to 2004
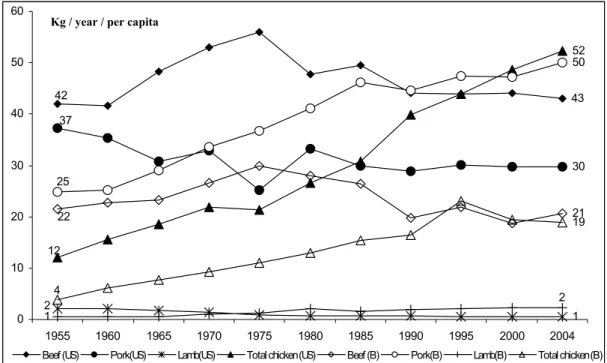
In a half century, the largest rise in consumption is undeniably the rise in meat consumption. (figure 3) Meat consumption increased by 35% in the USA to reach 126 kg in 2004.
This trend was very pronounced in the first half of the period under consideration in Belgium where meat consumption increased by over 50%, and this upward tendency subsequently continued to reach a consumption of 102kg of meat in 2004 (+ 72% compared with 1955) 7
The different kinds of meat consumed experienced different trends both in Belgium and in the USA. Fifty years ago, beef ranked in first position in the USA with a consumption of 42 kg per capita per year. Poultry consumption has overtaken beef consumption and the Americans eat about 10 kg more poultry than the 43 kg of beef currently consumed.
Belgians only consume 20 kg of beef, half the amount of US consumption, but the trend is however the same on both sides.
Over the entire period under consideration, beef consumption has hardly changed at all since, after an increase in the course of the first half, it sagged from the end of the seventies and since the nineties has been wavering around a quantity similar to the amount consumed in 1955.
The rise in poultry consumption is more spectacular since it has increased fivefold in Belgium, rising from 4 kg per capita per year in 1955 to 20 kg per capita per year in 2004 and ranks alongside beef with the same relative share. In the USA, poultry ranks first, with quantities rising from 12 kg in 1955 to 52 kg today.
In Belgium, pork consumption comes in first position, with 50 kg per capita per year. It has doubled in Belgium whereas pork consumption has declined by 20% in the USA in a half century.
As for mutton and lamb, it followed a reverse trend on either side, currently reaching 2 kg in Belgium, which was the quantity consumed in the USA in 1955, but which has fallen by half since then.
42 43 30 37 2 1 12 52 22 21 25 50 2 1 19 4 0 10 20 30 40 50 60 1955 1960 1965 1970 1975 1980 1985 1990 1995 2000 2004
Beef (US) Pork(US) Lamb(US) Total chicken (US) Beef (B) Pork(B) Lamb(B) Total chicken (B)
Figure 3 – Trend of meat consumption from 1955 to 2004 in Belgium and in the United States
Source: Supply balances - INS-Belgium- USDA (ERS)
3.2. Trend of consumption of dairy products from 1955 to 2004
If the consumption of dairy products is considered as a whole, it is, in 2004, the same on the other side of the Atlantic as in Belgium: 128kg per capita per year; which was not the case 50 years earlier, when US consumption was 28% higher, whereas Belgian consumption remained steady throughout the period. In the USA, the quantity of milk consumed for drinking has decreased by 41% in a half century and is now only 83kg (2004). The same drop is recorded in Belgium (-43%) and the country’s annual per capita consumption is now only 56 kg.
Among dairy products, the amount of cheeses consumed per capita per year, which is the same in Belgium and in the USA, has trebled, on both sides, in a half century, to reach 15kg at the present time. (Figure 4)
The considerable consumption of fresh dairy produce by the Americans (12 kg) remained steady over the period under consideration, while in Belgium, their consumption currently attains 8 kg, even though these types of products were practically not eaten 50 years ago.
Yogurts underwent an even more remarkable increase and today attain 14 kg in Belgium. This rise in consumption is less significant in the USA since US consumption is still only 4kg per capita per year. Butter was a major consumer product in the fifties, with over 10 kg, but consumption has steadily declined since then and the amount consumed has decreased by half. The quantity consumed, with 5 kg per capita per year, is nevertheless more than twice the US consumption figure (2kg), which has also fallen by half over the period under consideration.
4 0 12 11 2 4 15 5 14 1 0 8 5 11 5 0 2 4 6 8 10 12 14 16 18 1955 1960 1965 1970 1975 1980 1985 1990 1995 2000 2004
Yogurt (US) Frozen dairy (US) Butter (US) Cheese(US) Yogurt (B)
Figure 4 – Trend of consumption of dairy products in Belgium and in the United States Source: Supply balances- INS-Belgium- USDA (ERS)
3.3. Trend of consumption of products of plant origin from 1970 to 2004
Since US data concerning the consumption of food of vegetable origin have only been available since 1970, comparison with Belgian consumption will be made for the period 1970-2004. (Figure 5)
Cereal consumption, namely wheat flour, maize, oats, barley and rye, excluding rice, is currently in the region of 78 kg both in the USA and in Belgium. Nevertheless, these last 20 years, the increase has been more significant in the USA (+ 32% versus 12% in Belgium.)
Potatoes are traditionally an important food item in Belgium. Consumption has however registered a decrease of 25% since 1970, whereas it has increased by some 10% in the USA, even if today it is clearly higher than US consumption, with 85 kg per capita per year compared with 61kg in the USA, where it has increased by about 10%.
Consumption of both fruit and vegetables has considerably increased in Belgium in recent years, rising from 70kg in 1970 to 100kg at the present time.
In the USA, if after a same increase of 30% over the period under consideration, the annual per capita quantity of vegetables currently reaches 130 kg, fruit consumption, with 70kg, remains distinctly lower.
58 78 79 85 115 61 55 100 70 131 98 99 78 72 64 40,0 50,0 60,0 70,0 80,0 90,0 100,0 110,0 120,0 130,0 140,0 1970 1975 1980 1985 1990 1995 2000 2004
cereals (US) cereals (B) potatoes (B) potatoes (US) vegetables (B) vegetables US) fruits(B) fruits(US)
Figure 5 – Trend of consumption of products of plant origin in Belgium and in the United States
Source: Supply balances - INS-Belgium – USDA (ERS)
4. Household Spending.
4.1. Share of food spending in the budget.
In 2004, an American household spent € 34,933 on average, whereas the total expenditure for a Belgian household amounted to € 30,655.
If average household income is taken into consideration, namely € 43,835 in the USA and € 35,165 in Belgium, the € 4,654 spent by American households represent 10% of their income while the € 5,617 spent by the Belgians account for 16%.
The share of total spending devoted to food at home and away from home therefore accounts for 13.3% in the United States and 18.3% in Belgium.
Forty-two per cent (42%) of the American food budget is spent away from home. Belgians devote more of their food expenditure to home consumption (74%).
4.2. Structure of food spending at home
Tool food expenditure at home is, on average, 54% higher in Belgium than in the USA.
The breakdown of the different expenditure is indicated in table 1. Except for purchases of fats and oils, the amounts spent are always higher in Belgium, with a slightly less significant difference for fruit and meat (+15 % and + 41 % respectively).
Table 1. Average household food expenditure at home (2004) Source: EBM (INS, Belgium) -CE (BLS, USA)
USA Belgium
Item Average expenditure
Cereals and bakery 371 € 655 €
Meats, poultry, fish and eggs 708 € 1,001 € Dairy products 299 € 502 €
Fruits 239 € 276 €
Vegetables 213 € 351 €
Sugar and other sweets 103 € 263 €
Fats and oils 72 € 61 €
Miscellaneous foods 424 € 642 €
Nonalcoholic beverages 233 € 403 €
Food at home 2,695 € 4,155 €
In terms of relative shares of expenditure of each group of products in the total food budget at home, the structure of Belgian or US household expenditure is fairly comparable. (Figure 6).
Nonalcoholic beverages (US:9%-B:10%) Miscellaneous foods
(US:16%-B:15%)
Fats and oils (US:3%-B:1%) Sugar and other
sweets (US:4%-B:6%) Vegetables (US:8%-B:8%) Fruits (US:9%-B:7%) Dairy products (US:11%-B:12%)
Cereals and bakery (US:14%-B:16%)
Meats, poultry, fish and eggs (US:26%-B:25%)
Figure 6. Structure of the food budget at home (2004)
4.3. Socioeconomic determinants
Household budget surveys, through the different descriptive characteristics such as age, socio-professional category, available income, educational level, or household composition, are a way to identify the effects of these factors on food behaviour patterns.
The analysis of these data makes it possible to envisage the hypothesis of a “typology” of consumers, while bearing in mind that interactions exist between the different factors. The difficulty of interpretation comes from the fact that a good many of these factors can be positively correlated: for instance, there may be a correlation between income and educational level and/or age. Consequently, it will not be a question of establishing the specific impact of an isolated factor on the consumption of a type of food but of suggesting trends within changing demand according to the characteristics observed.
The importance of determinants such as the income or the age of the person responsible for household buying on food expenditure will be analysed in the light of the characteristics specified in national household budget surveys.
The share of food expenditure in the total household budget differs according to the income quintiles. (Figure 7).
In Belgium, where the share devoted to food at home is distinctly higher, few income-related differences are noticed apart from a share devoted to food at home below 1% for the highest incomes and below 1% for eating away from home for the lowest incomes.
In the United States, by contrast, the share of the budget devoted to food at home decreases sharply as income increases, falling from 11% for the lowest incomes to 6% for the highest incomes. Inversely, the share devoted to food outside the home increases with incomes and takes up the same proportion of the budget as food at home, for the highest incomes.
6%8% 5% 5% 6% 6% 6% 11% 10% 9% 8% 5% 14% 14% 14% 14% 14% 13% 6% 5% 4% 5% 5% 5% 0% 5% 10% 15% 20% All consumer units Lowest 20 % Second 20 % Third 20 % Fourth 20 % Highest 20 % US Food away US Food home B Food away B Food home
Figure 7. Share of food expenditure in the household budget
according to the income quintile
Source: EBM (INS, Belgium), CE (BLS, USA)
If the expenditure made by households with the highest incomes is compared as an absolute value with the expenditure of the quintile of the lowest incomes, the amounts are, in the USA, double for the total amount of food at home but, for some products, this expenditure is more significant (three times as much): fish, dairy products such as cheese, fresh fruit, mixes, sweets, etc. These products moreover prove to be relatively more significant in the expenditure structure of these households as do alcoholic drinks (five times as much).
In Belgium, the relationship between the amount spent is even greater depending on whether the household is to be found in the bottom or top quintile: expenditure for food at home is three times as much except for some foods eaten less when the income is higher, such as, for example, pork, eggs, fresh vegetables or fats (double). As for well-to-do American households, fish, cheeses and sweets do moreover account for more significant shares in the food expenditure structure of Belgian households with the highest incomes. Cereals are an exception since, in Belgium, the share of expenditure that is devoted to them is higher for households with high incomes, the opposite of the American situation.
It is difficult to compare the expenditure of the different age groups without taking income levels into account, which are moreover different in Belgium and in the USA.
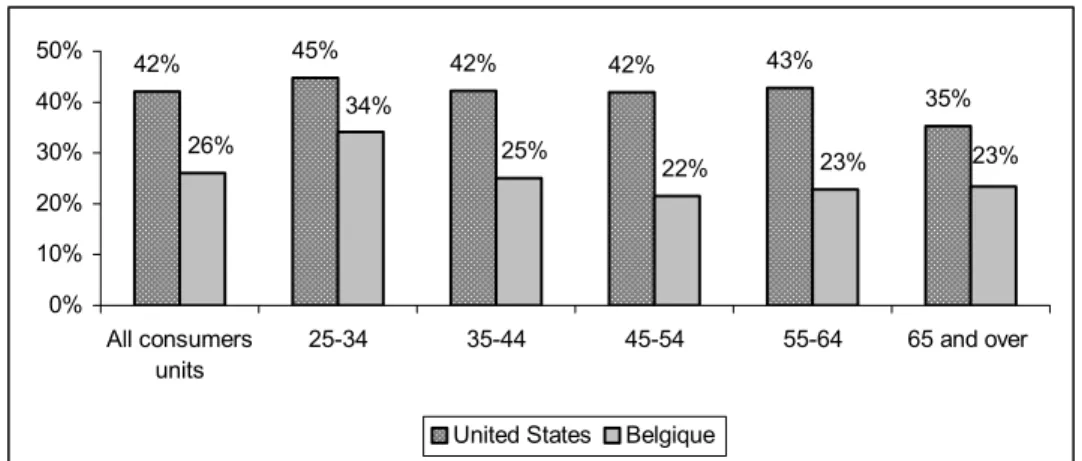
Some consumer habits inherent in age can however be observed.8 For instance, consumption away from
home is clearly more significant among young people in Belgium, as in the USA. (Figure 8)
42% 45% 42% 42% 43% 35% 23% 23% 22% 25% 34% 26% 0% 10% 20% 30% 40% 50% All consumers units 25-34 35-44 45-54 55-64 65 and over
United States Belgique
Figure 8- Share of food consumption away from home in the food budget according to the age of the
person responsible for buying
References
1
Duquesne, B. and Cordier, L., (2004) Approche quantitative de la consommation alimentaire en Région
wallonne, Agriculture-Alimentation-Santé, Gembloux, 12 May 2004, 13p
2 U.S. Department of Agriculture, Office of Communications (March 2003), Agriculture Fact Book,
2001-2002,
3 U.S. Department of Labor, Bureau of Labor Statistics, Consumer Expenditure in 2004 (April 2006),
Report 992.
4
Combris P.(1986), "L'évolution de la consommation alimentaire des Français", Problèmes Politiques et
Sociaux, n°544, La Documentation Française, pp. 9-12.
5
Drewnowski A., Popkin B.,( 1997), "The nutrition transition: new trends in the global diet", Nutrition
Reviews, Vol. 55, No. 2, pp. 31-43.
6 Combris P.(1990), "L'évolution du modèle alimentaire en France de 1949 à 1988 : continuité et
ruptures", Annales de Gembloux, 96, pp. 279-304
7
Duquesne, B. and Lebailly, Ph. (2003) Evolution de la consommation de viande bovine en Belgique,
Rencontre Recherches Ruminants, Paris, 10, 315-318.
8
Duquesne, B., Matendo, S., Lebailly, Ph. (2006) Evolution de la consommation alimentaire en Belgique
et en Région wallonne, “Des produits sains et naturels dans l’assiette des jeunes, une utopie ?”,