Aging and the Labor Market
by
Joanna Nicole Lahey
B.A., Pomona College (2000)
Submitted to the Department of Economics
in partial fulfillment of the requirements for the degree of
Doctor of Philosophy of Economics
at the
MASSACHUSETTS INSTITUTE OF TECHNOLOGY
June 2005
© Joanna Nicole Lahey, MMV. All rights reserved.
The author hereby grants to MIT permission to reproduce and to distribute publicly paper and
electronic copies of this thesis document in whole or in part.
MASSACHUSP--.~ INSI TUTEr OF TECHNOLOGY
LIBRARIESJUN 0 6 2005
LIBRARIES
Signature
of Author.
Signature
ofAuthor...
.
..-. ...
.... - .. ...
....
6%Department
of Economics
May 15, 2005
Certified by,
...-.
....-...
I... ... ... o ... .... ... .. .... ... ...Dora L. Costa
Professor of Economics
Thesis Supervisor
Accepted by ...
Peter Temin
Elisha Gray II Professor of Economics
Chairperson, Department Committee on Graduate Students
ARCHIVES
Aging and the Labor Market
by
Joanna Nicole Lahey
Submitted to the Department of Economics on May 15, 2005, in partial fulfillment of the
requirements for the degree of Doctor in Philosophy in Economics
Abstract
This thesis is a collection of three essays analyzing the interplay between aging and the labor market. The first chapter demonstrates that differential treatment by age exists in labor markets and explores different possible explanations for this differential treatment. As the baby boom cohort reaches retirement age, demographic pressures on public programs such as social security may cause policy makers to cut benefits and encourage work at later ages. This chapter reports on a labor market experiment to determine the hiring conditions for older women in entry-level jobs in Boston, MA and St. Petersburg, FL. I find differential interviewing by age for these jobs. A younger worker is more than 40% more likely to be offered an interview than an older worker. I find no evidence to support taste-based discrimination as a reason for this differential and some evidence to support statistical discrimination.
The second chapter examines more closely one of the possible reason for this differential treatment. Older workers may cost employers more in terms of potential age discrimination lawsuits. I study the effects of state and federal age discrimination laws between 1968 and 1991. Prior to the enforcement of the federal law, state laws had little effect on older workers,
suggesting that firms either knew little about these laws or did not see them as a threat. After the enforcement of the federal Age Discrimination in Employment Act (ADEA) in 1979, white male workers over the age of 50 in states with age discrimination laws work fewer weeks per year and are less likely to be hired or separated from their jobs, but are more likely to be retired (perhaps involuntarily). These findings suggest a story in which firms do not wish to hire older workers, are afraid to fire older workers, and remove older workers through strong incentives to retire in states where lawsuits are less of a hurdle for the worker.
The third paper, co-authored with Melissa Boyle, explores the relationship between health insurance coverage and labor market efficiencies termed "job-lock." We exploit an insurance option which is bth truly exogenous to work decisions, and of lasting duration. A major expansion in both the services provided and the population covered by the Department of
Veterans Affairs health care system allows us to both cleanly estimate the extent of job-lock, and also to study the impact of publicly provided health care on labor supply. Using data from the Current Population Survey, we examine the impact of health care coverage on labor force participation and retirement by comparing veterans and non-veterans before and after the VA expansion. Results indicate that workers are significantly more likely to cease working as a result of becoming eligible for public insurance, and are also more likely to move to part-time work. Thesis Supervisor: Dora L. Costa
Acknowledgements
I thank my advisors Dora L. Costa, Josh Angrist, and Sendhil Mullainathan, without whom I could not have completed this dissertation.
I am indebted to the National Science Foundation for research support in my first, second, and fourth years, and to the National Institute on Aging (through grant number T32-AG 00186 to the National Bureau of Economic Research) for research support in my fifth year. Chapter One also owes support to the National Science Foundation Doctoral Dissertation Grant # 238 7480.
Many people have contributed in important ways to the completion of this project. My undergraduate mentors, Eleanor Brown, Cecilia Conrad, and Hans Palmer, introduced me to economics and provided me with encouragement and support. My MIT friends and office mates, especially Liz Oltmans Ananat, Ivan Fernandez-Val, Chris Hansen, Sarah Siegel, Petia Toplova, and Ebonya Washington have provided mental and emotional support throughout the thesis. The 3rd floor Bureau "kids," especially Melissa Boyle,
Tanwin Chang, Norma Coe, Anne Hall, Shrikanth Kadiyala, and Grant Miller helped to make my final year of graduate school my most enjoyable and productive.
These papers benefited from research assistance from several promising young economists and other scholars, my "small army of undergraduates." My first chapter has benefited from the excellent assistance of Lisa Bell, Faye Kasemset, Jennifer La'O, Dustin Rabideau, Vivian Si, Jessica A. Thompson, and Yelena Yakunina. My second chapter has benefited again from the excellent assistance of Lisa Bell.
My family has been a constant source of support throughout these past five years. Ryan Beasley has been a constant anchor and my mother, Mary Lee Cozad, who went through graduate school herself 30 years ago has consistently provided understanding and advice about how to make the most of the process.
Finally, I thank my proof reader, M. Rose Barlow, ever willing to slog through pages of economic jargon. May I read many future psychology articles in return.
Contents
1 Age, Women, and Hiring: An Experimental Study
1.1 Introduction 1.2 Background
1.3 Experimental Design 1.4 Empirical Framework
1.4.1 Differential Hiring by Age
1.4.2 Reasons for Differential Hiring by Age 1.4.2.1 Statistical Discrimination 1.4.2.2 Taste-Based Discrimination
1.5 Results
1.5.1 Differential Hiring by Age
1.5.2 Reasons for Differential Hiring by Age 1.5.2.1 Statistical Discrimination 1.5.2.2 Taste-Based Discrimination 1.6 Implications 1.7 Concluding Comments 1.8 Data Appendix Works Cited Figures and Tables
2 State Age Protection Laws and the Age Discrimination in Employment Act
2.1 Introduction
2.2 Background 2.3 Empirical Strategy
2.4 Data and Descriptive Statistics 2.5 Results
2.5.1 Employment, Wage, and Retirement Effects
2.5.2 The Impact of Age Discrimination Laws on Hiring and Separations 2.6 Concluding Comments
Works Cited Figures and Tables
3 Alleviating Job-Lock? Evidence from a Public Melissa A. Boyle)
3.1 Introduction
3.2 Predicted Effects of Insurance on Labor Supply 3.3 Reforms in the VA Health Care System
3.4 Data and Empirical Model
3.5 Results
3.5.1 Effects on Labor Force Participation 3.5.2 Effects on Job Choice
3.5.3 Which Veterans Are Affected? 3.6 Concluding Comments
Health Care Expansion (with
80 81 86 87 89 91 93 98 6 9 10 15 17 20 21 24 25 28 30 32 33 38 40 49 51 55 58 60 67 68 70 71
Works Cited 100
Chapter One
Age, Women, and Hiring: An Experimental Study
1.1 Introduction
In a 2004 speech to the Federal Reserve Board, Alan Greenspan suggested that encouraging older people to work could solve many of the problems that will occur as the large baby boom cohort reaches retirement age.1 If older workers remained in the labor
force, social security benefits could be cut without compromising living standards. From a productivity standpoint, workers should be capable of working longer than they had in the past. Not only are people living longer, but several studies suggest that today's 70 year olds are comparable in health and mental function to 65 year olds from 30 years ago (Schaie 1996, Baltes et al 1988). Many older Americans also need to work, even if social security benefits are not cut. Bernheim (1997) estimates that baby boomers on average are only saving a third of what they need to maintain a pre-retirement standard of living after retirement. This lack of adequate retirement savings is especially acute for older widows, who, on average, suffer a 30 percent drop in living standards upon the death of a husband (Holden and Zick 1998). In fact, the poverty rate for older widows is 15% (Favreault et al. 2002). Finally, Abraham and Houseman (2004) find that although most older workers plan to continue working at least part time instead of fully retiring, those who would have to change jobs in order to reduce hours are likely to stop working entirely, suggesting that there is something preventing them from finding a new job.
Will older American women be able to find work? Economists generally assume
Alan Greenspan was not the first to suggest encouraging older workers to remain in the labor force as a partial solution to the Social Security problem, see, for example, Diamond and Orszag (2002).
that staying out of the labor force is a choice for women, so only supply-side factors come into play in policy discussions, such as those regarding social security. This study explores the demand-side of policies that rely on older women finding jobs at the normal age of retirement by running a labor market experiment to explore the hiring behavior of firms seeking entry-level or close to entry-level employees. Although a number of sociology and psychology studies have directly examined age discrimination, these studies typically present a human resources manager (or worse, a group of undergraduate psychology students) with two resumes, one of an older worker and one of a younger worker, and ask which the manager would be more likely to hire (e.g. Nelson 2002). In contrast, this experiment analyzes real rather than hypothetical hiring choices by businesses that do not know they are being studied.
My study examines the entry-level or close to entry-level labor market options for women ages 35 to 62 in Boston, MA and St. Petersburg, FL. I send pairs of resumes to employers in these two cities and measure the response rates by age, as indicated on each resume by date of high school graduation. In addition, I explore reasons for differential responses by age to resumes in several ways. First, I explore statistical discrimination, which is defined as an employer judging a job applicant based on her age-group status rather than on her own individual characteristics. To study this type of discrimination, I look at the effect of resume elements that could signal that the older worker does not fit a stereotype/group characteristic of older workers. Second, I look at employer taste-based discrimination by examining the effect of a firm having a human resources department, since these departments would be likely to have had training in discrimination law. Third, I examine employee taste-based discrimination by looking at the age break-down
of workers in each firm's geographic area. Finally, I examine consumer taste-based discrimination by looking at the residential demographics of each firm's geographic area. I find evidence of differential hiring by age in these two labor markets. A younger worker is 42% more likely than an older worker to be offered an interview in Massachusetts and 46% more likely to be offered an interview in Florida. Statistical discrimination is the most likely explanation for this differential hiring behavior. This study finds little to no evidence for taste-based discriminatory behavior, whether from employers, co-workers or consumers, although the tests used are not perfect.
Age discrimination is comparatively understudied by economists.2 Although
displaced older workers take longer to find employment than do younger3, it is not known
whether this delay is due to discrimination, higher reservation wages, or clustering in dying industries. Experimental labor market studies such as this one have the advantage of directly observing discrimination as it happens. Such studies have primarily examined discrimination on the basis of gender and race (e.g. Fix and Struyk 1993, Yinger 1998, Neumark et al. 1996). Only one set of these studies (a resume study combined with a matched pairs audit) has explored age discrimination (Bendick et al. 1996, Bendick 1999) and there is concern that this study lacks comparable controls (Riach and Rich 2002).
This paper is structured as follows: Section II gives some background information on discrimination laws, testing for discrimination and types of
2 When discussing the term "discrimination," I use a value-free definition of the word, such as in Lundberg
and Startz (1983) that includes forms of differential behavior such as statistical discrimination, where it is possible for the same average productivity to receive the same average compensation. It does not imply that there is necessarily any animus-based discrimination, simply differential behavior.
3 The 2000 CPS Displaced Worker Survey finds that the average 12 weeks search time for workers age 55 to 74 was 3.6 weeks longer than that for workers age 19 to 39. Additionally, 39% of displaced older workers in the February 2000 CPS had not found reemployment by the time of the survey, whereas only 19% of those between 40 and 54 had not found reemployment (US General Accounting Office 2001).
discrimination. Section III gives an overview of the experimental design. Section IV describes the empirical framework for both differential hiring by age and reasons for differential hiring by age. Section V provides results and Section VI discusses implications. Section VII concludes. Further information on the specifics of the experimental design can be found in the data appendix at the end of the paper.
1.2 Background
The Age Discrimination in Employment Act, implemented in 1968 and enforced in 1978, covers workers age 40 and up in firms with 20 or more employees, with a few exceptions.4 This law prohibits discrimination against older workers through hiring,
firing, and failure to promote mechanisms. Since it is more difficult for workers to determine why they failed to receive an interview than it is for workers to determine why they have been fired, firms that wish to retain only a certain type of worker without being sued would prefer to discriminate in the hiring stage rather than at any other point of the employment process.
Labor market studies such as this one that test for discrimination in hiring by sending resumes are called "resume audits" in the United States and "correspondence tests" in the United Kingdom. These studies directly test for discrimination with a
minimum of omitted variables bias. Other audit studies send two trained "auditors," matched in all respects except the variable of interest, usually race, to rent an apartment, buy a house or interview for a job. In practice, however, it is difficult to match people exactly5; one cannot rule out systematic differences observable to the employer between
4 Firms are exempt if they can prove a bona-fide occupational requirement (BFOQ) that is directly related to age (for example, an acting position), or if the position is a high salaried policy making position.
the two groups being studied. Experiments such as this one, using randomized resumes, potentially bypass the matching problem. This type of experiment also has the benefit of being able to explore the different reasons that employers might discriminate against older workers.
Economic theory generally distinguishes between two major types of discrimination: statistical discrimination and taste-based discrimination. Statistical discrimination occurs when an individual is judged based on group characteristics. This form of discrimination is generally thought to be efficient for employers in cases of imperfect information (Arrow 1972). For example, if, in general, it is true that older workers take longer to learn unfamiliar tasks, then an employer may be reluctant to hire an older worker, because testing each older applicant for ability to learn is costly. Taste-based discrimination occurs when an employer, a set of employees, or a customer base, gets disutility from working with individuals from a specific group. This form of discrimination is generally thought to be inefficient from an overall welfare point of view, although it provides utility to the discriminator (Becker 1971).
1.3 Experimental Design
I sent resumes to 3996 firms in the greater Boston, Massachusetts and greater St. Petersburg, Florida areas. Boston was chosen for convenience and St. Petersburg was chosen because it both has a similar demographic mix to what the US Census projects the entire United States to have in the 2020s, that is, it has a large concentration of elderly, and because the St. Petersburg/Tampa Bay MSA is approximately equal in magnitude to
the Boston PMSA.6 Each Sunday, 40 want-ads were culled from the Sunday Boston
Globe and 40 from the online version of the Sunday St. Petersburg Times.7 Monday
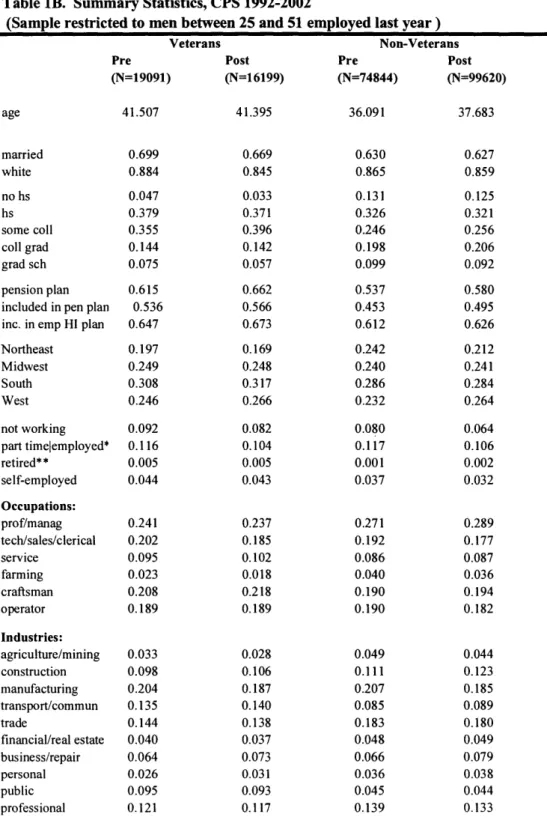
through Wednesday of each week, company names and numbers were randomly selected from the Verizon superpages for Boston and for St. Petersburg and 10 firms were chosen in each city as "call-ins." A computer program mixed and matched work histories and other resume parts from actual entry-level applicants to randomly create new resumes for specified positions. Genuine resumes for many different job categories were taken off of online sites such as www.americasjobbank.com. These resumes were sorted by occupation and age and had items such as previous work experience, licensure, awards, hobbies and volunteer work collected together and entered into a computer program. Summary statistics for the resumes can be found in the Appendix Tables la and lb . Employers could reply to the job seekers via a voicemail box obtained from www.mynycoffice.com and an email address from www.hotmail.com. Detailed information on the process of resume creation and distribution can be found in the Data Appendix.
For the most part, the resumes created for the audit used items from actual resumes (but not in any way that could be connected to the original resume). Two items included in some of the sent resumes did not appear in actual resumes: the specific places of high school graduation and a declaration of health insurance status. Two schools from small college towns from the Midwest were chosen so that employers could not use perceived high school quality (from 17 to 44 years ago) as a signal for worker
6 The Boston PMSA had a population of 3,285,387 in 1998, Tampa/St. Petersburg had a population of
2,254,405 in 1998.
7 The St. Petersburg Times puts all of its want-ads online, whereas the Boston Globe charges employers extra to be included in the online listings.
quality. Some resumes in the experiment included a statement that the applicant did not need health insurance benefits. First names chosen for the job candidates were the first and second most popular female names in the United States for the year of birth of that candidate (Mary and Linda), and the last names chosen were the first and second most popular last names in the US (Smith and Jones), according to social security administration data.8 The addresses chosen were from middle class neighborhoods
which, according to the census, had a wide variation in income and other demographic characteristics (for example, Somerville, MA).
Unlike race or gender, age is a continuous variable. Because I use multiple ages in my study instead of only two ages (e.g. as in Bendick et al. 1999), I can better understand how age interacts with hiring decisions. I chose age 62, the early retirement age, rather than 65, the full retirement age, as the later endpoint for the survey because 65 is the age Medicare benefits generally begin and thus could signal lower health care costs to potential employers. I did not use ages earlier than 35 for two reasons. First, I had to limit the total number of ages I used in order to be able to collect a sample size large enough to preserve power and since my focus is on the older ages, 35 seemed more natural than, for example, 25, as a cutoff.9 Second, because the current resume standard
is to display a 10 year job history, I wanted a potential employer to assume that each applicant was doing the same thing during that ten year history if there were gaps in the resume (e.g. taking care of her family and not going to school).
Word of mouth, not formal advertisement, accounts for most job matches, according to Holzer (1996). However, formal methods are still important, especially for
8 http://www.ssa.gov/OACT/NOTES/note 139/original notel 39.html
9 Initially I had chosen 45 as my "start" age, but after I obtained additional funding, I was able to add 35 before the start of the actual study.
those lacking social networks. To get a more representative sample of job openings than can be found through the want-ads alone, I added 10 entries per city per week generated from calling companies randomly chosen from the Verizon yellow pages.l°0 The response
rate for call-ins was about half that for want-ads. However, the ratio of older positive/interview responses to younger was very similar whether the ad had been generated via want-ad or via call-in1 , thus providing some evidence that the degree of
differential hiring does not vary much with method used, at least if the method still has some degree of formality. For more information on how these "call-ins" were generated, see the Data Appendix.12
Resumes were sent in pairs via fax.'3 A coin was flipped each time a pair of
resumes was sent to determine which would be sent first. Via the randomness of the computer program used to create resumes, employer bias was randomized across each high school graduation date. Employers who left at least two messages for the prospective candidate were informed in a timely fashion that the candidate had already accepted a job elsewhere so as not to inconvenience area firms. Overall I had a "positive" response rate of 8% in Massachusetts and 10% in Florida and an "interview"
rate of 4% in Massachusetts and 5% in Florida.
To distinguish between age discrimination and discrimination based on
'0 I did not add more because the marginal additional call-in was much more time intensive to collect than the marginal additional want-ad.
" The exact ratios of younger positive responses to older (keeping in mind older contains more dates of high school graduation than younger) for Massachusetts are: .778 positive if want-ad, .770 if call-in; .92 interview if want-ad, 1.00 if call-in. For Florida these ratios are: Positive: .763 if want-ad, .741 if call-in; Interview: .906 if want-ad and 1.14 if call-in. The ratios of negative/null responses follow a similar pattern. 12 Online resume clearinghouses were also tried, but, since the economy had cooled by the time the experiment started, the responses they generated were representative of what one finds in one's spamn filter. 13 Only two resumes were sent to each employer because an employer would be likely to get suspicious should he or she receive four virtually identical resumes in a short time period, whereas two resumes are much more likely to be thought of as a coincidence if noticed at all.
differences in human capital or based on perceived gaps in work history, I employed a number of design measures. First, I only sent resumes for women because an employer is more likely to assume that a woman entering or re-entering the labor market has been taking care of her family, rather than returning from prison or a long spell of unemployment, as would be the case for a man. Second, I limited work histories to 10 years, since conversations with human resource professionals and an examination of actual resumes suggested that this length is common practice.14 Third, I indicated that the
applicant was currently employed at an entry-level job so that all applicants had current experience at some form of work (thus diminishing fears that older workers had a longer time for human capital to deteriorate). Finally, I limited my study to entry-level jobs, where entry-level is defined as anything which requires at most one year of education plus experience combined. For these jobs, job-specific human capital should be less of a concern.
Although these limitations can only say something about a specific segment of the labor market, my controls are comparable enough that my results can be trusted. Additionally, I study an important segment of the labor force; the population of older women is larger than that of men and older women are more likely to be living in poverty than men (Favreault et al. 2002). Finally, many entry-level or close to entry-level jobs,
14 I spoke to human resource professionals from three places-first, several professionals from the hiring
department from a large university, second, someone who had worked as a human resources professional for a business firm, but had recently had a career transition to a post where she helped other people determine career transitions, and third, two representatives from a non-profit temporary agency/career placement firm. They all said that ten-year histories are the current gold standard for resumes, although they get many resumes that do not look like the standard. The placement agency said that a big part of their job was to get applicants to make their resumes look like the current standard and the university hiring department said that using an outdated resume style was often an indication that the applicant was older. The university hr department told me that while one was not supposed to put dates of education on resumes, most people did, and it was generally in an applicant's best interest to put down dates of education if it was recent.
such as cashier positions, secretarial work, or home health care tend to be female-dominated jobs, and thus it would not seem unusual for a woman to apply for these positions, whereas a man applying to these positions might be considered suspect.
1.4 Empirical Framework
1.4.1 Differential Hiring by Age
To test for differential hiring by age, I sent paired resumes matched on all characteristics except age1 5, as indicated by date of high school graduation, to prospective
employers in the entry-level labor market. Then I measured the rate of positive responses and interview responses by age. Positive or "callback" responses are those where the applicant was called back and given a "positive" sounding response but not specifically offered an interview. Examples included asking the applicant to call back or saying that the caller has questions. They did not include responses that are obviously negative, such as information that the position has been filled. Interview responses specifically asked the applicant to call back to set up an interview or to meet in person.
There are many ways to measure age given my setup. I looked at high school graduation cohort dummies, age as a continuous variable, and a dummy which broke high school graduation cohorts into two groups: older and younger. The results should be similar, but different age configurations give varying amounts of power.
First I ran differential probits on positive response and interview responses using high school graduation dummies as the independent variables of interest:
5 It is of note that I did not need to match the resumes on characteristics since I use standard differential probit methods to analyze the data rather than the audit methodology of a "paired difference of means" test. Since I targeted a large number of firms, and the resumes were sent randomly, I should get the same results with the regressions I run even had I not matched the resumes. Indeed, since there are five possible ages, it is not even clear what the proper "paired difference of means" test should be.
pr[Responsei =1] = pr[BI(Controls)i
+ B
2(Graduation Cohort) i+ e]
(1)
=
I4)[B(Controls)i
+ B2(Graduation Cohort) i]where tI represents the normal CDF. The tables report the marginal effects, prob
(Responsei =1)/ aXi, where Xi is the vector of explanatory variables. Here, Response is
either a positive response or an interview response, i refers to the individual, and the set of graduation cohort dummies include indicators for graduating in 1959, 1966, 1971, 1976 and 1986. Controls include the number of years of work history out of 10, typos, college experience, relevant computer experience, volunteer work, sport, other hobby, insurance, flexibility, attendance award, and a set of occupation dummies. Since the explanatory variables are dummy variables, this differential probit reports the discrete change in the probability of interview for each variable.
A second way to test for discrimination is to treat age indicated on resume as a continuous variable using a probit:
pr[Responsei = 1 ] = (D[BI (Controls)j+ B2(Age) i] (2)
Then the marginal effect a prob (Responsei = 1)/ Xi represents the discrete change in the
probability of a positive response or interview for each of controls, and the infinitesimal change in the probability of interview for age. Controls are as reported before.
Finally, employers may mentally group workers into "older" and "younger" categories. I break up high school graduation dates into two groups, one for workers age
50 and older and one for workers under age 50, and run a t-test comparing the probability of being called back or interviewed for each group. To compare older and younger groups, controlling for resume and industry characteristics, I run an OLS regression for each group:
Responsei = Bl (Controls)i + B2(Older)i + t (3)
and retrieve the predicted probability for the response. Then I run a t-test comparing these predicted probabilities for each group. Alternatively, another test for these two groups, again using the probit, is:
pr[Responsei =1] =
1[
B (Controls)i + B2(Older)i] (4)Where Older is a dummy indicating that the worker is age 50 or older. The marginal effect pr(Responsei =1)/ X represents the discrete change in the probability of
interview for each variable.
1.4.2 Reasonsfor Differential Hiring by Age
1.4.2.1 Statistical Discrimination
My experimental setup enables me to explore different possible reasons for this differential hiring, or discrimination. 6 The first type of discrimination I look at is
161 do not differentiate between stereotypes which are true (and thus fit in standard models of statistical
discrimination, such as Phelps (1972)) and stereotypes which are false, but employers believe to be true. One can make the argument that since workers who are hired young often age into the firm, that firms which employ larger numbers of workers may have some experience with older workers and are less likely
statistical discrimination, which in its most basic definition, is judging an individual on group characteristics rather than individual characteristics. More formally, I assume the model by Phelps (1972) as outlined in Aigner and Cain (1977) where I assume that employers measure expected skill through an indicator y based on the observed true skill level q and a measurement error u, thus y = q + u. I assume that the variance of u is equal for the two groups and the variance of q is greater for older workers than for younger.1 7
This model provides a framework where positive information about the ability, that is a higher y, helps older workers more than it helps younger workers (the y-E(q) graph will have a steeper slope for older workers than for younger). For example, an indication that an older worker has taken a computer class will cause a greater marginal increment to expected productivity for the older than younger worker, that is, it will help an older worker more than it will help a younger worker.18
I tested for statistical discrimination by randomly including items on resumes that signaled that the worker did not fit into a standard stereotype.19 For example, to test
whether employers think older workers are inflexible and unchanging, I include a statement that the applicant was flexible or "willing to embrace change." To test for the effect of these variables on the probability of getting a callback or interview, I interact
to believe false stereotypes. Additionally, the notion of feedback effects (as in Lundberg and Startz 1983) into educational choices is less of an issue because even though older workers may choose training, the majority of education decisions have already been made. There may still be feedback effects in terms of decisions whether or not to remain in the labor market, however.
17 Average true ability for the two groups is assumed either equal or that true ability is lower for older workers than for younger.
18 Different assumptions provide a model where the test is less reliable for older workers and thus a positive
ability signal would help younger workers more than older. However, there is no reason to assume that either younger workers have larger variance in, for example, computer ability or would get more out of a basic computer skills course than older workers, unlike the case where many black high schools are assumed to be of more variable/worse quality than many white high schools.
19 Stereotypes examined came from a list of the top 10 reasons for discrimination against older workers according to a 1984 survey of 363 companies where hiring managers were asked for reasons that other companies might discriminate against older workers (Rhine 1984). Not all top 10 reasons could be explored using this experimental design.
each of these variables with older.
pr[Responsei =1] = 4[B (Controls) i + B2(SDRi) + B3(Older) + B4(Older * SDRi)] (5)
Where SDR is the reason for statistical discrimination which is being tested and Controls include the number of years of work history out of 10O, typos, college experience, relevant computer experience, volunteer work, sport, other hobby, insurance, flexibility, attendance award, and a set of occupation dummies, except when the reason tested is one of those controls.
Since an interaction term is measuring the difference between the slopes of the
SDR term when Older = 0 and when Older = 1, I can measure the same results by
running the regressions separately for each group. I also run regressions on just the controls and variables of interest (not including an age-related variable) separately for older and younger groups and compare coefficients. This format is identical to the interaction:
pr[Responsei =1] =
I[B
(Controls)i + B2(SDR,) + B3(Olderi) + B4(Older * SDRi)] (6)Where SDR here is a vector of reasons for statistical discrimination and other variables are as described earlier. Showing regressions separately for Older= 1 and Older = 0 has the benefit of efficiently showing multiple interactions at the same time.
Another method to differentiate between statistical discrimination and employer taste-based discrimination using the presence of a human resources department is
described in the next section.
1.4.2.2 Taste-Based Discrimination
Employer
Human resource professionals may have less taste-based discrimination because of training and knowledge of discrimination laws, although they might be more likely to practice statistical discrimination through learning.20 Thus, I study employer
discrimination by interacting a dummy indicating whether or not a company has a human resources department, HR, with age:
pr[Responsei =1] =
I4[B
(Controls) i + B2(HRi) + B3(Olderi) + B4(Olderi * HA?)] (7)where HR is a dummy variable indicating whether or not a company has a human resources department. Older and Controls are as described before.
Employee
My tests for employee taste-based discrimination and customer taste-based discrimination rely on the assumption that people are less likely to discriminate against those in their own group. To study employee discrimination, I interact age with
OverSOWork, the percentage of people employed in the area where the business is located
over the age of 50:
pr[Responsei= 1]
20 Unlike the usual case for race or gender, one's age status does change while employed. Thus an
employer can end up observing the productivity of a group of older workers even if it never hired older workers.
= c[B (Controls)i + B
2(Over50Worki) + B
3(Older) + B
4(Older * Over5OWorki)] (8)
Here Over5OWork is a continuous variable indicating the percentage of people over the age of 50 who work in the firm's place of work PUMA, as indicated by the 2000 census.
Controls and Older are defined as above.
Customer
My test for customer taste-based discrimination is similar to that of employee taste-based discrimination, except that instead of looking at the percentage of people employed in an area, I look at the percentage of people who reside in the area where the business is located:
pr[Responsei= 1 ]
= [B (Controls)i + B
2(Over50i) + B
3(Older ) + B
4(Older * Over50i)]
(9)
Here OverS0 is a continuous variable indicating the percentage of people over the age of 50 who live in the firm's zipcode, as indicated by the 2000 census. Since people who work in services and sales are more likely to interact with consumers, I also run equation
(9) using only service and sales occupations.
1.5 Results
1.5.1 Differential Hiring by Age
of high school graduation, as in equation (1). This trend is much more marked using interview as the dependent variable. Although no two adjacent years are statistically significantly different from the 0 to 5 percent level, the results are suggestive. In Massachusetts, the interview results show a statistically significant difference at the 5 percent level between the oldest, hsgradS9, and youngest hsgrad86. Interview results
may be stronger than positive for two reasons. First, not all "positive" responses may actually be positive-some asking for more information could be preludes to rejection, thus producing measurement error. Secondly, more subtle forms of discrimination, such as calling one person back more enthusiastically than another, are less likely to be discovered than overtly failing to call back the older candidate. In fact, the caller may not even realize that he or she has treated the candidates differently.
The most significant results are found breaking up age categories into "older/younger" groups where older is defined to be age 50, 55, and 62 and younger is defined to be ages 35 and 45.2 Table 1 describes t-test results comparing the mean
response rates for these two age categories with controls as calculated in (3) and without controls. For callbacks, there is a difference of 1.5 percentage points, or 19%, in Massachusetts and 1.7 percentage points, or 18%, in Florida. For interviews, these differences are 1.6 percentage points, or 42%, for Massachusetts and 2.0 percentage points, or 46%, for Florida.2 2 The average younger job seeker in Massachusetts needs to
file, on average, 11 ads to get one callback whereas an older needs to file 13. A younger
21 I also tried breaking up older and younger categories by placing 50 in the younger category (older2 and
younger2) and leaving 50 out altogether (older3 and younger3). Results were similar across categories but, defining 50 as older produced the strongest results.
22 If I take the lowest point in the confidence interval for younger workers and divide that by the highest point in the confidence interval for older workers, and then do the same with the highest point for younger workers and lowest point for older workers, I get a range of a younger worker being -.05 to 113% more
seeker needs to file 19 ads for one interview request and an older job seeker 27. In Florida, a younger worker needs to file 9 and an older worker 11 ads to get a positive response. These numbers are 16 and 23 respectively for an interview response. A probit including older as an age dummy, as in equation (4), results in a negative and significant coefficient for older for interviews in Massachusetts and Florida and callbacks in Massachusetts, as shown in Table 2.
A final way of looking at the effect on age is to actually regress on age as if it were a continuous variable as in equation (2). This method provides more power than using age dummies. Table 2 shows that the marginal effect coefficient on age is negative but not significant at the 5% level such that for each additional year of age, a worker is
.07% less likely to be called back in Massachusetts and between .04% and .06% less likely to be called back in Florida.2 3 This effect is both negative and significant at the 5%
level for the interview response, with each additional year of age causing a worker to be .07% less likely to be called back for an interview in Massachusetts and between .067 and -0.09 less likely to be called for an interview in Florida. Thus there is differential
interviewing by age. Specifically, assuming linearity2 4, in Massachusetts, the mean
applicant would have to answer 1 additional ad to receive a callback for each additional 10 years of age, and 4.5 additional ads to receive an interview request. In Florida, each additional 10 years of age would require 5 more ads to produce a callback and 3.5 more ads to produce an interview (interview responses have a lower base rate, so even though
23 Depending on whether or not controls are included. Since employers may treat certain characteristics differently depending on age, in a non-linear probit model the coefficient of age can change based on whether or not they are included, even if the characteristics are randomized across resumes. In ordinary least squares model the coefficient would not change. Additionally, although age is uncorrelated with the controls by design, in a finite sample there may still be correlation induced by chance.
24 An age squared term came up insignificant in probit regressions. However, I cannot reject a cubic age specification for the interview response in the Florida set. The cubic age specification is not significant in the Massachusetts set.
the percentage decrease by age is more interviews, .067% rather than .04%, this decrease translates into a worker having to apply to 10.7 rather than 10.2 ads for each year of age to get a callback and 23.2 rather than 22.9 ads for each year for an interview).
Companies could also discriminate in more subtle ways than failing to call back or to ask for an interview. Other possible outcomes are calling back the younger applicant sooner than the older applicant, or calling back the younger applicant multiple times but only calling the older applicant once. Although there are examples where either of these outcomes is the case, on average there is not statistically significant discrimination for either of these possibilities (results not shown). I also briefly looked at actual negative responses, but not only were there very few of these, but I have reason to believe that when negative responses are sent out, many of them are sent via postal mail.2 5 Since I do not have information on postal responses for the majority of
applications, it is not feasible to use negative responses as an outcome.
1.5.2 Reasons for Differential Hiring by Age
Economists recognize two main categories of discrimination: statistical discrimination and taste-based discrimination. Statistical discrimination can occur based on observables, such as work history or typographical errors, or unobservables, such as energy or ability to learn. In my experimental setup, observables are identical for each resume pair sent and thus cannot be responsible for the differential hiring. To look at the effect of unobservables, I included items on the resumes to signal that the applicant did
25 In the Massachusetts part of the sample, I was able to collect mail at one of the two addresses that were
randomly assigned to resumes. Through this collection, I did not find any positive or interview responses, but did receive some negative responses. The majority of written responses were post-cards stating receipt of the application. There were a few requesting more information, but these also requested more
not fit a number of stereotypes cited by managers as reasons firms might be reluctant to hire older workers (Rhine 1984). The effects of these variables are discussed in more detail below and are detailed in Table 3 which gives results from running equation (5) separately by older status.
1.5.2.1 Statistical Discrimination
Employers may statistically discriminate because they fear that older workers will "cost" more in terms of absences and benefits. To test whether or not companies statistically discriminate against older workers because they assume older workers will have more absences, I introduced an item on the resume saying that the applicant has won an attendance award. This variable is positive but not significant at the 5% level. If anything, attendance awards help younger workers more than older in terms of magnitude. To see whether or not higher health insurance costs are a reason older workers are not hired, I put in the statement that a worker does not need insurance coverage.2 6 Although having insurance seems to help getting a callback overall in
Massachusetts, nothing can be said by age at the 5% level. Already having insurance increases the likelihood of getting a callback or interview in Massachusetts, but helps only younger workers and may hurt older workers in Florida, although, again, these results are not significant. Employers could also fear that older workers may be less likely to have reliable transportation, and thus may be tardy or absent from work for this reason. There is no evidence that commute time, matched by zipcode to place of work
26 Although, according to Blue Cross/Blue Shield (personal communication), health insurance costs generally stay the same for women until the age of 65 (the possibility of pregnancy goes down as a woman ages) there is some doubt that human resource managers are aware of the fact. Scott et al. (1995) find that older age hiring is lower in firms that offer health insurance. However, firms that offer benefits such as health insurance are different than firms which do not. For example, they tend to be larger and have steeper earnings profiles as well (Idson and Oi 1999).
PUMA affects older or younger workers differently (results not shown).
Employers may also worry that older workers will not be as productive as younger. First, they may believe that older workers' knowledge and skills are obsolete. For this reason I added a variable indicating that the worker had gotten a computer certificate in 1986 (which would be outdated), 1996 or 2002/2003 when such skills would be relevant and recent. Although not significant, relevant computer experience helps younger workers to get interviews in Florida more than older workers. However, in Massachusetts, it helps older workers more than younger, although the interaction term is only significant at the 40% level.27 Vocational training28 helps younger workers more
than older workers to get both callbacks and interviews. An interaction between vocational training and older (not shown) gives this result to be significant at the 5% level for Florida, but not for Massachusetts. Second, employers may be worried that older workers lack energy. To test this reason, I introduced an item on the resume saying the applicant plays sports. For the most part, this variable is not significant. It is significant and negative for the callback response for younger workers in Massachusetts and significant and positive for the interview response for younger workers in Florida. Although an interaction term shows putting sports on the resume to hurt older workers less than younger workers, this finding is only significant for positive responses at the 20% level in Massachusetts.
Third, previous research has suggested that older women use volunteer work as a "stepping stone" to labor market work (Stephen 1991), and, indeed, I find that having
27 Interaction results have also been done using the Norton adjustment, and results still hold (Norton et al.
2002). Magnitudes may change, but signs and 5% significance do not.
28 Note that occupation and vocational training are mechanically related in this experiment because
vocational training was only given to resumes for which it was required (such as dental assisting or nursing).
volunteer work listed helps older women more than younger.29 Fourth, Bendick (1996)
found that the biggest help to an older worker's resume was to signal that he or she was flexible or "willing to embrace change." Although only significant at the 10% level for Massachusetts, I found that having this statement on a resume hurts an older worker, but does not hurt a younger worker.3 0 This difference in findings may be because the AARP
has been recommending that older workers put such statements on their resumes since the time of Bendick's study and thus this statement now signals that the worker is old.
Finally, experience may interact with age as a form of statistical discrimination. Employers may assume that older workers have more experience, or they may be prejudiced against an older worker if she does not have more experience than a younger worker. I looked at this issue in two different ways. First, I looked to see what effect having experience in the same occupation for which the worker was applying had for the different age groups. Although no interactions of same experience with age are significant at the 5% level (not shown), having occupational experience listed on the resume similar to occupation being applied to the helps younger workers more than older workers as shown in Table 4. However, a different effect is found for implied experience-that is, when the want-ad requires experience 3; older workers were hurt less than younger workers, as shown in Tables 4, although again, this finding is not significant at the 5% level. Thus there is slight evidence that employers are more likely to give older workers the benefit of the doubt in terms of experience, but only when
29 The interaction of older and volunteer is positive and significant at the 25% for positive outcomes and 30% level for interview outcomes in Florida, but only at the 46% level for interview in Massachusetts. 30 The interaction of older and flexible is significant at the 14% level for the interview variable in Massachusetts and at the 70% level for Florida.
31 Admissible want-ads could include requirements of up to a year of experience, whether the applicant had it on the resume or not.
neither applicant lists the required experience on the resume. Otherwise, having the required experience may help younger workers more than older. This possibility suggests that the entry-level labor market may be different in terms of age discrimination from markets requiring more experience.
1.5.2.2 Taste-Based Discrimination
Employer
One form of taste-based discrimination is employer discrimination, in which the employer him or herself (or those doing the hiring) prefers one group over another based on his or her own tastes. Human resource professionals may have less taste-based discrimination because of training and knowledge of discrimination laws, although they might be more likely to practice statistical discrimination based on learning from past hires. Bendick (1994) assumes that firm size is a proxy for having a human resources department and finds that there is no link between race discrimination and firm size. I found no link between having a human resources department and being more or less discriminatory using equation (7). In my study, firms with human resources departments may be more likely to interview younger workers, which would support the case of statistical rather than taste-based discrimination, but this finding is not significant.3 2 The
controlled coefficient on the interaction term between Older and HR for Florida for the interview outcome is -0.007with a standard error of 0.018 and this coefficient for
32 Another possible way of measuring employer taste-based discrimination is to examine the hiring
interaction between the ages of employers or human resources professionals and applicants. However, I have been unable to collect information on employer age. Additionally, just because an employer is a member of a group does not mean that he or she will not discriminate against other members. For example, Dick Clark, age 76, was recently sued for age discrimination
Massachusetts is -0.017 with a standard error of 0.0195.33
Employee
Another form of taste-based discrimination occurs when employees prefer to work with members of a certain group. Younger employees might prefer to not to work with older employees, especially when the older employee is in a subordinate position. To test for this type of discrimination, I match zipcodes from my dataset to place of work PUMA information on worker age from the census and look at the effect of percentage of workers over 40, over 50 and over 61 employed in the PUMA.3 4 I found no effect of the
age of a company's workforce on the differential hiring by age, thus providing no support
35
for employee taste-based discrimination (results not shown).3 5 However, this measure
may be too crude, as it matches zipcode to place of work PUMA information rather than using the percentage of workers by age in a firm.
Customer
A final source of taste-based discrimination comes from the consumer base. Consumers may prefer to buy from or interact with employees who are like them. To test for this type of discrimination, I used the census to get age profiles of zipcodes in Florida and Massachusetts and matched them to the zipcodes of the companies applied to in the study. Taste-based discrimination should be even higher in occupations where there is interaction with the public, such as in sales and service. There is no evidence of
33 A Norton correction does not change the sign or significance of these effects. The main effects for Florida are -0.008 for older and 0.010 for HR. In Massachusetts, these effects are -0.021 for older and 0.018 for HR.
34 This effect of older workers in a company influencing the age of new hires is not mechanical because older employees may have been hired young and aged with the company.
35 For the percentage over age 50 interaction with older, the FL coefficient is .00139 with a standard error of .00286 and the MA coefficient is -.660 with a standard error of .478.
consumer taste-based discrimination; areas with higher percentages over the age of 50 are more likely to call back or to interview in general and these results are stronger for younger workers than for older. The results are similar when only service and sales positions are looked at (results not shown). Thus there is no evidence that younger consumer bases prefer workers in the same age group.
1.6 Implications
These differential responses have real implications for older potential workers. One may wonder, "So older workers have to send in a few more applications to get an interview, so what?" Aside from the psychological implications of implied rejection, there are economic consequences to this sort of differential that are more severe for some occupations than others. First, the number of applications sent to receive an interview vary by occupation. Using general occupation categories, the number of applications needed for an interview ranges from a low of 5.5 for younger workers and 10 for older workers in healthcare positions in Florida to a high of 32 ads for younger workers and 72 ads for older workers seeking clerical positions in Massachusetts.36 Second, many
occupations have a limited number of positions advertised each week. For example, on a randomly chosen Sunday in Florida, there were 34 LPN jobs being offered but only 8 pre-school teacher positions. For some professions, such as jewelry appraiser (which requires 6 months to a year of training), it is possible to call almost every jewelry store in
36 With "low" and "high," I am only including general occupation categories that have at least 200 resumes
sent. There are some occupational categories with low sample sizes, such as professional/technical non-healthcare (mostly pre-school teachers) in Florida that received no responses for older workers, and thus would, by the metric used, require an infinite number of resumes to receive an interview. However, only 51 resumes were sent to p/t non-healthcare positions in Florida. There were 558 healthcare resumes sent in Florida and 1057 clerical resumes sent in Massachusetts.
the area over the course of a year and only net one interview.3 7 Finally, given that the
wages for many of these occupations are not very high (often minimum wage), it is likely that persons seeking these jobs also do not have a large amount of wealth to finance an extended job search, especially if they cannot receive employment benefits.
What does this mean for older vs. younger workers? Conditional on getting an interview response, it takes on average 8 days to be offered an interview. I have not been able to find information on the number of interviews it takes to get an entry-level job, but one online firm38 finds that it takes 7-10 interviews on average for a college graduate to
obtain a job offer. Using a back of the envelope calculation with one of the professions most likely to be hired, a new licensed practical nurse3 9 sending out -30 applications a
week can expect 3 interviews a week as an older worker and 6 interviews a week as a younger worker. Assuming it takes 7-10 interviews to land a job, a younger worker could expect an employment offer in a little over a week, and an older worker 3 weeks. But this is the best case scenario. An older worker attempting to find clerical work could file close to 100 applications per week and expect to be given an offer 7 to 10 weeks later (a younger worker would get an offer in half that time), using the same back of the envelope calculation, and that is only assuming that there are 100 unique new clerical ads each week, which, since a large number of ads are run at least two weeks in a row, is unlikely. For someone who needs to work because of a lack of savings, several months without income could be critical.
37 Which was the case in Florida. 38 www.onestop.com
39 A profession which takes year of training and had a median salary of $31,440 in 2002 according to the
1.7 Concluding Comments
This study clearly shows differential interviewing by age for entry-level positions in contemporary labor markets. I found that younger applicants are 44% more likely to be requested for an interview in Massachusetts and 43% more likely in Florida. The extent of discrimination against older workers is similar to that of discrimination against women or blacks.4 0 I found no evidence of taste-based discrimination. I found some
evidence for statistical discrimination against workers along a few dimensions, such as skills obsolescence, as signaled by adding relevant computer experience to a resume (but only in Massachusetts). Many resume items helped younger workers but either hurt or did not affect older workers.
Future research needs to be done both exploring other labor markets, such as the non-entry-level market, and pinpointing additional reasons for statistical discrimination. In non-entry-level positions, there may be taste-based discrimination against younger workers supervising older workers, which would suggest that there would be less age discrimination against older workers in these markets. For example, managerial positions in Florida (but not Massachusetts) tended to prefer older workers, interviewing 4% of older applicants and 1% of younger workers. I also found differences in differential hiring between occupations; Blue-collar and male-dominated occupations in the sample tend to prefer older workers to younger. Since these occupations in my sample tend to be clustered in dying industries, there may be a bias towards hiring workers with shorter
40 Neumark et. al (1996) find evidence of 47% differential interview requests against female waitstaff in high-price restaurants and 40% towards female waitstaff in lower-price restaurants. Bertrand and
Mullainathan (2003) find that applicants with white sounding names are 50 percent more likely to be called for an interview than applicants with black sounding names. It is somewhat difficult to compare the extent of the magnitude of age discrimination to race or gender discrimination, since age is not a binary variable and breaking into older and younger categories can be done arbitrarily. I might have found more had I been comparing, for example, 32 year olds to 90 year olds only.
expected future work-lives.
Another reason for discrimination against older workers that could not be tested in this set-up is that older workers cost more because they can sue employers under the Age Discrimination in Employment Act. In this volume, Lahey (2005b), looks at the effect of age discrimination laws on older workers. Although it finds that these laws have a significant and negative effect on older white men, it does not find a similar effect for older women. Since the current cohort of older women is unlikely to sue, employers may not take possible litigation into consideration in the hiring process.
This study provides evidence that the demand for labor from older workers is smaller than that for younger workers. Simply encouraging older workers to reenter the labor force will not guarantee that they will be able to find jobs in a timely manner, if at all. This study also has important implications for women who are most likely to need additional work-those with little work experience who unexpectedly need to enter the labor market, such as widows, those whose husbands have lost jobs and cannot find employment, or divorcees. Although there are more older women than older men, the majority of economic surveys on aging and work focus on a random sample of men and, if they include women at all, only include spouses. Any policy which depends on older people finding work to maintain their quality of living, such as changing social security benefits, needs to consider this demand side.
1.8 Data Appendix
The use of a computer program to randomly generate items to create many different possible resumes is a large improvement over earlier studies. First, unlike
studies where a limited number of resumes are used, it lessens (and can test for) the possibility that an employer is reacting to something specific in the particular resume sent out. Additionally, because there is no human interaction with the resume during its creation, the possibility of injecting subjectivity into the process of matching resumes with job openings is completely eliminated. Resumes and resume items (other than the objective) are truly randomly assigned to job openings, eliminating many possibilities for bias.
The computer program used to prepare and match resumes is best explained through example. Say that a job vacancy for a receptionist has been found. The researcher will open the computer program specifying jobs for a receptionist position. The computer program will first randomly choose two of the possible women to apply to the job, for example, Linda Jones (age 45) and Mary E. Smith (age 62). It will then pick an objective statement for Linda ("To obtain a position as a receptionist") and a matching one for Mary ("To secure a position as receptionist"). Similarly it will match work histories and high school. Next it will decide whether or not to test for one or more of the possible reasons for discrimination through adding items to the resume. As an example, to see if lack of energy is a reason employers discriminate against older people, the computer will put under hobbies that Linda Jones is a tennis player, then designate Mary E. Smith as a racquetball player. Regressions found no significant difference between response rates for tennis and racquetball players, or any of the other possible paired choices.