HAL Id: tel-03248143
https://tel.archives-ouvertes.fr/tel-03248143
Submitted on 3 Jun 2021
HAL is a multi-disciplinary open access
archive for the deposit and dissemination of sci-entific research documents, whether they are pub-lished or not. The documents may come from teaching and research institutions in France or abroad, or from public or private research centers.
L’archive ouverte pluridisciplinaire HAL, est destinée au dépôt et à la diffusion de documents scientifiques de niveau recherche, publiés ou non, émanant des établissements d’enseignement et de recherche français ou étrangers, des laboratoires publics ou privés.
Côme Billard
To cite this version:
Côme Billard. Green Connections : A Network Economics Approach to the Energy Transition. Eco-nomics and Finance. Université Paris sciences et lettres, 2020. English. �NNT : 2020UPSLD012�. �tel-03248143�
Green Connections : A Network Economics Approach to
the Energy Transition
Soutenue par Cˆome Billard
Le 3 D´ecembre 2020
´Ecole doctorale no543
Ecole doctorale SDOSE
Sp´ecialit´e
Sciences ´economiques
Composition du jury : Mme Mirabelle MU ˆULS
Assistant Professor, Imperial College London Rapporteure
Mme Katheline SCHUBERT
Professeure, Paris School of Economics Rapporteure
M. Arnaud MAGNIER
Docteur, Institut d’Etudes Politiques de Paris Membre du jury
Mme St´ephanie MONJON
Maˆıtre de Conf´erence HDR, Universit´e Paris-Dauphine Pr´esidente du jury
Mme Anna CRETI
Professeure, Universit´e Paris-Dauphine Directrice de Th`ese
Persévérance.
Ainsi va la vie, à bord du Redoutable.
Le Redoutable, M. Hazanavicius, 2017.à Paris pour débuter un stage de recherche à la Chaire Economie du Climat, j’étais loin d’imaginer que cette aventure me menerait au doctorat. Après trois années et quatre chapitres de thèse, voici le temps de l’écriture des remerciements (moment ultime dont chaque doctorant a pensé un jour ou l’autre la rédaction). Parce que la thèse est avant tout une aventure humaine, et l’expérience qu’on en fait étroitement liée au duo thésard/encadrant, j’adresse mes premiers remerciements à Anna. Elle m’a fait confiance et m’a épaulé à chaque étape de mes reflexions, je lui dois beaucoup et je lui en serai toujours profondemment reconnaissant. Un grand merci Anna.
Parce que le doctorat est une étape intense vers un après, je tiens à exprimer toute ma gratitude à chacun des membres du jury pour avoir accepté de clore ce chapitre avec moi. A vous, Mirabelle Muûls, Katheline Schubert, Stéphanie Monjon et Arnaud Mag-nier, merci du temps que vous accorderez à la lecture de ce manuscrit, en espérant que vous le trouverez digne d’intérêt. La composition de ce jury me tient particulièrement à coeur car elle incarne des rencontres s’étalant de mes premières années d’études à la fin de la thèse. Avec cette soutenance se concluent ainsi huit belles années universitaires. J’ai une profonde reconnaissance envers ceux qui m’ont fait grandir à travers différents projets de recherche ces dernières années. Je pense particulièrement à Antoine Man-del et nos meetings du jeudi après-midi. Un grand merci Antoine pour notre (long et très agréable) travail sur les Etats-Unis, ta gentillesse et ta disponibilité. A Alex Teytelboym qui, par nos discussions en 2018, a posé les premières graines de l’approche Network dans mon esprit - et bien sûr, pour le très studieux séjour à Oxford début 2020. Un chaleureux merci à vous deux.
Si je retiens une chose de mon cours de Master intituléHappiness and Subjective Well-Being, c’est bien la formule suivante : Context matters. Et en réalité, context matters tout le temps. Et particulièrement pour une thèse. J’ai eu la chance de passer ces
l’occasion de croiser des visages qui allaient faire partie de mon futur quotidien. Un grand merci à Boris de m’avoir accompagné durant mes mois de stage, je ne garde que de bons souvenirs de nos échanges (et notamment de notre premier rendez-vous sponsor en béquilles). A Raphaël T., merci pour nos discussions et les nombreux aires de musiques sifflés ensemble. A Christian, un grand merci d’avoir accepté que je me lance dans l’aventure "thèse", je te suis sincérement reconnaissant pour tes conseils tout au long de mon doctorat et nos travaux communs. Tu resteras l’incarnation du chercheur faisant le lien entre la recherche et les entreprises. A cette chère Claire, qui était là avant moi - je te remercie pour toutes nos pauses discussions, qu’elles soient personnelles ou professionnelles. Ta présence, tout au long de mes trois années, dans mes moments joyeux comme dans ceux plus difficiles, a été importante. Un grand merci d’avoir toujours été là quand j’avais besoin.
A cette très belle équipe de doctorants, pour certains devenus docteurs, vous man-querez à mon futur quotidien. Aux Dr. Salomé et Dr. Olivier, un grand merci à vous pour tous nos moments du jeudi/vendredi qui ont rythmé mes fins de semaine de recherche. Mention chaleureuse au Dr Olivier pour l’organisation des FLM et la com-mande de poulet teriyaki toujours parfaite - une tâche qu’il aimait particulièrement. Au Dr Edouard, que dire de mon cher voisin, ta positivité, ton énergie et ton naturel ont fait de toi un repère à la Chaire et jusque dans une mairie parisienne (et c’est une très bonne chose). Un vrai bonheur de t’avoir vu arriver chaque jour avec le sourire - keep in touch my neighbour. Au Dr Simon, merci beaucoup de tous tes conseils au début de ma thèse et de ta bienveillance tout au long de mon parcours à la Chaire. A ma chère Anouk, qui sera docteure dans quelques semaines, je te remercie pour la petite équipe de soutien, très soudée et persévérante que nous avons formé pendant notre aventure de thèse concomitante. Nous avons relevé le défi ( - "je ne peux pas l’croire", "c’est drôle" - ). A Quentin H., que j’ai véritablement découvert au cours de mes derniers
garder les secrets) - de belles discussions ensemble sont encore à venir. Enfin, à ce cher Valentin, une rencontre amicale qui traversera à coup sûr les prochaines années. J’ai été chanceux d’avoir un de mes plus proches amis à la chaire depuis 2018. Merci mon grand ! Je te souhaite tout le meilleur. C’est aussi ça la Chaire, un endroit de liens et d’amitiés. Je pense évidement à Etienne, Jérôme, Richard, Maxime, Esther, Ma-madou, Théotime, Nathaly et bien sûr Raphaël, à qui je souhaite le meilleur pour la fin de la thèse. Je tiens à remercier Aliénor pour la lecture attentive de l’Introduction et Esther pour celle du Chapitre 2.
Enfin, je remercie ceux qui m’entoure depuis des années. A ma famille, Kiki et Rat, AnneC, Math, Damien, Ségo et Luisaoooo pour sa relecture du chapitre 3 - vous savez tous combien j’ai eu du mal à faire cette introduction. Je remercie mon frère jumeau, Quentin, pour l’équipe que l’on forme depuis 26 ans. A ma team de Nantes, majoritairement délocalisée à Paris, dont le temps n’use pas les amitiés : merci les gars. Une dédicasse particulière à Tonio pour nos petits-déjeuners et nos ballades à répétitions au Palais Royal à débriefer. Merci également à mes amis du côté de la Rochelle : Emmanuel et SimDuf. Enfin, à ceux que je connais depuis longtemps et les rencontres plus récentes : Hugo, Xavier, Quentin, Jérémie et Benjamin, Emmanuel B., Arthur (et nos sessions codes !) et MG, sans oublier bien sûr ma chère connection indienne Parvathi, merci d’être là ! JoJo, je ne t’oublie pas non plus.
Contents i
List of Figures v
List of Tables ix
General Introduction 1
1 Network Structures, Environmental Technology and Social
Conta-gion 23
1.1 Introduction . . . 24
1.2 Model of Cascades in Networks . . . 30
1.2.1 The Network . . . 30
1.2.2 Technology Adoption . . . 33
1.3 General results and Analysis . . . 36
1.3.1 Preliminaries : Numerical Setting . . . 36
1.3.2 Understanding diffusion (I) : Seed set and Learning effects . . . 37
1.3.3 Understanding diffusion (II) : Cascades’ spreading . . . 40
1.3.4 On Cascades’ lengths and Adoption dynamics . . . 42
1.3.5 Efficient Strategy : Tipping Points in Seeding . . . 47
1.4 Conclusion . . . 48
2 How Environmental Policies Spread ? A Network Approach to Dif-i
2.2 Related Literature : Policy adoption, Diffusion and Network perspectives 68
2.3 Methodology : Inferring the network . . . 72
2.4 The U.S. Environmental Policy Network . . . 75
2.4.1 General Context and Data . . . 75
2.4.2 Statistical Analysis of the Network . . . 78
2.4.3 Centrality Analysis : Looking for Facilitators . . . 81
2.5 Estimating the Determinants of the Diffusion Network . . . 89
2.5.1 Modelling strategy and data . . . 89
2.5.2 Empirical results . . . 92
2.6 Conclusion . . . 95
3 Triggering Reduction of Imported Emissions in the E.U. 121 3.1 Introduction . . . 122
3.2 Literature : Input-Output, Emissions embedded in Trade and Border Adjustments Mechanisms. . . 127
3.3 Methodology & Data . . . 131
3.3.1 The Emission Reduction Multiplier Matrix . . . 131
3.3.2 Datasets : Input-Output Tables and Imported Emissions . . . . 135
3.4 Cascading Reduction of Imported Emissions . . . 138
3.4.1 Emission Reduction Coefficients . . . 138
3.5 Channels of Reduction Cascades . . . 144
3.6 Taxing Basic metals Imports : A simulation of short-run impacts . . . 147
3.6.1 Perspectives on the Basic metals industry . . . 147
3.6.2 Pricing carbon content of imported basic metals . . . 149
3.7 Conclusion . . . 152 ii
4.1 Introduction . . . 168
4.2 Methodology & Data . . . 175
4.2.1 The Emission Reduction Multiplier Matrix . . . 175
4.2.2 Datasets : Input-Output Tables and Emissions. . . 179
4.3 Cascading Greenhouse Gas Emissions . . . 181
4.3.1 Emission Coefficients . . . 181
4.4 Channels of Emission Cascades . . . 187
4.5 Discussions and conclusion . . . 192
Conclusion 205
References 213
1.1 Transition from a locally ordered network (lattice) to a disordered one (random) via a small-world state. From left to right : p=0 (Lattice),
p=0.1 (Small-World), p=1 (Random).. . . 31
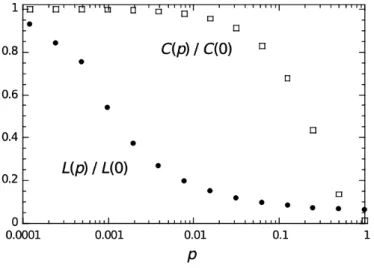
1.2 Average clustering and average path length as a function of p. . . 32
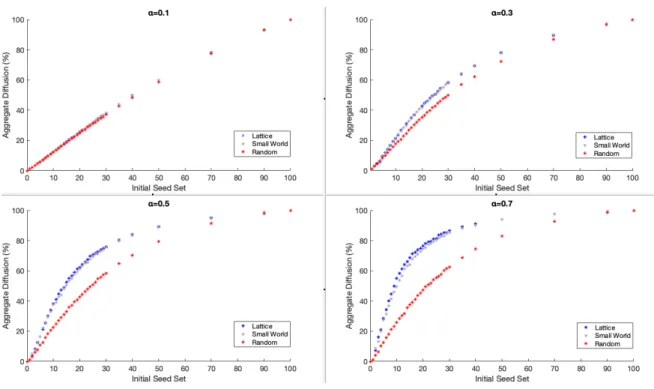
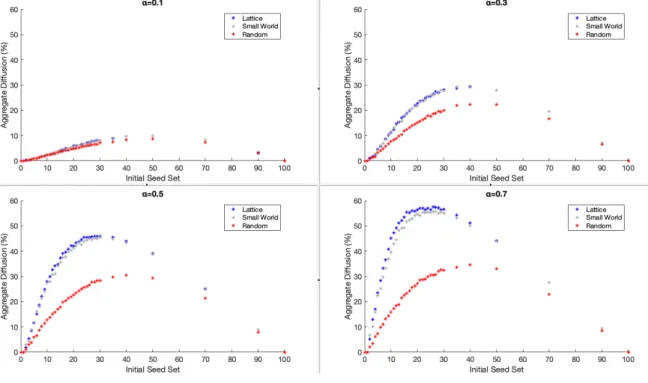
1.3 Aggregate diffusion as a function of initial seed sets . . . 37
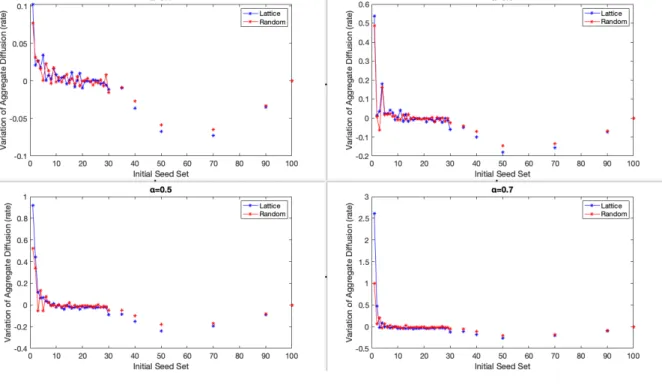
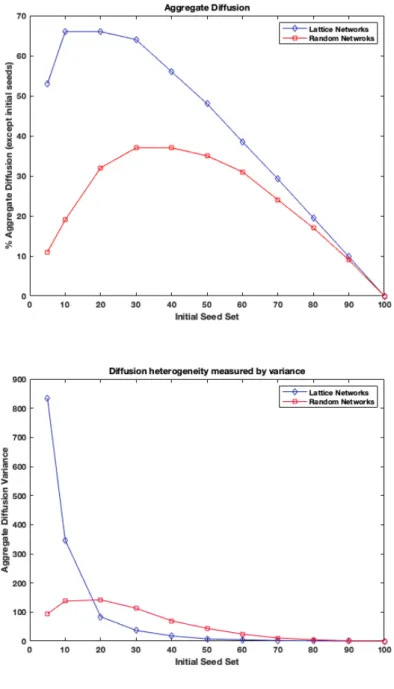
1.4 Aggregate diffusion as a function of initial seed sets (non-seed population) 38 1.5 Diffusion heterogeneity measured by variance. . . 42
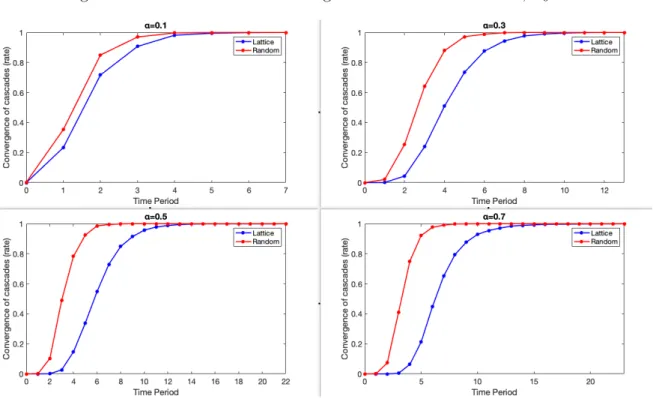
1.6 Rate of Cascades convergences as a function of time, S0=5 . . . 43
1.7 Rate of Cascades convergences as a function of time, S0=35 . . . 44
1.8 Adoption dynamics as a function of time, S0=5 . . . 46
1.9 Adoption dynamics as a function of time, S0=35 . . . 46
1.10 Marginal change of aggregate diffusion divided by the number of seeds. 48 1.11 Diffusion gaps, baseline lattice . . . 53
1.12 Cascades convergences, S0=[5; 15; 25; 35] . . . 54
1.13 Adoption dynamics with respect to time, S0=[5; 15; 25; 35] . . . 55
1.14 Aggregate diffusion (except initial seeds) and heterogeneity in a one threshold scenario (neighborhood effect without cost dimension) . . . . 56
1.15 Aggregate adoption and heterogeneity for different scenarios of cost threshold distribution over specific intervals (0,1;1); (0,2;1); (0,3;1); (0,5;1); (0,7;1), with S0=[5] . . . 57
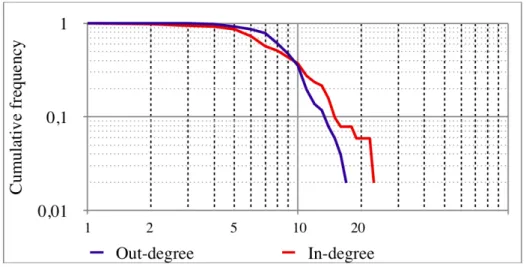
2.2 Cumulative distribution of states’ out-degree and in-degree.. . . 81
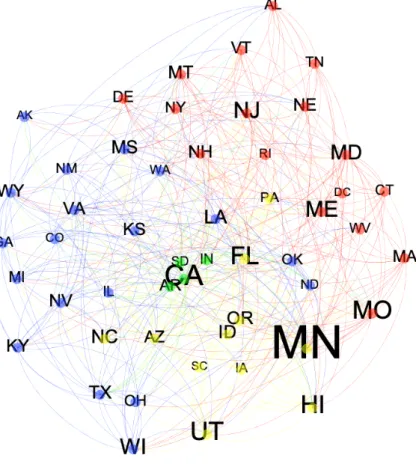
2.3 Reconstructed network using Force Atlas layout. The node size in pro-portional to betweenness centrality, a centrality measure capturing the notion of hubs facilitating policy flows. Position of nodes depends on associated connections in the network. . . 88
2.4 Reconstructed network using Force Atlas layout. The node size in pro-portional to betweenness centrality, a centrality measure capturing the notion of hubs facilitating policy flows. . . 110
2.5 Reconstructed network using geographical layout. The node size in proportional to the degree centrality. . . 111
2.6 Reconstructed network using geographical layout. The node size in proportional to the betweenness centrality. . . 111
2.7 Reconstructed network using geographical layout. The node size in proportional to the weighted out-degree ranking.. . . 112
2.8 Reconstructed network using geographical layout. The node size in proportional to the weighted in-degree ranking. . . 112
2.9 1974-1992 . . . 113
2.10 1974-2000 . . . 113
2.11 1974-2008 . . . 114
2.12 1974-2016 . . . 114
2.13 1974-2018 . . . 115
2.14 Energy Network inferred using Force Atlas Layout. Communities are colored and the node size is proportional to the betweenness centrality indicator. . . 117
betweenness centrality indicator.. . . 118
3.1 A stylized Input-Output Table (Cahen-Fourot et al., 2020) . . . 132
3.2 Distribution of imported CO2emissions across mining (B05-06), coke/petrol.
products (C19) and basic metals (C24) . . . 138
3.3 Network of imported emission reduction across sectors in Germany. The size of the node is proportional to the number of weighted incoming links (i.e. demand of a sector to another sector). . . 142
3.4 Network of imported emission reduction across sectors in Poland. The size of the node is proportional to the number of weighted incoming links (i.e. demand of a sector to another sector). . . 143
3.5 % increase cost of sectoral domestic imported inputs, top sectors. . . . 151
3.6 Hierarchical network of imported emission reduction cascades across economic sectors in France. . . 158
3.7 Hierarchical network of imported emission reduction cascades across economic sectors in Germany. . . 158
3.8 Hierarchical network of imported emission reduction cascades across economic sectors in Italy. . . 159
3.9 Hierarchical network of imported emission reduction cascades across economic sectors in Poland. . . 159
3.10 Hierarchical network of imported emission reduction cascades across economic sectors in the United Kingdom. . . 160
4.1 A stylized Input-Output Table (Cahen-Fourot et al., 2020) . . . 176
4.2 Distribution of total GHG emissions (CO2 eq.) across Agriculture (A),
Electricity and Gas (D-E) and Other Non-metallic mineral products (C23). . . 181
4.4 Network of emissions across sectors in Spain. The size of the node is proportional to the number of weighted incoming links. . . 186
4.5 Hierarchical networks of emission cascades across economic sectors in France France (left) and Germany (right). . . 188
4.6 Hierarchical networks of emission cascades across economic sectors in Italy (left) and Poland (right). . . 189
4.7 Hierarchical network of emission cascades across economic sectors in Spain. . . 189
1.1 n=5 . . . 58 1.2 n=20 . . . 58 1.3 n=30 . . . 58 1.4 n=40 . . . 59 1.5 n=5 . . . 59 1.6 n=20 . . . 59 1.7 n=30 . . . 60 1.8 n=40 . . . 60
2.1 Environmental and Climate Change Policies collected in Brief. . . 77
2.2 General properties of the network. . . 79
2.3 Regional-level statistics. . . 86
2.4 Matrix of intra-interregional connections. . . 86
2.5 Estimation results of diffusion network approach. . . 92
2.6 Centrality Measures (1/2). . . 102
2.7 Centrality Measures (2/2). . . 103
2.8 Top rankings according to centrality indicators (1/6). . . 104
2.9 Top rankings according to centrality indicators (2/6). . . 104
2.10 Top rankings according to centrality indicators (3/6). . . 105
2.11 Top rankings according to centrality indicators (4/6). . . 105
2.12 Top rankings according to centrality indicators (5/6). . . 106 ix
2.15 Ranked last according to centrality indicators (2/6). . . 107
2.16 Ranked last according to centrality indicators (3/6). . . 108
2.17 Ranked last according to centrality indicators (4/6). . . 108
2.18 Ranked last according to centrality indicators (5/6). . . 109
2.19 Ranked last according to centrality indicators (6/6). . . 109
3.1 Breakdown of examined NACE Sectors.. . . 137
3.2 Emission Reduction Coefficients . . . 139
3.3 Sectoral Emission reduction coefficients for top sectors (excluded). . . . 141
3.4 NACE Sectors . . . 155
3.5 CO2 emissions (Mt) in gross imports by sectors (A-F), year 2015. . . . 156
3.6 CO2 emissions in gross imports, year 2015. . . 157
4.1 Breakdown of examined NACE Sectors.. . . 180
4.2 Emission Coefficients . . . 182
4.3 Sectoral Emission Coefficients for top sectors (excluded). . . 184
4.4 NACE Sectors . . . 196
4.5 Greenhouse gas emissions (Mt CO2 eq.) by sectors (A-F), year 2015 . . 197
4.6 GHG emissions (Mt CO2 eq.), year 2015. . . 198
Preamble
To limit global warming to less than 2°C by the end of the century, economies world-wide must reach carbon neutrality by 2050 (IPCC, 2018). Large scale diffusion of low carbon technologies represents an important component of international strategies to achieve such a target and is largely driven by the implementation of environmental policies (Grantham Research Institute, 2018; OECD, 2018). This thesis builds upon concepts from network theory to investigate both theoretically and empirically diffu-sion dynamics on the path toward a low carbon society. We provide analysis for three different diffusion perspectives : clean technologies, environmental policy and the ef-fects of economic shocks on (imported/generated) emissions. This dissertation comple-ments different strands of the academic literature (network economics, environmental economics) and proposes implications for policy-makers willing to meet objectives set in theParis Agreement(2015). First, it highlights how the structure of networks plays a critical role in diffusion dynamics, whether these networks are social connections, policy flows across states or sectoral economic interactions. The latter is particularly relevant for clean technology spreading (Chapter 1 ), for which underlying social struc-tures affect diffusion in many respects (i.e. adoption, variance, time). Governments willing to maximize the deployment of low carbon products could take advantage of such dimensions when designing public interventions. Regarding environmental policy (Chapter 2 ), the analysis of diffusion across American states strongly emphasizes how
the U.S. as well as the determinants of such observations. Finally, the last two contribu-tions of the present manuscript settle in the context of resurgent calls to limit imported emissions at the EU scale (Chapter 3 ) and the implementation of COVID-19 recovery plans within states of the region (Chapter 4 ). In both cases, we provide insights re-garding the potential benefits of phasing out/not bailing out2 carbon-intensive sectors
in terms of (imported) emission reductions in the whole system. Although results em-phasize the key role of some industries, the network perspective suggests policy-makers should take into account sectoral dependence of downstream sectors (i.e. strength of interactions) when implementing economic instruments targeting GHG intensive sec-tors.
In conclusion, this thesis illustrates how network structures, the positions of embedded agents and the strength of neighborhood connections are critical dimensions to take into account when designing policies aiming at accelerating the green transition.
The remainder of the introduction is structured as follows : we first put in per-spective the notion of interconnectedness into perper-spective by discussing the advent of the COVID-19 crisis to justify the relevance of a network approach when addressing topics of diffusion. We then explore how network theory has slowly become a rele-vant tool in the economic literature addressing diffusion dynamics. We conclude by presenting the contributions of this thesis and their implications in the field of envi-ronmental policy. Overall, this dissertation paves the way to future research at the interface between network economics and climate economics.
2Without clearly defined environmental counterparts.
The advent of the multifaceted COVID-19 crisis (2019) coincides with the critical emergency to tackle climate change (European Central Bank, July 2020; World Eco-nomic Forum, September 2020). Last year, cumulative worldwide emission levels put the environmental system on track for a 3°C temperature rise by the end of the century (United Nations, 2019). Limiting this rise to 1.5°C requires governments to meet the net zero climate target by 2050 (IPCC, 2018).3 Although causing severe economic and
social damages (United Nations, 2020; International Monetary Fund, 2020), the unex-pected COVID-19 pandemic could act as a milestone in the reduction of greenhouse gas emissions over the next decades. In the short run, GHG emissions are expected to fall by around 7% in 2020, representing the annual rate at which our economies should decarbonize to reach carbon neutrality in 2050 (Liu et al., 2020). In the long run, GHG emission trajectories will depend on forthcoming recovery plans (both domestic and/or regional) and their ability to decouple growth and emissions by deploying clean energy sources as well as enlarging and strengthening the corpus of environmental policies (Allan et al., 2020; Hepburn et al., 2020). While the standard environmental policy toolkit provides well-established instruments to pursue such objectives (i.e. command and control measures and market-based incentives, see Kolstad, 2010), policy-makers aiming to match economic recovery objectives with climate targets set in the Paris Agreement (2015) could take advantage of a less investigated nonetheless ubiquitous dimension emphasized by the ongoing pandemic crisis : the increasing interconnect-edness of our social and economic activities (Bazilian and Gross, 2020; OECD, 2020). Years after the 2008 global financial crisis (GFC) dramatically revealed the in-terconnection of banks in the financial system (International Monetary Fund, 2010; Battiston et al., 2012), the COVID-19 pandemic (2020) has highlighted how both our 3‘Net zero’ means that any emissions are balanced by absorbing an equivalent amount from the
atmosphere.
propagating. Firms use each other’s inputs and outputs, engage in joint ventures and compete on markets. Lockdown measures have severely impacted both sides of demand and supply, creating activity contractions from upstream to downstream sectors and vice-versa (eg. from airlines to hospitality sectors and further to local companies), thus leading to numerous bankruptcies (The Economist, March 2020; International Mon-etary Fund, 2020). At the international scale, governments are tied by alliances, by geographical borders, by trade and by cross-border capital/human flows. The latter dimension has played a critical role in the spreading of the virus, leading to mobility restriction measures (Chinazzi et al., 2020; Zhou et al., 2020).
From a broader perspective, modern societies are continuously undergoing over-lapping social and economic diffusion processes. Epidemics, information (Centola, 2010; Thörnberg, 2018), ideas (Haggit et al., 2003; Jackson and Yariv, 2010), innovations (Rogers, 1995), and more recently economic shocks (e.g. surge in energy commod-ity prices, financial risks) are all examples of spreading phenomena. Whatever the mechanism driving diffusion (Young, 2009), such processes propagate on underlying structures, either social (groups of individuals) or economic (industrial value chains, banking system) and the resulting final outcome largely depends on the strength and the pattern of ties. For instance, whether an agent adopts an innovation or not depends on choices made by nearby agents, i.e. our neighbours. However, the (unpriced) effects of these neighbours on our behaviour - externalities - depend on the strength and the pattern of ties between us and our neighbours, on our neighbours’ ties with their neighbours, and so on. From another perspective, research on the propagation of the financial shock during the GFC has demonstrated that the structure of connections within the banking system has driven risk diffusion (Paltalidis et al., 2015; Hale et al., 2016). To capture how these patterns affect diffusion, we should not only consider the direct contacts but also the more general structure of connections in which all
(Elliott et al., 2019).
Networks in Economics : Some perspectives from the
Litera-ture
The Theoretical Advent of Networks in Economics
The analysis ofnetworks in economics started in the 1990s, adding up to game theoret-ical approaches and general equilibrium models (GEM). While the former examine the behaviour of agents in small exclusive groups, the latter provide tools to study large economic systems. At that time, theoretical frameworks in economics were largely built upon concepts derived from either game theory or GEM, thus failing to account for events and phenomena arising between these two extremes. As an illustration, mod-els of diffusion in the 1980s had weaknesses in terms of introspection and failed to match empirical findings (Goyal, 2015). Such observations paved the way for initial attempts to model individuals’ decision-making embedded in a social network. Here-after, I review the design of these first set of settings and show how they depart from received models. I discuss the main insights and relate them to subsequent empirical developments in the field.
Diffusion of ideas, practices or technologies are fundamental for understanding social changes and growth. For decades, economists have investigated diffusion dy-namics through the lens of individual characteristics (heterogeneity) and profitability (cf. the seminal work of Grilliches (1957)). At the beginning of the 1970s, emerging concepts of asymmetries and imperfect informations gained a prominent interest in the field with a burgeoning literature on the economic value of information (Rothschild and Stiglitz, 1976; Grossman and Stiglitz, 1980; Stiglitz, 1985). Starting with imper-fect information, key questions were whether individuals would “acquire” information
optimal action with positive probability. This study marked the beginning of a large current of sophisticated works on single agent learning until the 1990s. Interestingly, a multi-agent literature also developed in parallel. It focused on learning rational ex-pectations and Nash equilibrium. Studies byFudenberg and Levine (1998) andEvans and Honkapohja (2001) fall in this category. In broad terms, this economic literature mainly concentrated on single individuals or groups where interactions were uniform and homogeneous.
However, previous research from various fields of social sciences (e.g. sociology, economic geography, communications) suggested that real world interactions are at the interface between these two situations (Katz and Lazersfeld, 1955;Coleman, 1966; Gra-novetter, 1973, 1974;Ryan and Gross, 1943;Hagerstrand, 1967; andRogers, 1995). In-deed, agents tend to have interactions with a limited subset of the group. These direct connections, their neighbours, are stable and overlap with others’ neighborhoods. For
Coleman(1966) andHagerstand(1967), these neighbors are the conduit through which information and influence circulate, shaping the diffusion dynamics of ideas, innova-tions and practices. Such settings of multiple agents interacting in complex networks make strategic reasoning models (i.e. game theoretical approach) difficult to implement while local interaction in social networks makes anonymous competitive equilibrium analysis implausible. The appearance of this methodological gap to capture behaviour challenged economic theory in the 1980s and motivated new advances. A critical de-velopment to cope with this issue was the introduction of multiple agents making repeated choice, located in a table social network. Seminal works of Bala and Goyal
(1998, 2001) embody such a new strand. Authors developed a framework including models of networks with individual choices and learning dynamics. The original inno-vation was to locate rational individuals in a directed network in which individual are not aware of the true value of different actions. In addition to experiences from the
to evaluate how the structure of underlying social networks affects individual choices and diffusion of actions. From another point of view, a saliant point of their work is the introduction of a wide range of concepts from graph theory (e.g. connectedness, hubs). This combination of individual choice and graphs is central to subsequent works on networks in economics.
Overall, the work of Bala and Goyal (1998, 2001) marks a significant break from the diffusion models implemented in the 1980s. As previously mentioned, economists in the 1980s mainly tried to capture dynamics of single-agent or groups of agents learn-ing. Research in the 1990s provides novel frameworks with the introduction of graphs and related concepts of network analysis, thus allowing academics to examine large interacting social groups with overlapping neighborhoods. This approach appears as a new way of understanding diffusion patterns, for which small-group analysis (game theory) and large-group theoretical approaches were not in adequacy. In other words, networks fall between the “small” and the “large”. So far, this tension has been con-tinuously driving new theoretical research in this field (Goyal, 2015).
Before moving to empirical contributions of network economics on diffusion, it is important to mention that a branch of theoretical and empirical researches has been investigating the issue of network formation4 following the prominent
contribu-tion of Jackson and Wolinsky (1996). This contribution has generated an extensive set of economic applications. Examples include formation and coordination in net-works (Goyal and Vega-Redondo, 2005; Jackson and Watts, 2002), research collabo-ration networks formation (Goyal and Joshi, 2003), collusion networks (Belleflamme and Bloch, 2004), information networks (Galeotti and Goyal, 2010), labor market networks (Calvo-Armengol, 2004; Calvo-Armengol and Jackson, 2004), financial net-works (Cabrales et al., 2012; Farboodi, 2014), free-trade agreement networks (Goyal
4Although not studied in this manuscript.
Ozdaglar, 2014). For a general review of advances and applications in network eco-nomics,Jackson (2008) and Bramoullé et al. (2016) provide insightful elements.
Diffusion in Networks : Evidence from the field
Following the increasing body of theoretical literature in network economics, an empiri-cal strand of the literature addressing questions related to the role of social interactions on diffusion patterns has flourished. Major contributions came from economists in the field of development economics that investigated the impact of peer effects and social networks on learning and diffusion of new products, practices and technologies. Promi-nent examples includeBandiera and Rasul(2006),Munshi(2004),Kremer and Miguel
(2007) andDuflo et al. (2011). More recently, empirical research covered specific ques-tions about underlying social networks (e.g. the impact of neighbors’ behaviour on individual decision (Conley and Udry; 2010), optimal seeding strategy to maximise diffusion (Banerjee et al., 2013)). Moreover, very recent works have emphasized the contagious feature of technology adoption in social networks (Baranzini et al., 2017;
Beaman et al.; 2018). In the following, I specifically review these original findings as they critically embody how network theory applied in the field - and thus acting as a ground-breaking approach - could guide policy interventions.
In the literature of economic development, a common issue to investigate is the diffusion of new products, be they crop technologies, insurances, with the objective of enhancing productivity and alleviating poverty.Conley and Udry(2010) focused on the diffusion of a new agricultural technology among farmers in Ghana. They innovated by investigating the role of social learning in the adoption of a crop innovation. To do so, they collected a description of farmers’ information neighborhood to reconstruct underlying social networks and assess the impact of neighbours’ behaviour on the
duced another but known technology crop for which they observe no learning.Conley and Udryconclude that information has value in these villages, as do network connec-tions through which information about the innovation flows. From another perspective,
Banerjee et al. (2013) evaluated the diffusion of micro-finance practices in 43 Indian villages, with information on underlying social networks. They were interested in as-sessing the role of initial seeded individuals in the network (i.e. injection point) on diffusion dynamics. After varying such injection points of information across different villages, they found that diffusion of micro-finance practice is larger when seeded agent displays high eigenvector centrality in the village. In other words, targeting individuals that are in contact with well-connected individuals in the village (e.g. village leaders) increases diffusion of the practice. These two major contributions empirically show that underlying social networks have a prominent role in the diffusion of innovations while, depending on their positions in such networks, individuals targeted in the first period to introduce a new behaviour (e.g. injection point for micro-finance) define the future dynamics of diffusion. Overall, such works mark the departure of studies on the explicit treatment of network architecture.
More recently,Beaman et al. (2018) focused on inducing farmers to adopt a productive new agricultural technology by implementing contagion models on rich social network data from 200 villages in Malawi. The main objective was to identify seed farmers to target in order to reach high levels of diffusion. To do so, they carried out a randomized controlled trial to compare theory-driven network targeting approaches and simpler strategies that either rely on a government extension worker or an easily measurable proxy for the social network (geographic distance between households). Interestingly, results are consistent with a complex contagion model in which many farmers need to learn from multiple people before they adopt the technology themselves. This means that without proper targeting of information, the diffusion process can stall and
nology from multiple people before they adopt it themselves. As a result, innovation in social networks tends to be diffused following an epidemiological pattern of trans-mission. The latter dimension is developed in the next section, lying at the core of this thesis’ contribution.
As a summary, the emergence of network theory in economics started in the 1990s with the first set of models incorporating individual choice and network struc-tures within a common framework. By implementing concepts and insights from graph theory, it marks a major advance in the theoretical framework of diffusion analysis and brings concepts of graph theory into the mainstream of economics. In the wake of these theoretical works, an empirical literature has developed investigating the role of social networks on diffusion patterns of practices, information and innovations. The research discussed above emphasizes several elements : how structures of social networks af-fect diffusion patterns; the role of initial seeds to launch a diffusion process; and the contagious feature of technology diffusion in networks. In the following section, we cen-ter our approach on the potential benefits network economics could bring to increase the understanding of spreading phenomena aiming at combating climate change. We present our contributions for clean technologies (Chapter 1 ), environmental policies (Chapter 2 ) and economic shock impacts on emissions (Chapter 3 ; Chapter 4 ).
Network Economics and Diffusion : On the Path
towards a Net Zero Society
The four contributions of this thesis complement each other in the objective of offering a global picture on how network theory could enhance the understanding of diffusion processes on the path toward a low-carbon society. By investigating the case green
they social, policy flows or economic interactions), the location of embedded agents and the strength of connections affect diffusion processes. Such findings provide key elements to pro-environmental policy-makers willing to implement effective interven-tions related to diffusion issues.
Low Carbon Technologies and the role of underlying social
structures
In 2018, a special report from the Intergovernmental Panel on Climate Change (IPCC) revealed that there is still a window to reduce GHG and limit climate change to manageable levels. Among other elements, accelerating the deployment of low carbon technologies to decarbonize energy systems is a key dimension of the strategy. Nu-merous technological products are already available on the market (Hötte, 2019). So far, we have pointed to the fact that both behaviours and technologies are diffused via social interactions. In the academic literature, many papers have theoretically and empirically investigated the situation in which reinforcing choices lead to accelerating diffusion of a behavioural pattern or technology once a critical threshold in the popula-tion has been reached (Currarini et al., 2014). In marketing and fashion, such a process is referred to as "bandwagon effects" (Leibenstein, 1950), “positive feedback trading” in finance (Barberis and Shleifer, 2003), while in the literature of contagious diffusion, individuals’ adoption thresholds (Granovetter, 1978), "network externalities", "social reinforcement", and "cascades" (Watts, 2002; Lim et al., 2016) are most commonly used. The common ground of such approaches is the deeply rooted opinion that dif-fusion of behaviours and technologies follows the same pattern as epidemics. In other words, there exists a contagious feature in technology and behaviour spreading and agents have an adoption threshold that is a positive function of the number of other adopters (cf. Bass model (1969) for seminal work).
processes are frequently identified : "simple contagion" and "complex contagion" dy-namics (Centola and Macy, 2007). While the former requires only one contact for trans-mission (e.g. information, disease), the latter calls for multiple sources of reinforcement to induce adoption (e.g. behavior, technology). On this issue,Centola and Macy(2007) demonstrated that the impact of the underlying network structure changes according to the diffusion process operating. While direct connections between agents (i.e. a short path) allow for simple contagion phenomena to spread faster, clustering (i.e. the tendency for nodes to form small groups) is a determinant of diffusion under complex contagion scenarios (Centola, 2018; Beaman et al., 2018). Then, whether the goal is to reduce the risk of contagion or to maximize the adoption of a technology, understand-ing how network structures affect diffusion cascades (i.e. propagation) is relevant for effective policy design.
In the context of global warming, investigating contagion of clean technologies in social networks is relevant. The latter are subject to effects of learning (i.e. costs tend to drop exponentially, at different rates that depend on the technology (Farmer and Lafond, 2016)), making the analysis original in terms of diffusion. Moreover, tech-nologies such as solar PV and wind turbines must be deployed at a large scale to limit global warming "well-below" 2°C by the end of the 21st century (OECD, 2016). If the existing literature on green technology diffusion is large, little attention has been paid to network perspectives (Halleck-Vega and Mandel, 2018). Moreover, questions related to the spreading of a costly technology in social networks (i.e. network of individuals) and the associated impacts of a network’s structure on diffusion remain unstudied. In the case of low-carbon technologies, these aspects are relevant as public policies are used to support their deployment (e.g. economic instruments supporting solar PV, biogas technology, see Blazquez, 2018for a review). Understanding how these innova-tions spread in networks could bring new insights for designing efficient and cost saving
As such, this thesis’ first contribution is to theoretically evaluate the contagion pattern of clean technologies in social networks. We propose a generalization of the
Watts model (2002), a well-established contagion model implemented in the litera-ture, to investigate how underlying social networks influence diffusion dynamics. Our main innovation is the introduction of a technology cost function which is subject to learning effects. Based on this, an agent will adopt the product if a certain amount of his neighbors has adopted it and if he can afford the technology. Regarding our main results, aggregate diffusion reaches higher levels in highly clustered networks. The latter confirms the critical role of clustering in favouring propagation in networks. In-terestingly, we also find that adoption cascades in clustered networks are subject to greater variability (variance) with respect to final outcomes (i.e. adopters). The lat-ter result has strong implications for public policy implementation. For governments interested in maximising diffusion of green technologies, there exists a real tension between achieving a large spreading and uncertainty in results. We argue that imple-menting economic instruments to increase affordability of the technology for agents less able to afford the product would limit such uncertainty. In less clustered social structures, although propagation reaches lower levels, it occurs at an equivalent speed as in clustered networks with a lower variability in final outcomes.
As regards policy takeaways, the use of data from social platforms would allow governments to design actions while being aware of underlying social structures. As these platforms grow, there is a new potential to construct tools to design more ef-fective policies in a wide range of topic (e.g. epidemic transmission, information and technology flows). With respect to the technology, whatever the underlying structure, higher learning rates lead to larger adoption. Such findings emphasize the critical role of governments in supporting the "good" product. We further discuss key policy
cilitate diffusion. Overall, this chapter theoretically shows how the shape of underlying social structures impact the contagion of a costly clean technology. The second contri-bution proposes an analysis of environmental policy spreading, emphasizing another critical dimension : the position of heterogeneous agents in networks.
Diffusion of Green Policies in the U.S. : A matter of Location
in Networks
The worldwide deployment of environmental technologies is largely driven by the dif-fusion of environmental policies (International Renewable Energy Agency, 2018). With respect to past research on policy adoption, the case of American states has attracted a lot of interests. Indeed, federalism is a peculiar political environment as it pro-vides a certain amount of legislative autonomy to member states, encouraging them to compete with or learn from one another (see Berry and Berry, 1990 for descrip-tion). The states are connected in many ways, including history, culture, the exchange of goods, citizens’ migration, and overlapping media markets (Gray, 1973;Shipan and Volden, 2012). A key result of these features is that states tend to "look to each other" when making policy (Desmarais et al., 2015).
For the specific case of environmental and climate policies, political scientists as well as sociologists have classified the drivers of adoption as either internal (e.g. extreme climate events, pro-climate groups) or external (e.g. states’ bilateral/international agreements). As a result, many previous works have investigated the factors that in-fluence policy adoption from a state-based perspective. A limit to this approach is to fall short on capturing national dynamics of diffusion, thus leaving unclear how envi-ronmental policies spread. For instance, is there any existing diffusion pattern across American states ? (e.g. once California has enacted a set of policies, do we observe
whole country). In the context of global warming, answering these questions is relevant for at least two reasons. First, it would enhance the understanding of how diffusion behaves in the U.S. by observing a national scale process (i.e. diffusion patterns). Sec-ondly, identifying states facilitating the spread of environmental policies across the U.S. would bring multiple benefits. Among these, targeting such states (i.e. governor, representatives) to maximize the likelihood of diffusion at a larger scale would be a relevant strategy for various types of actors (e.g. NGOs, citizens, companies’ represen-tatives), especially those interested in passing pro-environmental laws in "big emitter" states. From another perspective, it would also bring insights to private firms on the possible pattern of environmental regulation diffusion. As differences in legislation across states drive day-to-day business decisions of private actors (e.g. investments, market strategy etc.), addressing this issue is critical in that respect too (Bradbury et al., 1997).
Based on these observations, the second contribution is to propose a methodol-ogy based on an epidemic-like model to estimate the network of environmental policy diffusion across American states and evaluate the determinants from adoption data. By doing so, we enhance the body of knowledge of environmental policy diffusion and give policy-makers insights to maximize the spreading of green policies in the U.S.. We infer environmental policy diffusion patterns from a constructed dataset of 74 green policies (e.g. energy, climate, waste recycling) from 1974 to 2018. After constructing a second database of economic, political as well as environmental features for each considered state, we have combined both of them in order to estimate the determinants of the network (of environmental policy flows). Precisely, we estimate, via maximum likeli-hood, the parameters that best explain the observed patterns of environmental policy diffusion at the U.S. scale. Findings emphasize the central role of Minnesota, California and Florida in the diffusion process while Alaska, South Carolina and South Dakota
2019). Results also suggest a disconnected dynamic of policy transmission between states belonging to the Northeastern region and the rest of the country. Mainly, East-ern states tend to influence each other and are not sensitive to legislative actions occurring outside their region. With respect to the determinants of the network, we find that contiguity, GDP per capita and Genuine Progress Indicator are key drivers of environmental policy diffusion. It is also found that the level of expected cost of climate change has a negative impact on the diffusion likelihood among considered states. Overall, this contribution offers an in-depth analysis of the environmental pol-icy diffusion network in the U.S., calling for regular updates to capture new emerging dynamics. It also highlights how positions of states within the network of policy flows drive the diffusion of green policies. To go on exploring other features of diffusion in networks, the last two contributions offer a network approach of economic interactions across industrial systems. They highlight how the strength of connections could act as a conduit to reduce emissions following a contraction of activity in a specific sector.
Economic shocks and Emissions
Chapter 3 and Chapter 4 propose a similar methodology - combining network theory and input output analysis - to provide novel insights on the topic of reducing industrial imported emissions and emissions rebound following the implementation of COVID-19 recovery packages.
Triggering reductions of imported emissions in connected sectors
In December 2019, the presentation of the EU Green Deal project has brought back the issue of imported emissions in the E.U. political debate. The resurgent European interest in designing border adjustment mechanisms to limit such dynamics has been widely commented, especially by European trade partners. Such an economic
site to reach the climate objectives set in the Paris Agreement (2015) (Görlach and Zelljadt, 2019).
In academia, the topic of imported emissions has gained particular attention over the last decade as several studies point out a critical disconnection between territorial and consumption-based emissions (Barrett et al., 2013; Karstensen et al., 2018). Re-garding E.U. countries, France provides a good example of such dynamics : consumption-based emissions per capita have remained stable over the last two decades (11.5 Mt of CO2) while territorial emissions have fallen, suggesting an increase in imported
emissions (Haut Conseil pour le Climat, October 2020). These figures highlight the re-sponsibility of such states in driving foreign countries’ territorial emissions, therefore challenging the success of domestic environmental policies addressing carbon leak-age. While an expanding literature has been investigating both the economic reper-cussions of instruments targeting imported emissions and possible legislative designs, less attention has been devoted to understanding the potential reduction of imported emissions resulting from a loss of activity in a sector, and how this would cascade within a network of economic sectors’ interdependencies.
The third contribution of this thesis provides a framework to quantify, in the short run, the amount of emission reductions in a sector that could be the result of a reduction in primary inputs flowing into another sector (i.e. a contraction of activ-ity). Based on OECD data available for five European countries (France, Germany, Italy, Poland and the United Kingdom), this chapter shows that industries exhibit-ing the largest “emission reduction coefficients” are minexhibit-ing activities, basic metals and computer and electronics. Such results were expected as these activities exhibit high imported emission intensities, leading to significant amounts of internal emission reductions. When focusing on external coefficients to examine sectors likely to have
particularly relevant. As these sectors provide large amounts of essential inputs to other sectors with high imported emission intensity, these findings are consistent too. Using network theory, this contribution also identifies the cascading process of im-ported emission reductions due to a contraction of activity in mining. Results suggest that moving away from fossil fuels would have a particularly strong effect on sec-tors linked to coke and refined petroleum products, basic metals and electricity and gas. Those sectors display the strongest economic connections with mining (i.e. proxi-mate neighbors). The latter acts as a proxy approach of sectoral exposure to phasing-out dirty industries. For exposed sectors, it emphasizes the importance of future shifts in their input consumption toward cleaner products to avoid stranded assets. Finally, this chapter examines the impact of a $25 carbon tax on imported basic metals. It highlights that exposed industries are identical across countries, with basic metals and fabricated metal products taking the first ranks. However, the strength of the sectoral exposure is unequal across economies (e.g. fabricated metal activity is more affected in Poland compare to those in France or the U.K). In the short run, the latter suggests different cost on economies following the implementation of such a uniform tax. This outcome gives insights to understand the position of E.U. countries with respect to the implementation of such policies.
Finally, the last contribution follows the methodology of Chapter 3 to identify industries that should not be targeted by governments’ recovery packages (without environmental counterparts) in order to avoid a GHG emission rebound. Again, a critical dimension pointed by the following research is the need for industrial sectors heavily relying on dirty sectors (i.e. strong connections with dirty sectors) to clean their inputs in the coming years.
duced by governments in the EU. These packages will shape EU’s future prosperity and determine if targets recently set in the Green Deal (European Commission, 2019) will be met on time. In this last contribution, we apply the approach developed in Chapter 3 to identify industrial sectors that, if governments wish to decouple growth and emissions in the coming decades, should not benefit from forthcoming economic stimuli. If mining activities play a significant role (by providing inputs to other sec-tors), other GHG intensive industries will have a particular contribution to meet the Paris Agreement targets. For those sectors, forthcoming economic stimuli (e.g. public investments) should be conditional on these industries developing a measurable plan to limit GHG emissions in the future. Coke and refined petroleum products, chemicals, other non-metallic mineral products, basic metals and electricity and gas are the most GHG intensive sectors of our sample (France, Germany, Italy, Poland and Spain). A decrease in their inputs (supplied by mining) generates large amounts of avoided emis-sions. In those activities, the key challenge for forthcoming recovery plans is to ensure a shift from dirty to low carbon inputs.
The contribution also discusses some policy recommendations to decarbonize inputs of such sectors (e.g. storage capacity, R&D in electricity and gas activities). At the EU regional scale, a major issue to come is the allocation of such recovery funds across states - and further, sectors to benefit from such funds within national economies. In this chapter, we show that economies display differences in terms of industrial struc-tures and GHG emission levels. The latter calls for different national approaches to tackle GHG emissions. If some countries have a large share of mining inputs in the energy mix (e.g. Germany and Poland), a uniform implementation of tools to meet the EU targets would cause heterogeneous impacts across economies, likely reinforcing eco-nomic and political divisions within the Union. In the coming months, the European Commission will have to be aware of such differences when evaluating the effectiveness
have a strong impact on the EU’s ability to meet its legally mandated environmental targets.
Network Structures, Environmental
Technology and Social Contagion
* * *
We represent a social system as a network of agents and model the process of technol-ogy diffusion as a contagion propagating in such a network. By setting the necessary conditions for an agent to switch (i.e. to adopt the technology), we address the question of how to maximize the contagion of a technology subject to learning effects (e.g. solar PV) in a network of agents. We focus the analysis on the influence of the network struc-ture and technological learning on diffusion. Our numerical results show that clusters of agents are critical in the process of technology contagion although they generate high levels of variance in aggregate diffusion. Whatever the network structure, learning effects ease the technology contagion in social networks.
* * *
This chapter is an adaptation of a research paper currently "Revised and Resubmitted" in Climate Policy.
1.1
Introduction
Research on diffusion in social and economic networks has focused on a wide range of topics such as diseases (Klovdhal, 1985), rumors (Moreno, 2004), systemic risks of bank failures (Elliott et al., 2014; Eboli, 2019), platform adoption (David, 1985) and patenting (Aghion, 2015). These phenomena are, at least temporarily, irreversible and share common features. First, diffusion is a social process and an individual’s adoption behavior is highly correlated with the behavior of her contacts (i.e. network externalities). Second, the structure of the network plays a critical role in the propa-gation dynamics. While some processes remain contained in isolated clusters, others spread to the whole network. Overall, these phenomena are path-dependent : their ir-reversibility means that early history matters for the final outcome (Lim et al., 2016). With respect to dynamics of propagation in networks, two main diffusion pro-cesses are frequently identified : "simple contagion" and "complex contagion" dynamics (Centola and Macy, 2007). If the former requires only one contact for transmission (e.g. information, disease), the latter calls for multiple sources of reinforcement to in-duce adoption (e.g. behavior, technology). On this issue, Centola and Macy (2007) demonstrated that the impact of the underlying network structure changes accord-ing to the diffusion process operataccord-ing. While direct connections between agents (i.e. a short path) allow for simple contagion phenomena to spread faster, clustering (i.e. the tendency for nodes to form small groups) is a determinant of diffusion under complex contagion scenarios (Beaman et al., 2018; Centola, 2018). Then, whether the goal is to reduce contagion risk or to maximize adoption of a technology, understanding how
network structures affect diffusion cascades (i.e. propagation)1 is relevant for effective policy design.
A critical issue to explore for network studies is the case of technology diffusion (Halleck Vega et al., 2018). Particularly, technologies subject to effects of learning (i.e. costs tend to drop exponentially, at different rates that depend on the tech-nology)2 are of great interest as they are operating in different sectors (Farmer and
Lafond, 2016). For instance, this is the case for renewables (e.g. solar PV, wind tur-bines, see IRENA, 2016) that must be deployed at a large scale to limit global warm-ing "well-below" 2°C by the end of the 21st century (OECD, 2016). If the existing literature on technology diffusion is large, little attention has been paid to network perspectives (Halleck-Vega and Mandel, 2018). In particular, questions related to the spreading of a costly technology in social networks (i.e. network of individuals) and the associated impacts of network structures on diffusion remain unstudied. For the case of clean technologies, these aspects are critical as public policies support the de-ployment by implementing economic instruments (e.g. solar PV, biogas technology, see
Blazquez, 2018). Understanding how these costly innovations spread in networks could bring new insights for designing efficient and cost saving policies. From another per-spective, addressing these issues provide new perspectives on how to achieve a faster deployment of low carbon goods. In the context of climate change, increasing this body of knowledge is of great importance too.
In order to evaluate technological propagation in social networks, we build upon the Linear Threshold Model (LTM) exposed by Granovetter (1978). Our main theo-retical innovation is the introduction of a technology cost function subject to learning effects. The latter gives to our approach a large scope of applications (e.g. renew-ables). In our agent-based model, we call "a switch" an irreversible transition to new state, such as adoption of the technology (Jackson, 2008). All agents in the network
1In this paper, we call "cascade" the dynamics of diffusion. 2SeeFarmer and Lafond(2016).
are initially switched off. Then, some agents are randomly switched, i.e., seeded. Ev-ery heterogeneous agent in the network is endowed with two individual thresholds. We assume that agents’ thresholds are randomly and independently drawn from a uni-form distribution at the start of the cascade (Kempe et al., 2003). In the following periods, if the cost of the technology falls below his first threshold and if the propor-tion of neighbors that switches exceeds his second threshold, the agent also switches (Granovetter, 1978;Schelling, 1978). This process propagates through the network. In our approach, one can consider neighbors as agents with shared proximity (e.g. ge-ographic, relationship, regular contacts). Moreover, once an agent has switched, he remains switched forever. This assumption matches clean technologies investments (e.g. solar PV, biogas installation in agriculture) for which buyers cannot easily step away.
Our model assumes that agents react to stimuli both from the local and global environments (i.e. neighborhood and cost dynamics). If the social threshold is widely documented in the literature on complex contagion and threshold models ( Granovet-ter, 1978;Watts, 2002;Dodds and Watts, 2004), we assume agents’ ability to afford the technology to differ. To capture this feature, we introduce a cost threshold as a proxy measure. By doing so, we can investigate the diffusion of a costly product in social networks of heterogeneous agents. Our setting, a generalization of the Watts model
(2002), is relevant as recent studies shed lights on the contagious feature of renewable technology adoption (seeBaranzini et al., 2017). We consider technology spreading as an epidemic dynamics processing among agents in a network (Collantes, 2007). Then, our framework is intertwined with the "complex contagion" modelling approach as the distribution of neighborhood thresholds will require, in most cases, multiple neighbors having switched to make the considered agent switch.
With respect to underlying social structures, we apply our contagion model to three different classes of networks : lattice, small-world and random networks - as
constructed by Watts and Strogatz (1998).3 By doing so, we can investigate at a macroscopic level how diffusion spreads according to network clustering, path length and technological learning. If the notion of path length is obvious (average distance between any pair of two random agents), clustering refers to the share of peers of each node being peers among themselves (Acemoglu et al., 2011). In the literature on diffusion in networks, clustering has been extensively considered to capture the im-pact of network structures on diffusion (Centola and Macy, 2007;Centola, 2010; Ace-moglu, 2011;Beaman et al., 2018). For our purpose, this approach is relevant as social networks tend to exhibit high levels of clustering (Watts and Strogatz, 1998; Levine and Kurzban, 2006). Therefrom, our comparative approach allows us to evaluate aggre-gate levels of diffusion, associated cascades’ lengths and adoption speed of convergence from low to highly clustered networks.
Our main results suggest that aggregate diffusion reaches higher levels in lattice and small-world networks compared to random networks. The latter confirms the crit-ical role of clustering in favouring propagation in networks. Interestingly, we also find that adoption cascades in clustered networks are subject to greater variability (vari-ance) with respect to final outcomes (i.e. adopters). The latter has strong implications for public policy implementation. Indeed, for governments interested in maximising diffusion of, for instance, green technologies, there exists a real tension between max-imising spreading and uncertainty in results. We argue that implementing economic instruments aiming at increasing affordability of the technology would limit such un-certainty. In random networks, although propagation reaches lower levels, it processes at an equivalent speed - compared to clustered networks - with a lower variability in final outcomes. In practice, the use of data from social platforms would allow govern-ments to design policies while being aware of underlying social structures. As these platforms grow, there is a new potential to construct tools to design more effective 3Remember that lattice networks exhibit high levels of clustering and (comparatively) very long
path length; small-world structures demonstrate high level of clustering but with lower average path length; random networks are subject to low clustering and low average path length.
policies to increase the exposure of agents to clean products. For instance, govern-ments could match data from social platforms and technology buyers to target groups in which the product has not percolated yet. With respect to the technology, whatever the underlying structure, higher learning rates lead to larger adoption. Such findings emphasize the critical role of governments in supporting the "good" product. Further policy implications of our results are developed in the conclusion part (Section 4) of this chapter.
The theoretical literature on cascades and diffusion in networks is vast. Ir-reversibility of our cascade dynamics (i.e. diffusion) sets the present paper apart as a considerable part of research supposes that agents can switch multiple times (Ellison, 1993; Blume, 1995; Young, 2006; Montanari and Saberi, 2010; Adam et al., 2012). Moreover, the double diffusion-reinforcing feedback that we introduce has, to our knowledge, never been implemented so far. Indeed, diffusion itself makes it eas-ier for others to adopt because of the social threshold, and learning makes it easeas-ier to adopt because of the cost threshold. In contrast to some of the previous work ( Ace-moglu et al., 2011;Yildiz et al., 2011;Singh et al., 2013), we do not look at a particular instance of a distribution of thresholds. Instead, we assume that agents’ thresholds are randomly and independently drawn from uniform probability distributions at the start of the cascade (Kempe et al., 2003). This is a reasonable assumption if the social plan-ner has no reason to believe that some thresholds are more likely than others (Lim et al., 2016). Moreover, papers mentioned earlier (e.g. Blume, 1993; Ellison, 1993;
Blume, 1995; Young, 2006; Montanari and Saberi, 2010; Adam et al., 2012) usually assume that agents play a coordination game with their neighbors and analyze the dy-namics using tools from game theory. For certain problems, such as the possibility of contagion, the models are equivalent (Morris, 2000;Watts, 2002;Lelarge, 2012;Adam et al., 2012).
On the issue of technology diffusion, a recent survey on the diffusion of green technol-ogy pointed out the fundamental role of networks (Allan et al., 2014). In some of the
previous works mentioned, models of innovation and technology diffusion (e.g.Centola et al., 2007; Montanari and Saberi, 2010; Acemoglu et al., 2011) provide insights on the influence of the network topology on propagation dynamics. These models consider a wide range of diffusion processes ranging from epidemic-like contagion to strategic adoption and linear threshold models. Under complex contagion, research suggests that innovations spread further across networks with a higher degree of clustering. Clusters can promote diffusion where a seed node exists inside them, but are more difficult to permeate when not targeted during the initial seeding phase (Halleck-Vega and Man-del, 2018).
By implementing the linear threshold model and introducing a technology cost func-tion, we complement the literature and contribute to a better understanding of tech-nology diffusion dynamics. We are dealing with large complex networks of agents interacting and switching over time (Centola et al., 2007; Centola, 2010; Acemoglu et al., 2011). As carried out in the literature, we implement our agent-based model and provide numerical analysis to capture cascades’ features and build our comparative evaluation.
We proceed as follows. Section 2 describes the Watts-Strogatz algorithm (1998) to create selected networks and expose the linear threshold model.Section 3shows and analyses numerical outcomes in terms of average aggregate adoption, speed of diffusion and time of convergence for the three classes of networks. The relevant government seeding strategy with respect to the amount of initial seeds is presented too. Finally,
Section 4 discusses the main findings as well as relevant policy implications and lays out some directions for future research.
1.2
Model of Cascades in Networks
In this section, we present the Watts-Strogatz algorithm to generate lattice, small-world and random network. We then expose our two-threshold model of contagion in networks.
1.2.1
The Network
The algorithm of Watts and Strogatz (1998) is a powerful tool to create constant network density graphs ranging from nearest-neighbor networks (lattice) to uniform degree random networks. As exposed in Cowan and Jonard (2004), we assume that I =n
1,...,No
represent a set of agents and for anyi, j ∈ I, we define the binary variable χ(i, j) such that χ(i, j)=1 if a connection exists between i and j, and χ(i, j)=0, if there is no connection. Therefrom, the resulting network G =nχ(i, j); i, j ∈ Io represents all pairwise connections between agents. The neighborhood of an agent i is the total amount of her connections Γi =nj ∈ I : χ(i, j)=1o while a path in G connecting i and j is a set of pairwise relationships n
(i, i1),...,(ik, j) o
such that χ(i, i1) =...=
χ(ik, j)=1. Finally, the distance d(i, j) between i and j is captured by the shortest
path between them.
To generate the lattice with n nearest neighbors, we consider each edge of the graph and allocate a probability p to disconnect one of its edges, and connect it to a node selected uniformly at random (with no self-connection (loop) and only one connection between two agents). By settingp, we vary the graph structure from com-pletely regular (lattice networks with p=0), through intermediate states (0<p<1), to totally disordered (random networks with p=1). By doing so, we change the number of edges per agent, keeping constant an average ofn connections per agent and a total of Nn/2 edges, ∀p. We denote the final network produced to be G(n;p). Figure 1.1 below shows three configurations with increasing disorder asp is increased, for N =20 and n=6.
![Figure 1.15: Aggregate adoption and heterogeneity for different scenarios of cost threshold distribution over specific intervals (0,1;1); (0,2;1); (0,3;1); (0,5;1); (0,7;1), with S 0 =[5]](https://thumb-eu.123doks.com/thumbv2/123doknet/13782994.439797/78.892.225.649.275.975/aggregate-adoption-heterogeneity-different-scenarios-threshold-distribution-intervals.webp)