t500RiW;0z003 0 0 0 aJ 00
;0 D!
ff-
;- --9/t4
S :
MASSCHETSINSTITUT
~-~~nOF
TEHNOLOGY.::
~
..·
·I-i ·. ·. I·- .: -·-· `·-i-.·r ' ' ; ··-:·. .·· ·- ·- · ;; I; · : · ' t :··I· :. · )' I-..' .: c , · s -·· i-.:- ·`·.·- . -· · . 'I ·-i : i... r"'· ·-:;:·Control Systems* by
Cady C. Chung and Nathan Gartner OR 015-73
March 1973
Operations Research Center Massachusetts Institute of Technology
Cambridge, Massachusetts 02139
Research supported by KLD Associates, Inc., in connection with Department of Transportation Contract FH-11-7924.
Acceleration Noise measures the disutility associated with successive decelerations and accelerations in a signalized environment. It provides an indication of the smoothness of traffic flow. As such it constitutes a generalization of the number-of-stops concept and is suitable to replace it as an additive measure-of-effectiveness for designing and evaluating the operation of traffic control systems.
This report develops models for calculating the acceleration noise in-curred by a platoon of vehicles travelling along a signal-controlled traffic link. Several flow patterns are analyzed: discrete arrivals, uniform-continuous arrivals and variable-uniform-continuous arrivals. A computer program and test results are described. The models can be easily extended for use in signal- controlled networks.
1. Introduction and Definition of Acceleration Noise 1 2. Acceleration Noise of a Single Vehicle at a
Signalize d Inter se ction 3
3. Acceleration Noise with Shock Wave Assumptions 6
4. AN - Additional Assumptions 18
5. Computer Model and Program to Calculate
Acceleration Noise for Continuous Flow Patterns 26
Appendix A: The Computer Program 33
Appendix B: Sample Results 36
1. INTRODUCTION AND DEFINITION OF ACCELERATION NOISE (AN) Motorists on a transportation facility very often evaluate the facility by the speed at which they can travel and by the uniformity of the speed.
Travelers in a. vehicle will feel most comfortable if the vehicle is driven at a uniform speed. When the traffic on a highway is very light, a driver generally attempts, consciously or unconsciously, to maintain a rather uniform speed, but he never quite succeeds. He has to accelerate and
decelerate occasionally instead. The distribution of his accelerations (deceleration is minus acceleration) essentially follows a normal distribu-tion (see, e.g., Ref. 1).
From recent research results (1-5), the acceleration noise (AN) has proved to be a possible measurement for the smoothness or the quality of traffic flow. AN is defined as the standard deviation of the accelerations. It can be considered as the disturbance of the vehicle's speed from a uniform
speed.
Mathematically, the standard deviation of a set of n numbers X1 X2 . . . ,X is denoted by S and is defined as:
s'
X n.[n
E(
X'where X denotes the mean of the X's.
If a(ti) denotes the acceleration of a vehicle at time t, the number of t's or the total time period is equal to
Z
t
=T
and the average acceleration of the vehicle or a trip-time T is
and the average acceleration of the vehicle for a trip-time T is
a ve.
LI
T
a( t)
At
/0
Thus, mathematically, the acceleration noise can be written as:
I a
( t)
a veJ
2Ct
o
_' I"
=T
]
2J
t
It can be proved that
11
a
(t)3
0
at -
(ave.
)
and since a
ave. approaches zero for any prolonged journey, the AN is normally calculated by
CY
--
T
.
I
[
(t)3 dt
where T is modified to denote the running time only. The reason is that if a vehicle is stopped for some part of the journey, the AN (a time average) will and 2 =
T
T
I
______11 II
a
( f" )
-
aV-I.
TT
be arbitrarily smaller if T includes the entire period (1, 3, 4).
The accelerations of a vehicle can be measured directly by an
accelerometer or approximated from a speed-time trajectory of the vehicle's trip (3 - 5).
AN measures the disutility associated with successive decelerations and accelerations in a signalized environment. As such it constitutes a
generalization of the number-of-stops concept and is intended to replace it as an additive measure-of-effectiveness for signal-controlled traffic net-works. It will be used primarily in conjunction with delay times (see Ref. (6 - 8)). The present report develops models for calculating the AN incurred by a platoon of vehicles traveling along a signalized traffic link.
Several flow patterns are analyzed: discrete arrivals, uniform--continuous arrivals and variable--continuous arrivals. The models can be easily extended for use in networks.
2. ACCELERATION NOISE OF A SINGLE VEHICLE AT A SIGNALIZED
INTERSE CTION
Let us first consider a single vehicle arriving at a signalized inter-se ction.
Let
c = cycle length (sec.)
g = effective green time (sec.) r = effective red time (sec.) c = g+ r
-If we denote the beginning of a red period by t = -r, the beginning of the following green period will be t = 0, and the end of this cycle will be t = +g.
Assuming that:
d = deceleration rate (ft/sec.I
a = acceleration rate (ft/sec.-) v = normal driving speed (ft/sec.)
a
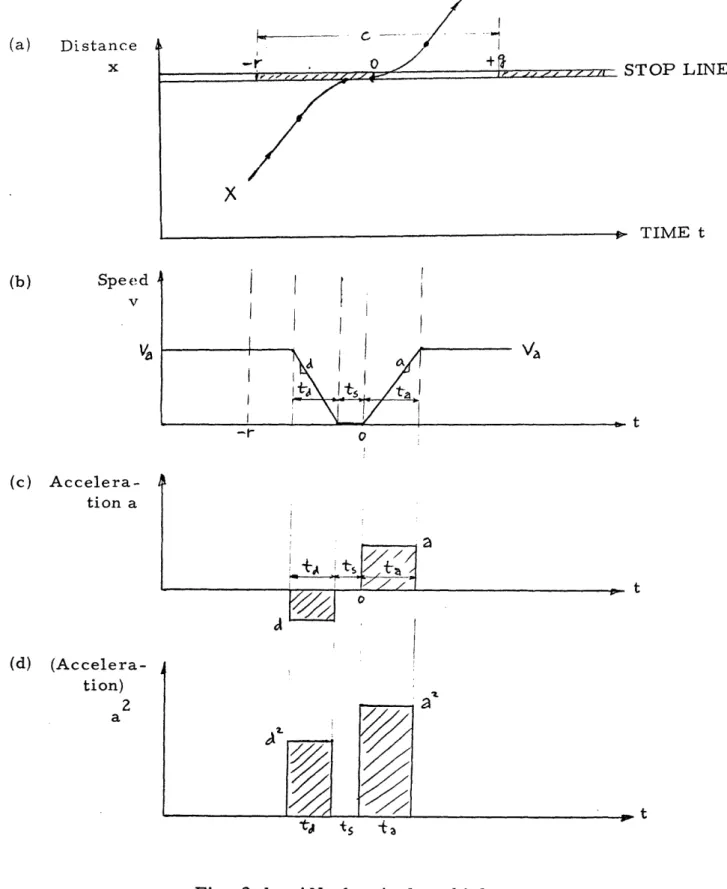
We assume that the vehicle approaches the intersection at a constant speed va . If the signal aspect is red the vehicle decelerates at a constant rate d to a full stop. As the signal turns green, it accelerates to the driving speed v at a constant rate a.
a Let
td = deceleration time (sec.) t = acceleration time (sec.)
a
t = stopped time (sec.) T = td+t a
Referring to Fig. 2.1 we have
t v /d
d a
t = Va/a
a a
and the acceleration noise Tr is:
I
=
f
|
t
f,
dt
3
d2t
t
ta
Y
--J ta
Distance x Speed v
Va
A- -- c STOP LINEX
* TIME t -F 0 t (c) Accelera-tion a (d) (Accelera-tion) 2 aa
IA tsLi
2. 0a
tFig. 2.1 - AN of a single vehicle at a
signalized intersection; (a) vehicle trajectory; (b) speed variations; i.e., (d) deceleration-acceleration graphs (a) (b) __ - 77- /_ 7 , , Z 4 4 - Ir - Z .1 / /I ,7 -r % I
i
I
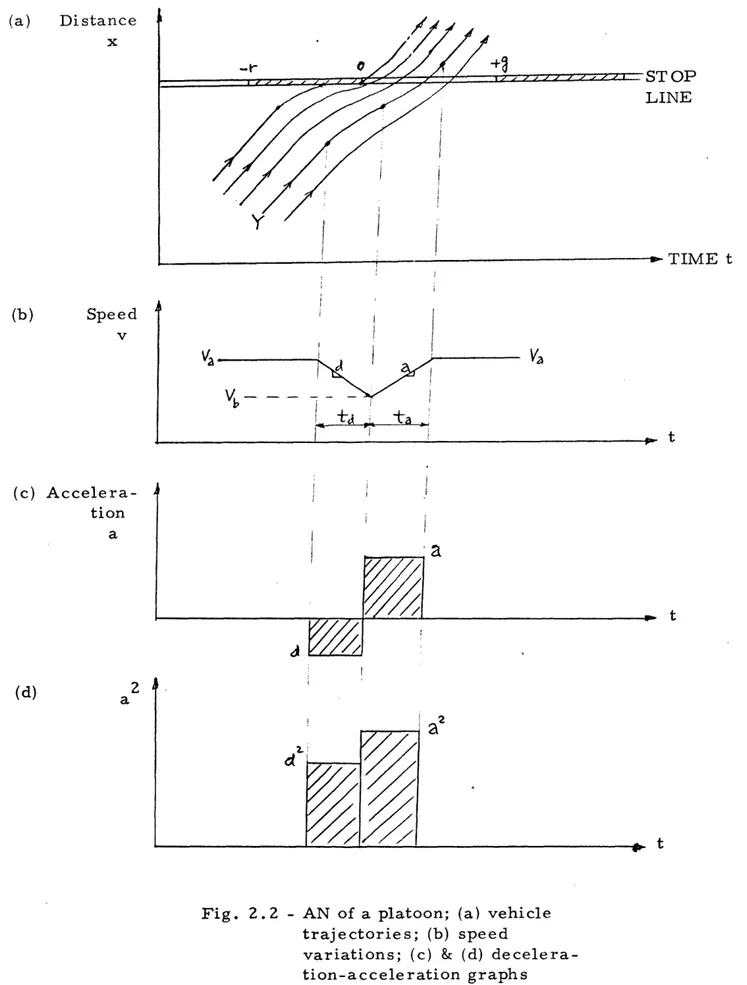
IIf we have a platoon of cars arriving at the intersection, some cars have to come to a full stop, others just slow down and speed up again.
Fig. 2.2(a) shows the trajectories of a few cars arriving at an intersection. As car Y approaches the intersection, the signal is about to turn green, so Y slows down (assumed that the same deceleration rate d applies) to a slower speed Vbb and accelerates back to its normal speed V (with the same
a acceleration rate a as before).
3. ACCELERATION NOISE WITH SHOCK WAVE ASSUMPTIONS
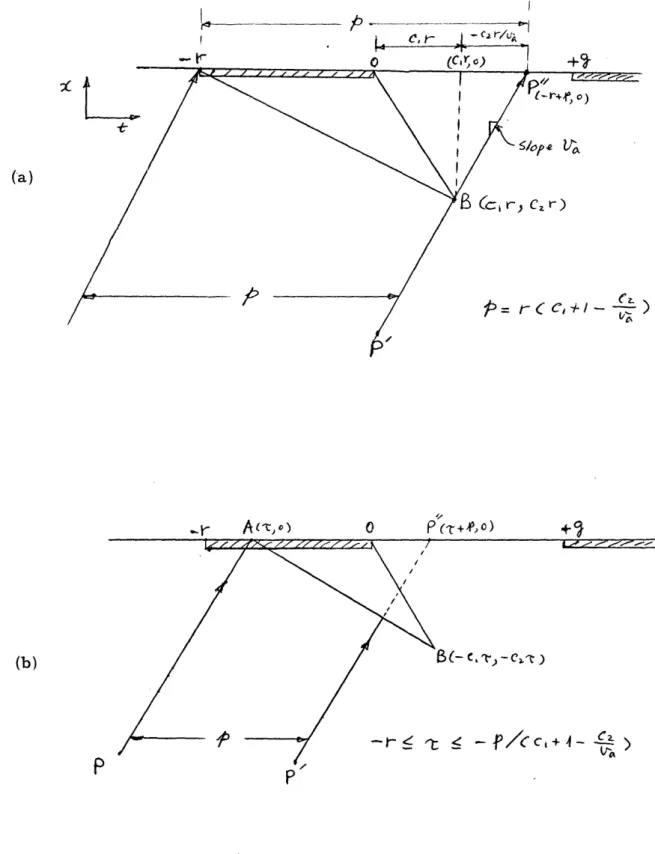
Based on Lighthill and Whitham's theory (9), when a platoon of cars is stopped at a signalized intersection, a shock wave (deceleration shock wave) starts traveling backwards (line AB in Fig. 3.1) at a speed Cd (slope
of line AB). When the signal turns green, the vehicles start accelerating, and acceleration shock waves are formed and travel forward.
Let us assume that all vehicles come to an instantaneous stop as they enter line AB, and accelerate instantaneously to their normal speed at line OB. As long as there is a queue they depart at the saturation flow rate. Vehicles that arrive after time tB pass through without stopping. In this
simplified case the AN is directly proportional to the number of stops, because we only consider cars that stop at the intersection.
If we have a uniform arrival flow, and let = arrival flow rate (veh/sec.)
p = duration of the arriving platoon (sec.)
(a) Distance x (b) Speed v (c) Accelera-tion a (d) a2 Vb-~~~~~~~~~~~~~~~~~~2 i t
d
Fig. 2.2 - AN of a platoon; (a) vehicle trajectories; (b) speed
variations; (c) & (d) decelera-tion-acceleration graphs ST OP
LINE
TIME t t t a2 t - - I -1 1 17 1III--77771 -i ,·~~ ~ ~~~~~~~~-
~
---- --~ -I%'
+9
-tr ii
I I Ii
i
i
i i yi
iI I kT/ne
Fig. 3.1 - Shock waves at traffic light
s = saturation flow rate (veh/sec.)
h. = headway at jam (when all cars wait at the signal) (ft.)
v = normal driving speed of the platoon (ft/sec.)
a
tH-
P-The slope of line AB (Cd) is equal to -hjq . The distance from any
point on AB to the stop line is the cumulative queue length at the intersection at any time t. The slope of line OB (C ) is equal to -hjs.
Line AB goes through point A (-r,0) and line OB goes through point 0(0,0), so they can be represented as: Lzne AB : X=j - a (tr)C--C(t*)
L:nt 06: x =-t st'
-
Ca t Point B is calculated as (c. ¢ r 4 Cd .) or B(Clr,C r), whereCd
Cand
Ca - Cd Ca Cd Ca - CdIf the first car of the platoon arrives at the stop line at time 2 , where -- 'It- O , then
Line AB:
'
-j )a
(t-
)
=
Cd (
t-t)
Line OB:
X =
-j
-t
Ca
t
Point 3 becomes ( Cd - v CaCd )
C - CdCa - Ca
or B(-C 1T, -C21 )T where T is a negative value.
Case I. If p g
(2
1. And if p x t(C,+I- -- ) (See Fig. 3.2(a))
(i.e., last car in the platoon passes through point B, the
C relation between p and r can be shown as p = r(C 1 + 1 -- ) )
a (a) then -r .<'U
PQat*
-a ~ a ) (Fig. 3.2(b))Number of stops =
dt
= PHaC2
(b) -p(C, 4 V- ) Jt < ( (Fig. 3.2(c)) :
Number of stops
dt=
-aa
(Cl '*)t
(c) o
' <
( -)
(Fig. 3.2(d))
Number of stops = 0 (because p < g) (d) 'r (19-t) (Fig. 3.2(e)) :
Some cars have to stop at the signal and wait until the next
green. If we let p' = t -(g-p) be the portion of the cars that have to stop at the next red, then p' = 0 through p and Number of stops = , ta = 'P where p' = 0 p
A,
-P
Fig. 3.2 - Platoon Trajectories (a) (b)
)
B(- C.t, - C )P
p ---,,-i-
A -tD
- r T - <- - A Ct 4- )2 vaa;/
i(c) (c) u to (d) ' (e)
Fig. 3.2 - Platoon Trajectories (cont'd)
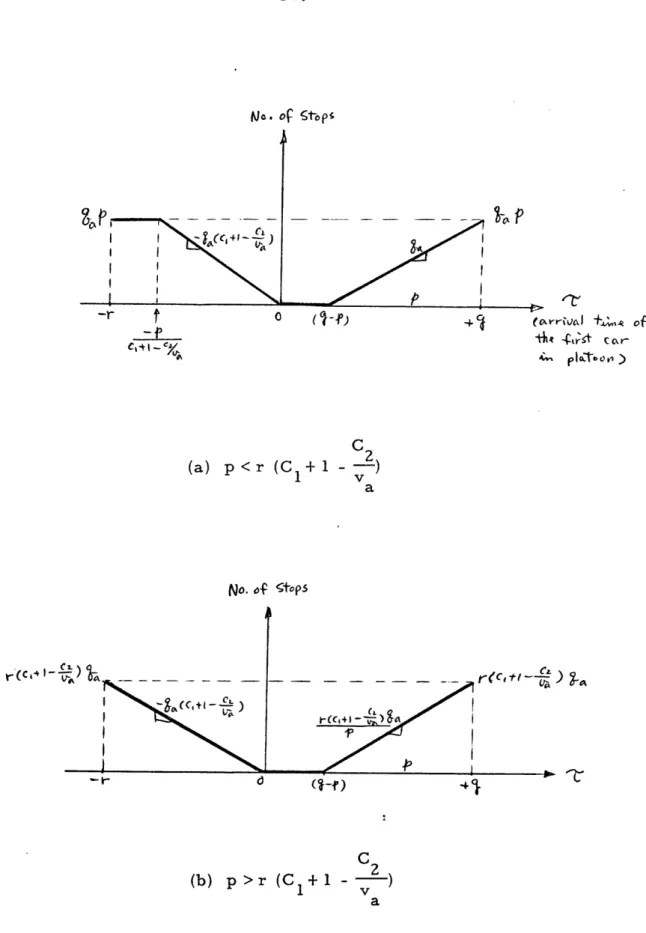
P d
The resulting number of stops for this case are shown in Fig.
3.3(a).
C2
2.
Andif
p
>
C,
+1-
-
I(
)
the calculations are similar and the results are shown in Fig. 3.3(b). Case II. Whenp= g
Calculations are similar, and the resulting relations are shown in Fig. 3.4.
CaseIII. Whenp>g
Results for the two cases (a) P
>
r(C+-
I
and(b)
e<
r(C,-
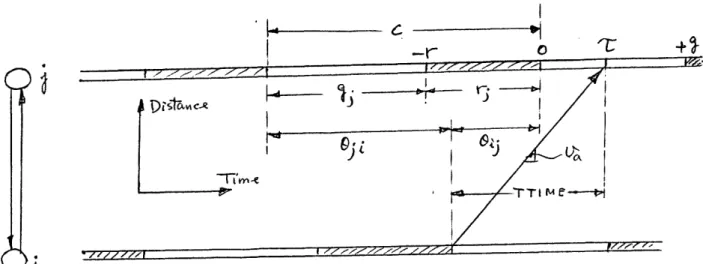
) al are shown in Fig. 3.5.We are interested in developing the relationships between the number of stops and the offset between the two adjacent signalized intersections. A relationship between the offset e and the arrival time of the first car in platoon, T, can be developed as shown in Fig. 3.6.
Let i, j be the two adjacent intersections. 0;j is the offset from i to j, 9i; is the offset in the other direction. Let TTIME be the travel time between i and j for a vehicle traveling at a constant speed va. If a
car leaves intersection i at the beginning of green, it arrives at the down-stream intersection stop line at time
T.
(is a time relative to the down-stream zero time point at the beginning of its green). So we have;ij + T = TTIME
and E;j = TTIME-
No. of Stops 1 U (7IiF) - v ¢'t't c' (oa'rikJ t+Ani of tht C i cr c r-P03-to ) (a) p<r (C 1 +1 1- v ) a No. of 'toPS C 2 (b) p>r(C11 +1 - v ) a
Fig. 3.3 - Number of stops for p <g
ri(C4
1--c
-_11 1_ _ _
ITI
(a) p<r (C 1 + 1 -C2 v a 0 C2 (b) p>r (C+ ---v ) a
Fig. 3.4 - Number of stops for p = g
-- I -.
___141 1__ I__ _· __ _IIIIC
. No. of Cs
AJ, s-vtops (a) p<r (Cl+ -C2 v a
T.,
r(c,, + t __ ) 0?
c
2 (b) p>r (C +1 - -) 1 v aFig. 3.5 - Number of stops for p >g
C V -t- IP -. = -t-L) ° + the I -''"~' --- p-I-2: Or -h
4
_ _·II_ __I^ ___'-+
I-st-i-R
Y)
.
Fig. 3.4 - Links intersections
No, cAS seps
&Bt
I-)o
TTi M T t 1 tTiME+*r
'rrjMER P/c,+4- 'L )
VIV,
Fig. 3.7 - Relationship between number of stopC and offset Q.. for p <g and p <r (C + 1 - )
13
1
vav
a J 11~-1 1 ^"---"-^---~I"--I "I
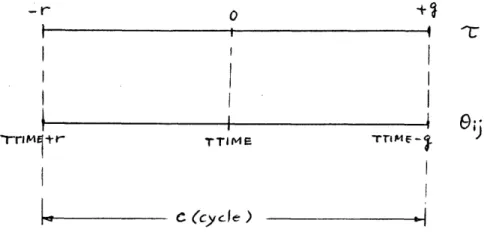
?I- I~~~, -TTM C I / II I laGraphically, the horizontal axes of the figures in the previous sections can be transformed to represent offsets:
-r
I
I
rrIM1±r 0 I Ii
TTIME II
I
I riM-4 T M }io
9
j
C (cycle)All the relations between the number of stops and r can be changed to relationships between number of stops and the offset 9 . As an example,
Fig. 3.3a is changed to a relation shown in Fig. 3.7. 4. AN - Additional Assumptions
In order to take a more realistic account of the AN of a platoon of vehicles, we developed a refined model based on additional assumptions. We assume that only cars that join the queue at the stop line while the signal is red come to a full stop and incur a maximum amount of AN. Cars that approach the traffic signal after the light turns green will not join the
I
standing queue. Instead, they will slow down for a while and accelerate back to their normal speed when they have an unimpeded right-of-way for passing through the intersection. In this rrmanner, these cars will incur
only a fraction of the maximum AN that a car that is stopped incurs. Some of the cars arriving later during the green phase may pass without having to change their speed.
Graphically, referring to Fig. 4. l(a), we draw a vertical line 00' from the stop line at time t = 0. We assume that the cars that are supposed to arrive at the deceleration-wave line AB at time t > 0 do not stop, but instead, they slow down to another constant speed vb, and start accelerating back to their normal speed v at the acceleration wave line OB. So in
Fig. 4. l(a), all cars X1 through X have to stop, while car Y1, (with
tc > 0, does not. Y1 changes to the lower speed vb at t = 0 (point E) and
travels at that speed vb until it joins the acceleration line OB at point F, then it starts accelerating back to its normal speed v . The slope of EF represents the speed vb. Cars sach as Z 1 and Z can pass through without
any change in speed.
We assume that the speed of the cars that do stop, becomes zero at the deceleration line AB, and they remain in this state until the
accelera-tion line OB, when they start accelerating. For the cars that only slow down for a while and speed up again, the speed changes occur at line t = 0 and OB (see Fig. 4.1(b)). The time-distance diagrams in this chapter show only the simplified trajectories of the car movements. The acceleration and deceleration processes are not shown.
Fig. 4.1(a) Time-Distance Diagram (b) Time-Speed Diagram (a)
(b)
The AN of a discrete arrival flow and a uniform arrival flow are considered in this chapter. A model to calculate the AN for a random arrival flow is developed in the next chapter.
4.1. Discrete Arrivals
As in Fig. 4.1, for cars that stop (i.e., cars X1 through X ) the
deceleration time is t = v /d and the acceleration time is t = v /a. d is
d a a a
a constant deceleration rate and a is a constant acceleration rate. For each one of these cars we have the following AN relation:
I = 2
t
For the cars that only slow down and accelerate back to their normal speed, (such as cars Y1,Y2, and Y3), the AN is calculated as follows:
Line AB: X = Cd ( t- )
Line 00': t =
Solving lines AB and 00' for point C', we get Xc, = -C d and
tc = 0. Line C' M goes through point C' and has a slope v . Line E N
goes through point (t c,+ h, Xc), i.e., point (h, -Cd ), where h is the arrival headway (sec.) and has slope v , so that
a
X+ Cd
V
Line EN: ,Va
tE = 0.
Xc =
i.e., X = Vat - Va - Ca
Solving lines 00' and EN for point E, we get xE = -v h - Cd and
Solving lines AB and EN for point C', we get Va
A
Va - CaCa
va-C
4(
-
j
Line C'F: = x, = C ( a- C Solving lines C'F and OB for point F, we get
and
XF
Ca
( Va - ) Line EF: X - XF -X
- X1 - tF t - ItF-r)
t = Cd (a ' _ r )F
Ca
V - C,
and the slope of line EF, which is vb for car Y1, is
XE - Ca v' A
Vb - F V
b
tE--F-
Cd (V a A-
a+Ct)
If we let (td)Y denote the deceleration time of car Y1 and (t )
1 1 aYI
denote its acceleration time, then from the relationship vb = v - d (td )
1~~~~~~~~~1
a = b + a (ta)y
we obtain
(to)
_
a -Vb
(t )Y, l/a -Vb Arespectively, and the AN of Y1 can be represented by:
O
= (TV>y,
(,
t
+
ta),
For car Y2, the calculations are similar to that for Y1. Since Y2 comes h
seconds later than Y1, we simply replace h by 2h in the above derivations
z and obtain vb for Y, (td)y , (ta)Y and finally
aZ-2 1 1Y
We do the same calculations for the cars that follow until the time t > tB
when all cars can pass through without changing their speed, and therefore,
4.2 Uniform Arrivals
We assume a uniform arrival flow pattern with magnitude q and duration p. We divide the platoon length into N intervals t.
P=
A 't+-Assuming the arrival time of the first group of vehicles (qa in at) at the stop line is (Fig. 4.2), then the arrival time of any nth group at the deceleration wave line A'B' is t,.
Line A 'B': X = Cd ( -)
Line KK': Va
i.e., X = Va [ t- - v-) at 3
Solving line A'B' and KK' for point C", we have
tV
Cn-l) tVa -Cd
X /t = Cd Va (VA- ) -t
c v - Cd
(I) For tc,,= tA,through t ,,i.e. , t. 0: All arriving cars have to stop, and the AN of any group of q. t cars can be calculated as follows:
ST OP
•/'pfe Ca
V/O e Vb
0
Fig. 4.2 - Uniform Arrivals L
deceleration time t = v /d d a acceleration time t = v /a a a a2n ( t )t a (t )1' ( at ) and 0 = ': ---- + ta - Cd t
(II) For tc,,
>
t,=Othrough t - C, C= - Cthese cars do not come to a full stop, but only slow down to a lower speed Vb:
Calculations for vb and Tb are similar to those in
the discrete arrival case.
The total AN is then the summation of the AN' s of the individual groups of cars in (I) and (II).
5. Computer Model and Program to Calculate Acceleration Noise for Continuous Flow Patterns
Assuming that:
1. We are given a dispersed input flow, which is the flow pattern discharged from the upstream inter-section, at a distance:
DIST = HDWYJ x SUMO1 from the stop line, where
HDWYJ = headway at jam = h. (ft/veh.) SUMO1 = total number of cars in the arrival
platoon (veh.)
This flow can be either a result of field measure-ments or an output from another computer program. 2. The assumptions of Chapter 4 hold.
The arrival flow is given throughout a whole cycle length. We can divide the cycle length into many small increments.
CYCLE = cycle length (sec.)
RED = effective red time (sec.) GREEN = effective green time (sec.-)
ITIME = length of each time increment (sec.), we can use, say, 2 sec.
NINC = total number of increments in the cycle = CYCLE/ITIME
P2 (n) = number of cars in the nth increments SPEED = normal, constant speed = v (ft/sec.)
a
SF = saturation flow = discharging rate after signal turns green and before queue disappears (veh/sec.)
Referring to Fig. 5.1, P2(1) is the first group of cars. P2(1) arrives at the stop line at time T1 = -RED (the beginning of green is zero time).
PZ(2) is the second group of cars, they arrive and join the queue (queue length = h. xP2(1) at time T2. And so on. P2(n) is the nth group of cars, and its
J
arrival time at the queue is T > 0. As soon as the signal turns green at time t = o, cars start leaving the intersection at the saturation flow rate SF.
We assume that P2(n) with T > 0 do not come to a complete stop, they change n
to the lower speed vb at tD = 0, and start accelerating at point E.
To calculate the arrival time of each group of cars at the queue, we let the arrival times be T1,T2, .., and further assume that the first group
of cars arrive at time T = -RED (see Fig. 5.2). Let SPEED denote the normal driving speed, then TIME = DIST/SPEED is the travel time to go through the distance DIST. Then,
DIST - h. x P2(1)
A2zT = ITIME TIME SPEED
DIST - h. x [P2(1) + P(2)]
C ), f L r ld e , GREEi I 0 STOP LINE D IST
I
(h)e
Fig. 5.1 - Continuous arrival flow
-, =-I -R9 T=-o
li
/ II;
.
I
f~~~~~f
P2z.)Fig. 5.2 - Arrival times at the queue
X
,;. P2()-hj
.p2(2) /lop et
-Ai
)JCIr
II
I
I
--So the arrival time of the nth group of cars at the queue is
DIST - h. x [Q(n-1)] T = -RED + (n-l) ITIME - (TIME - S
n SPEED
Where Q (n-l) is the cumulative number of cars in the queue for groups 1 through (n-l), i.e.,
Q(n- 1) = P2(1) +
P2(
2) + ... + P2(n-1)At time t = o, i.e., as the signal turns green, the vehicles start leaving at saturation flow rate SF. The queue keeps increasing from time = -RED to time = 0. After time t = o, the queue keeps decreasing at the rate SF - Input Flow, until the queue disappears or t = GREEN; then we start the next cycle. So after time t = o, queue = Q(n) - SF and queue
To calculate vb, we refer to Figs. 5.1 and 5.3. Suppose T > 0.
According to our assumptions, P2(n) does not stop, this group of cars slows down to a lower speed vb at time t = o (i.e., at point D) and accelerates back to normal speed v at point E. The slope of line DE represents this lower speed vb. Fig. 5.3 shows this part in more detail. OP represents the time t = (n-1)ITIME - RED, and OD represents the distance = v a
[ (n-l)ITIME - RED]. The distance of point E from the stop line is: EDIST = h. x Q(n-1)
At point E:
C(t -t) rrtc -Eo 0
x
fb.t
DI/sT
lo 'so,
ETIME = EDIST/(h. x SF).
Therefore, in time ETIME, this nth group of cars P2(n) travels the distance (OD - EDIST), and we obtain
OD - EDIST Vb = slope of DE ETIME
The calculation of the AN can be summarized as follows: (1) For groups of cars that join the queue at time T 0:
n
1
2
1/2
AN={t td+ +t t [d t +a d t ] }/ P2(n) a
d a
where t = v /d and t = v /a.
d a a a
(2) For groups of cars that are supposed to join the queue at time T > 0, before the queue disappears:
n
they change to lower speed vb at time t = 0 and each group has the AN:
AN= { 1t d2t + at } td +t d a P2(n) where v -v t - -d d v -v a b a a
and vb is calculated by equation as above.
(3) For groups of cars that arrive after the queue disappears: they pass through the intersection without any change in
Based on the model developed above, a computer program was written to calculate the AN for any arrival flow pattern. The program is a FORTRAN subroutine. It can be easily called from a main FORTRAN program which has the distribution of the arrival flow and other basic data such as cycle
time, red time, green time, speed, etc. One example of such a main program is the program in Ref. (6), that calculates the delay at the inter-se ction.
A flowchart showing the logic of how the AN is calculated in the program, together with the definition of variables and a complete listing are shown in Appendix A. A subroutine that shifts the arrival platoon takes care of the effects of changing the offset.
The results of an actual computer run are shown in Appendix B. Part (a) shows the arrival flow pattern P2, in which the total number of cars is 14.56/cycle. Part (b) shows the calculated acceleration noise for
different offsets.
The Computer Program (a) Flow Chart
-APPENDIX A The Computer Program (b) Definition of Variables DRATE = d = deceleration rate (ft/sec2 )
ARATE = a = acceleration rate (ft/sec) HDWYJ h. = headway at jam (ft/veh.)
SPEED v = the constant arrival speed (ft/sec) a
P2(I) = total number of cars in the Ith group (veh.)
Q(I) = cumulative number of cars from 1st to Ith group (veh.) QZERO = secondary flow (veh.)
TARR(I) = the arrival time at the queue of the Ith group (sec)
P(I) = number of cars left in the queue after signal turns green (veh.)
SF = saturation flow (veh/sec)
ITIME = the length of each time increment (sec)
NINC = total number of increments (the cycle time is divided into
NINC increments of ITIME seconds each)
RED = length of the red period (sec)
IRED = number of increments in RED
ANN(N) = the individual acceleration noise of the Nth group AN = total acceleration noise (ft/sec
)
Appendix A
(c) Listing of Program
145 S!IRROIUTINE AISE (P2,Q,SPEED,NINC,ITTIME,RED,QZER3, IREn,HDWYJ, SF
*, IWPK,X,SF, DI ST) 146 nTIMCNS TnN ANIl12?),AN t 12n),P2( 1?0) ,0( 120), TWnlK( 120) ,X(1201 , *TAPR ( 120) ,P( 12') 147 DATA fCRATE/8.0/,ARATE/5.0/ 148 TD=SPFFD/nPATF 149 TA=SP FF /FAR TF 150 T ItE=ITST/SPEFD
151 TEmP=( I. O /( TD+TA ) ) * ( DRATE**2*TD+ARAT E*2TA ) :**').5)
152 DO 700 J=1,NIC 153 0( 1) =P2( 1 ) +ZFRO 154 AN(J) =0.0 155 AN(1 )=P2(1)*TTEMP 156 ANI(J)=AN(JI)+ANN( ) 157 L I M=NII1NC 158 0r 600 TT=2,NTNC 159 0(IT)=0(IT-I)+P2( T)
CCC NOTF: BECAUSE THE ARPIVAL FLOW IS FOR 2 .ANFS, WE USF HnWYJ/2
CCC IN THE CALCULATIONS.
160 TE"MP2p=TIME-( DI ST-HDWYJ/2*0(I T-l) ) / SPEE
161 TAP( IT)=(-I .O.*RFD)+(IT-I)*ITIME-TFMP2
162 IF (TARR ( T)-0.O)77,77,78
163 77 ANN(I T)=P?(IT)*TFMP
164 30 TO 600
165 78 P(IT-I)=0(IT-1)
166 r (IT-l)=P( Ir-1)-SF*TAPR(IT)
167 P(IT- )=AMAXl(O.O,P( IT-1 ))
168 IF(P( IT-1)-O.) 70,70,71 169 71 XD=SPFED*((IT-1 )*ITIMF-RED ) 170 XF=H' WYJ /2*' ( I T-1 ) 171 TF=XF/(HWYJ/2* SF ) 172 VB=(XO-XF)/TE 173 T I=(SPFFD-VR) /R ATF 174 TAl=(SPFO--VP) /APATF
175 PPTNT727,TD1 ,TA, VB,SPEED, X,XE,TF, IT
176 727 FORMAT'O' ,' TO= ',F7.2,' TA1= ',F7.2,' VB= ',F7.2,' SPFED= 'F7.2,
*' XO= ',F10.2,' XF=',F10.2,' TF= ',F7.?,lOX,'TT= ',15)
177 TFPl=(( 1./(TDl+TAI) )*(DRATE**2*TD1+ARATE**2*TA11 **0.5
178 ANN IT )=P2 (IT) *TE MP1
179 3 T 600 180 70 AN([IT)=0.0 181 LTM=TT 182 GO T 747 183 600 AN(J)=AN(J)+-ANN(IT) 184 747 PRINT737
185 737 FFnR AT('0','TARR ARRIVAL TIME)= ')
186 PPTIT, (TAPR(TT),IT=2,LIM)
CCC CHAN, F rlFFSFT
187 CALL RVSHFT (P?,NINC)
188 700 '(NTINUE
189 PPINT710
190 710 FnRMAT ('O','ACCELFRATION NOISF FR OFFSETS IS: t)
191 PRINT, (ANJ) ,J=l,NINC)
192 CAlL OKRPLT (X,ANNINC,9,0,IWORK)
193 RF TURN
194 FNr)
9 a) U O i) W- v h -. -. O x o1 r. 0 0 ?4-4 4 -.4 z * * @ _ . It(d---_ _ 0 c---p I---C X-o N 0 0 , i-I O A Cd >w n . _ C C~~i-A
~ ~ ~ ~ ~-
~
0 0 O \D O LA C)U) C)~~~~~U '4o
a) 9H E4 O F: V W) -0zS
O (d X U) °e d m W o X u 0 o ¢ aPqC) ~3
N _ O O 0 o 't N O O 0 O O 0 q * * * L A N ' O z Zo> ¢ vReferences
1. D. R. Drew, "Traffic Flow Theory and Control," McGraw-Hill, New York, 1968.
2. E. W. Montroll, "Acceleration Noise and Clustering Tendency of Vehicular Traffic," Theory of Traffic Flow (Ro Herman, ed.), Elsevier, Amsterdam, 1961.
3. E. W. Montroll and R. B. Potts, "Car Following and Acceleration Noise,,' HRB Special Report 79 (Ch.2), Washington DoC., 1964. 4. T. R. Jones and R. B. Potts, "The Measurement of Acceleration
Noise - A Traffic Parameter," Operations Research, 745-763, 1962. 5. W. Helly and P. G. Baker, "Acceleration Noise in a Congested
Signalized Environment," Vehicular Traffic Science (L.C. Edie et al, eds.), American Elsevier, New York, 1967.
6. N. Gartner, "Platoon Profiles and Link Delay Functions for Optimal Coordination of Traffic Signals on Arterial Streets," Res. Report No. 9, University of Toronto - York University Joint Program in
Transportation, August 1972.
7. "SIGOP: Traffic Signal Optimization Program; A computer program to calculate optimum coordination in a grid network of synchronized traffic signals; Traffic Research Corporation, New York,
September 1966, PB 173 738.
8. D. I. Robertson, "TRANSYT Method for Area Traffic Control," Traffic Engineering and Control, October 1969.
9. M. J. Lighthill and Go B. Whitham, "On kinematic waves: A theory of traffic flow on long crowded roads," Proc. Royal Soc., A229, No. 1178, 317-345, 1955.
