HAL Id: hal-02800678
https://hal.inrae.fr/hal-02800678
Submitted on 5 Jun 2020
HAL is a multi-disciplinary open access
archive for the deposit and dissemination of
sci-entific research documents, whether they are
pub-lished or not. The documents may come from
teaching and research institutions in France or
abroad, or from public or private research centers.
L’archive ouverte pluridisciplinaire HAL, est
destinée au dépôt et à la diffusion de documents
scientifiques de niveau recherche, publiés ou non,
émanant des établissements d’enseignement et de
recherche français ou étrangers, des laboratoires
publics ou privés.
Case study: multidimensional comparison of local and
global fresh tomato supply chains in France (task 3.5)
Agnès Bellec-Gauche, Yuna Chiffoleau, Camille Maffezzoli
To cite this version:
Agnès Bellec-Gauche, Yuna Chiffoleau, Camille Maffezzoli. Case study: multidimensional comparison
of local and global fresh tomato supply chains in France (task 3.5). [Technical Report] 2015.
�hal-02800678�
Case Study XY(Task 3.5)
Authors – Partner
The research leading to these results has received funding from the European Union’s Seventh Framework Programme for research, technological development and demonstration under grant agreement n° 311778
Bellec-Gauche A.*, Chiffoleau Y.**, Maffezzoli C.**
*
PhD, UM1 MRM / INRA UMR Innovation
**
INRA, National Institute of Agricultural Research, UMR Innovation, Montpellier,
France
Case Study : multidimensional comparison of
local and global fresh tomato supply chains
Case Study: multidimensional comparison of
local and global fresh tomato supply chains
(Task 3.5)
Bellec-Gauche A., Chiffoleau Y., Maffezzoli C.
To be quoted as:
Bellec-Gauche A., Chiffoleau Y., Maffezzoli C. (2015). Glamur project multidimensional
comparison of local and global fresh tomato supply chains. Montpellier, FRA: INRA.
Summary
Tomato is one of the most consumed vegetables in Europe. In South of France and Spain, tomatoes are
produced, exported or imported, through a diversity of chains. This report presents the results of
performance assessment of three contrasted chains representing main trends in those areas: one global
chain, from Almeria, Spain, to South of France and involving producer organizations; two local chains,
conventional and organic, in South of France. We first describe the context of the chains, and the
research questions we designed from the main issues associated with these chains in the professional
press. Then, we detail the final list of attributes, indicators and sub-indicators which we selected, in an
iterative process between theory and practice, to respond to these questions, and cover the five
dimensions of chains performance in the case study. Data have been collected or produced through
literature review, interviews and a collective workshop. Results confirm that global and local chains are
both globally performant, but at different levels and regarding specific indicators. While global chains
tend to perform better in the economic dimension, local chains show better scores in the other dimensions
(social, environmental, health, ethics); agricultural and governance models in each chain have
nevertheless a strong impact, and unexpected results have been found. Further work has to be done to
better compare results, and get feed-back to research questions and for practical implications, while
accounting for the theoretical and methodological limits of the case study.
1. Table of content
2.
Introduction ... 5
2.2.1.
The French fresh tomato sector ... 6
2.2.2.
The Spanish fresh tomato sector... 7
3.
Definition of the case study and boundaries ... 8
3.2.1.
Characteristics of tomatoes marketed in the global chain ... 10
3.2.2.
Characteristics of tomatoes marketed in local chains ... 10
3.3.1.
Global fresh tomato chain from Spain to France : focus on cooperatives ... 11
3.3.2.
Local fresh tomato chain in France ... 14
3.3.3.
Comparison between local and global production systems ... 16
4.
Research Design ... 21
4.3.1.
Final list of selected attributes ... 22
4.3.2.
Final list of indicators ... 23
5.
Methods of Data collection and analysis ... 31
5.1.1.
General Source of data ... 31
5.1.2.
Method and source of secondary data ... 31
5.1.3.
Collection of primary data ... 32
5.3.1.
For secondary data ... 32
5.3.2.
For primary data : Pedigree matrix approach ... 33
2.1.
Structure of the report ... 6
2.2.
Introduction to the French and Spanish fresh tomato sectors ... 6
3.1.
From major trends to study case definition ... 8
3.2.
Distinction of “local” and “global” tomato chains ... 8
3.3.
Study case presentation ... 11
2.3. Main critical issues of the local and global chains ... 19
4.1.
Global design of research: an iterative process ... 21
4.2.
Final list of Research Questions ... 21
4.3.
Final list of attributes and indicators ... 22
4.4.
Contextualizing and benchmarking of the indicators ... 23
4.5.
Final methological matrix ... 25
5.1.
Plan for data collection ... 31
5.2.
Data analysis and ranking ... 32
6.
Results: indicators of performance ... 35
6.1.1.
Attribute Contribution to economic development... 35
6.1.2.
Attribute Creation and distribution of added value ... 37
6.1.3.
Attribute Affordability ... 39
6.2.1.
Attribute Biodiversity ... 40
6.2.2.
Attribute Resource use ... 41
6.2.3.
Attribute Pollution ... 43
6.3.1.
Attribute Information and Communication (Social and Economic Dimensions) ... 45
6.3.2.
Attribute Connection ... 46
6.3.3.
Attribute Territoriality ... 48
6.4.1.
Attribute Food safety ... 50
6.4.2.
Attribute nutrition ... 50
Attribute Labour relations ... 51
Conclusion ... 52
References ... 54
2. Introduction
In this case study report, we present the results on the performance of local and global fresh tomoto chains. This study is carried out by teams from INRA in France and UAB in Spain. Two local and two global chains are analysed. The local chains consider tomatoes produced in the surroundings of Barcelona or Montpellier, and sold directly to consumers, in local open-air markets or on-farm in the French case, in basket schemes in the Spanish case. The two global chains consider tomatoes produced in Almería, Spain, distributed through wholesale markets in Barcelona and Perpignan, and sold to consumers in supermarkets in Montpellier or Barcelona. The French team studies a global chain involving producer organizations, as representative of a major trend in global chains. In our analysis we consider all the stages from the production until the point of sale to the consumer. This report is structured as follows: First, we identify research questions challenging both French and Spanish tomato chains regarding their performance in the five dimensions taken in account in the GLAMUR project. Those questions have been defined according to a review of literature, interviews of experts and primary data already collected by the teams. They also take into account the national challenges of France and Spain regarding food chain performances reported in the WP2 report: neoliberalism and food system sustainability in Spain, territoriality and global competition in France (Kirwan et al., 2014). We designed the relations between those research questions and6.1.
Economic dimension ... 35
6.2.
Environmental dimension ... 40
6.3.
Social dimension ... 45
6.4.
Health dimension ... 50
specific attributes from the GLAMUR common list of 24 attributes. Following the systemic and analytic perspective of the GLAMUR project, indicators have then been selected and adapted from reference grids (notably SAFA), or proposed from other works, in order to cover the data needed to answer to the research questions on the one hand, and to assess and compare tomato chains performances regarding specific attributes on the other hand. This report presents the achieved work.
2.1. Structure of the report
In the following section, we first briefly present the French and Spanish tomato sector embedded in both national and international markets, secondly we present the background of our case studies through the distinction of “local” and “global” tomato chains, the scope of the value chains and a general presentation of the case study. In a second section, we present the research framework which includes the development of specific research questions and objectives, and the selection of concerned attributes within the common list of 24 attributes of the GLAMUR Project (Kirwan et al., 2014). Then, we present the first set of selected indicators, the modification we had to make after confrontation to data and experts, and the final list of indicators used in the study case. Whe show how we defined each indicator through several sub-indicators in order to contextualise, assess and benchmark the data collected to measure the level of performance.
2.2. Introduction to the French and Spanish fresh tomato sectors
2.2.1. The French fresh tomato sector
In France, tomato is one of the best examples (with wine) of “glocalisation”, that means the paradoxal co-existence of local and global chains. Tomato is both a consumer product (95% of French people consume tomatoes, either fresh or processed) and a “socio-political product” as far as the production or consumption of organic “ancient varieties” may be either a strategy of distinction (identity, social class) or one of the symbols of alternative food chains opposed to agro-industrial mainstream models (Medfel, 2012).
France is not self-sufficient regarding of production (600 000 t) and imports (400 000 t) mainly from Morocco and Spain. It exports to other European countries (140 000 t, among which imported tomatoes re-exported). The production is decreasing because of international competition. Brittany and South-East of France are the most important regions regarding production, followed by South West, Loire Valley and Languedoc-Roussillon. Regions differ in matter of production techniques and governance: in Brittany, almost all the production comes from glass greenhouses, warmed in most cases, and grow-bags, and producer organizations are very big. We propose to study the Languedoc-Roussillon region as far as the production conditions are quite similar as in Spain: i) tomatoes are mostly produced under cold shelters (non-warmed greenhouses or plastic tunnels); ii) there are both independent producers and producer organizations.
At the national level, production is very concentrated: almost 90% of tomato producers using shelters cultivate tomatoes on less than 0,5 hectare. A little more than 5% of producers cultivate tomatoes on more than 1 hectare and share 2/3 of the production surface of tomatoes in France. Tomato intensive production is a high financial activity, very dependent on the CAP payments (high investments are needed for glass greenhouses; 1 ha of glass greenhouse costs 1,5 million of euros). There is one national PDO (Protected Designation of Origin), a system of geographical
product indications, for tomatoes (‘PDO France’). It is very different from other products for which PDOs are more regionally based.
Tomato trade is submitted to international regulation (WTO), which defines norms and standards of quality and traceability (HACCP). However, the tomato chain has been largely disturbed by the E.Coli crisis in 2011.
The tomato market is highly segmented: there are 30 types of tomatoes proposed to consumers; the basic round tomato is less and less produced and replaced by differentiated products: cluster, cocktail…
The role of producer organizations is crucial in fruits and vegetables chains in France: regarding the tomato sector, 70% of the French production is collected, packed and sold through producer organizations. These organizations tend to concentrate. The marketing channels of the remaining 30% are less known and include self-consumption. Producer organizations propose more and more packed tomatoes with their own trademark, along with the PDO or not, and negotiate directly with supermarket chains (via central buying services). They benefit from the interest for ‘made in France’ products. They also export directly to international markets. Supermarkets, catering and exports represent 90% of their production. The last 10% are sold directly by producers belonging to the producer organization.
Supermarkets are stricter than international requirements in matter of food safety, that is why producer organizations develop their own tool of mastering and control of quality and esp. residues in order to entry this market.
2.2.2. The Spanish fresh tomato sector
A detailed presentation of this sector is proposed in the UAB tomato case report. We just highlight here the main information to contextualise the global chain the French team focused on.
At European level, Spain produces one fifth of the European production of tomatoes with 10% of the agricultural land allocated to that purpose. Tomatoes account for about 20% of the total production of vegetables; one third of that is exported and more than half of the production is consumed internally. It has been the 5th-7th crop in terms of gross production value during the last lustrum.
Almeria is one of the most important regions of tomato production in Spain and thanks to its microclimate, production systems do not need to be warmed artificially. The production is based on an economic model of intensive agriculture: high level of capital investment and workforce, use of technology (26 800 hectares of tunnels, including 2 200 hectares soilless). The natural soil is poor in organic components and hence, tomatoes are planted in a mixture of sand and earth with manure. The average yield is 10 kg/m2 during a winter cycle of 6 months. Small farms to big firms are
involved in production. Strategies are based on price competitiveness due to international competition. A large part of Almeria production is exported, mostly in Europe: France, Germany and the Netherlands represent 95% of the market share.
Moreover, Almeria is configured as an agro-industrial cluster: production is structured around farms, which present a high specialisation in tomato production, wholesale private firms, ‘processing agricultural societies’, cooperatives dedicated to export, inputs suppliers, and technical support providers.
3. Definition of the case study and boundaries
3.1. From major trends to study case definition
Regarding fresh tomato chains, two types, respectively in global and local markets, represent major trends in Southern Europe: we selected these two types for a performance assessment.
Figure 1: two major types of tomato chains in Southern Europe
Moreover, as 10% of the French farms involved in short food chains get the organic label (Agreste, 2012) and organic tomato consumption is increasing more than conventional (France Agrimer), we consider two different local chains: one conventional and one organic.
More largely, in matter of tomato consumption, in 2013, in France, 95,8% of households declared buying fresh tomatoes for home consumption. That represented, in 2013, a consumption of 15,3kg / year and household (Ministry of Agriculture) and 18% in volume of vegetables purchases (France Agrimer). The cluster tomato is the most consumed variety in France (46% of market shares in 2013; CTIF; Kantar World panel) but ‘ancient’ varieties are, according to experts, more and more consumed.
3.2. Distinction of “local” and “global” tomato chains
Refering to the GLAMUR framework, local and global chains can be differenciated by 4 main key-dimensions wich are :
N°2:
Various tomato varieties produced in Languedoc (France), sold directly on-farm or on localopen-air market
LOCAL
GLOBAL
N°1:
Clustertomatoes produced in Almeria (Spain) and sold in France through
cooperatives in supermarkets
1. The physical and geographical distance between producers and consumers, 2. The type of governance and organization of the supply chain,
3. The kind of resources, knowledge and technologies employed,
4. The way supply chain stakeholders shape product identity with regard to the reference to the territory of production for food plays a relevant role or not.
In the case of fresh tomato local and global chains studied by the French team, these key-dimensions can be detailed as follows:
Table 1: distinction of local and global chains in the study case along GLAMUR criteria
KEY-DIMENSION LOCAL FRANCE (conv-organic) GLOBAL SPAIN-FRANCE
PHYSICAL AND GEOGRAPHICAL
DISTANCE
Producers and consumers are located in the same district or within a radius of 150 km in
Languedoc-Roussillon Direct selling in local open-air
markets or on-farm
Producers belonging to a 1rst degree cooperative, integrated in a 2nd degree cooperative, in Almeria, Spain and consumers in
Languedoc-Roussillon, France. Minimum 2 steps between farm and consumption. Tomato sold in supermarkets in
South of France
TYPE OF GOVERNANCE
AND ORGANIZATION
Moinly small producers and big producers diversifying their outlets
Atomized production for most of them; some of them also belong to
a producer organisation
Small producers, 1rst and 2nd degree cooperatives,
Agro-industrial district in Almeria. Logistic and buying platforms in
Languedoc-Roussillon.
RESOURCES, KNOWLEDGE
AND TECHNOLOGIES
Both ancient varieties and hybrids Importance of human resources
No subsidies
Hybrid varieties, generic round and cluster tomatoes. Technology for pakaging and
transportation
Collaboration with research to improve productivity and competitivness; public subsidies
dedicated to technological innovation
PRODUCT IDENTITY, LINK WITH TERRITORY
10% of farms = organic Few local varieties specific to a
territory
One of the main products of the Mediterranean diet
No label
The case study is defined by functional and structural limits: the functional unit is 1 kilo of marketed tomato and chains are analysed from producers to selling points. In most cases, we have not been able to take into account the challenges at the level of inputs suppliers or service providers, whereas access to resources is also a major issue for those actors. We were also not in a position to detail consumers’ practices regarding tomatoes by primary data and thus, reduced our analysis of consumption to secondary data.
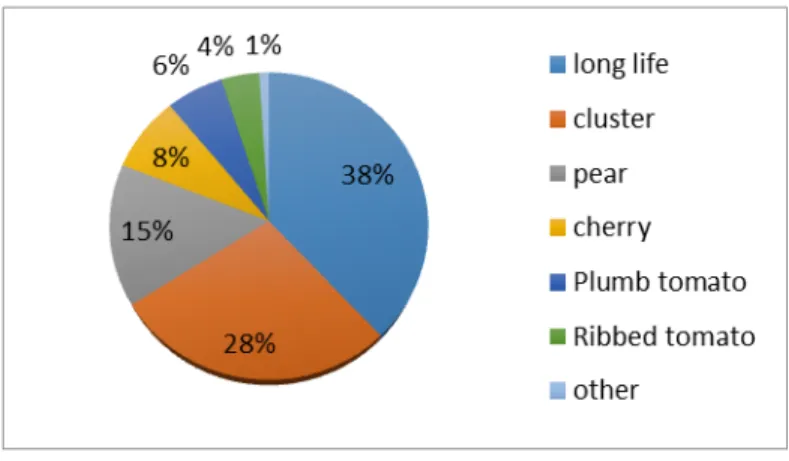
3.2.1. Characteristics of tomatoes marketed in the global chain
Global chains from Almeria propose 7 varieties, among which two represent the main part of market shares: “long life” and “cluster” tomatoes. The global chains impose criteria of functional quality that impact breeding, cultivation cultural and distribution systems (Bressoud, 2010): (i) homogeneous aspect of the product, (ii) resistance to shocks, iii) long conservation and maintenance of a good aspect in the shelves, iv) availability of product during a long period. Choice of varieties, cultural season, stage of maturity at harvest and modes of transportation and conservation is made regarding these quality criteria
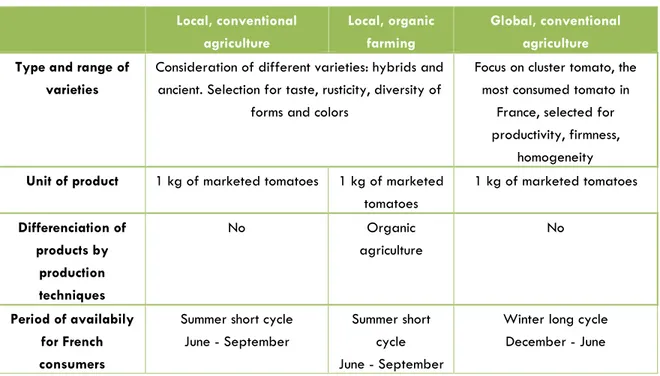
3.2.2. Characteristics of tomatoes marketed in local chains
In the local chains of Southern France varieties are very different from the ones imported, as far as quality criteria expected by consumers are not the same: taste, optimal maturity… Cultivation systems are based on a large range of varieties and often include ‘ancient’ or ‘rustic’ ones (Demarque, 2010).
Table 2: Characteristics of products according to the type of chain considered in the study case Local, conventional agriculture Local, organic farming Global, conventional agriculture Type and range of
varieties
Consideration of different varieties: hybrids and ancient. Selection for taste, rusticity, diversity of
forms and colors
Focus on cluster tomato, the most consumed tomato in
France, selected for productivity, firmness,
homogeneity
Unit of product 1 kg of marketed tomatoes 1 kg of marketed tomatoes 1 kg of marketed tomatoes Differenciation of products by production techniques No Organic agriculture No Period of availabily for French consumers
Summer short cycle June - September
Summer short cycle June - September
Winter long cycle December - June
3.3. Study case presentation
3.3.1. Global fresh tomato chain from Spain to France : focus on cooperatives
A detailed presentation of Almeria province is provided in the Spanish team report. We just want to stress the importance of cooperative organizations in global chains coming from this province: they represent 65% of fruit and vegetales exports from Almeria and 70% of the total production (Giagnocavo et al., 2012).
We thus chose to study the case of a 2nd degree cooperative, gathering the production of 72 first degree cooperatives in Spain, among which 3 in Almeria. This cooperative is the Spanish leader in fruits and vegetables commercialization. It gathers different hybrid varieties of tomatoes (round, cluster, cocktail...), grown in non-warmed glasshouses. Tomatoes are exported to France from December to June (counter-season). In the case of the cooperative under study:
- Tomatoes are produced on small farms of an average surface of 2,4 ha, among which 6 200 m² of greenhouse.
- The produce is collected and packaged in Almeria by the 1rst degree cooperative, then sent from Almeria to the logistic platform of the Spanish 2nd degree cooperative based in the Saint-Charles wholesale market in
Languedoc-Roussillon, France: the distance is about 1 200 km and the road transportation is made by refrigerated trucks (temperature 7-8°C) which do not belong to the cooperative; cost of transport is 0,07 Euros/kg
- The logistic platform prepares the commands every day and sends them to buyers, among which supermarkets buying centres represent 65% of the market share; purchase is managed in tense flows: the
platform has a stocking capacity of 120 000 pallets and tomatoes have to stay less than half a day. 80 persons are employed at this stage;
- The produce is delivered from the 2nd degree cooperative platform to supermarkets buying centres: we
selected the buying centre of Super U supermarkets, based in Montpellier periphery. The current trend is a centralization of demand with a lower number of buyers and a higher demand of quality products. Annual contracts are made with supermarkets. They require diverse qualities and suppliers have to deal with calendars of promotion.
- The produce is delivered from buying centres to supermarkets: we selected the case of Super U supermarket in Montpellier suburbs.
Figure 2 : Map of global tomato chain from Almeria to Languedoc-Roussillon
Legend :
Flow of product
Flow of materials and services
Research + Development + Innovation
cooperation
Source : Authors, from data in Ferraro Garcia, Aznar Sanchez, 2008; and García Martínez de San Vicente, 2012.
SPAIN Almeria
FRANCE Languedoc
Agro-industrial
Almeria cluster
Production and process
Distribution
1ST AND 2ND DEGREE COOPERATIVES
FRUITS AND VEGETABLES PLATFORM Processing and packaging GREENHOUSE
PRODUCTION LOGISTICS PLATFORM
Distribution of products in France CENTRAL PURCHASING
SU
PER
M
A
R
K
ETS
Co
ns
ump
tio
n
Residues and waste treatment services Financial services Research and development Plastic / greenhouses Fertigation Agrochemicals Organic production Seeds/plants Material Family farming <1ha Medium farmers 1-2ha Capital agriculture > 2ha WHOLESALERS FOOD CATERING Waste and
loss Waste and loss
R
ET
A
ILER
Waste and lossRE
ST
A
U
RA
N
T
Auxiliaires services3.3.2. Local fresh tomato chain in France
The study case considers tomatoes produced in the Languedoc-Roussillon region, in Southern France.
Vegetable production in Languedoc-Roussillon, France has been very affected by economic crises and European and Marrocco competition during the last twenty years. Vegetables surface decreased by 16% between 1979 and 2005. Historically, producers close to Perpignan, where there is a major wholesale public market, have been oriented towards exports. The situation has changed and today 75% of installations in vegetable production are linked with short chains. Access to land is a major constraint in this region. Organic farming or similarproduction techniques have been increasing during the last years and now represent 10% of the number of farms involved in short chains (while only 2% of farms involved in long
chains; Agreste, 2012).
In 2010, in Languedoc-Roussillon, 886 farms were producing tomatoes on a total surface of 91 616 ares: - 75% of these farms produce less than 0,5 ha of tomatoes, 11% between 0,5 and 1 ha, 7%
between 1 and 3 ha; and 2% more than 3 ha.
- 73% of these farms produce tomatoes in open-field or under low shelters or tunnels, that represent 82% of the cultivated surface; production cycle is short and in Summer
- 19% of these farms sell a part to all of their tomatoes through short chains: 33% of those ones are small farms and 84% of those ones sell notably on-farm.
Source: National Agricultural Census, 2010
The local tomatoes chain will be assessed through a sample of diverse farms partly involved in “short and proximity circuits” and situated in Languedoc-Roussillon. On-farm and open-air markets are, in France, the most important outlets for farmers regarding short food supply chains (Agricultural Census, 2010). Farmers usually sell to the closest open-air markets, especially in fruits and vegetable production, so that this chain is
Figure 3: Size of farms producing tomatoes and selling them in short chains in Languedoc-Roussillon, France (Agreste, 2012)
Small < 1 ha
1 ha < Medium < 3 ha 3 ha < Large
also local. We study local chains through two different samples.The first sample composed of about 30 farms in the South of France had been previoulsy studied along the technical, economic, social and management dimensions. It represents 3 types of vegetable producers in short food chains in France (Gauche, Chiffoleau, 2015): ‘involved’, ‘traditional’, ‘technical’. Those types have been defined according to farmers’ objectives and (commercial, technical, social) practices, rather than according to farm size, farmer’s skills or equipment level. Those types may be found all over France but, in order to make a relevant confrontation with Spain, only famers in the South of France are considered. As in Spain production takes mainly place in plastic tunnels. This second sample had also been previously studied by our team, but more precusely regarding the social dimension of sustainability (Chiffoleau, 2009). It includes also about 30 farms in Southern France who produce tomatoes mostly for local chains and sometimes for global ones; 10 of them are still followed.
From these two samples, we observed an average transport of 1 600 km per year and per producer to sell tomatoes on open-air markets.
Figure 4 : map of tomato local chains in Languedoc-Roussillon
Source: authors
Distribution
Production
Organic and
conventional
PRODUCTION and PROCESSINGCo
ns
um
pti
on
Residues and waste treatment services
Technical support and development Plastic / greenhouses Agrochemicals Organic production Seeds/plants Material “involved” › 80% local “traditional” ≈ 40% Local “technical” occasional 25 % Local Local markets/stand Direct sales Waste and loss National – European market
Legend
From an organizational perspective, local chains are characterized by: - The absence of producer organisations;
- A low level of technical support regarding extension services
Selling on-farm is the less costly option for producers of the local chain. Selling on open-air market requires more time, may be limited by access to a place and is sometimes assessed as hard. This outlet remains the 2nd most important short chains for producers (in volume) but appears as a transition stage for many
producers, which evolve towards farmers’ shops or basket schemes.
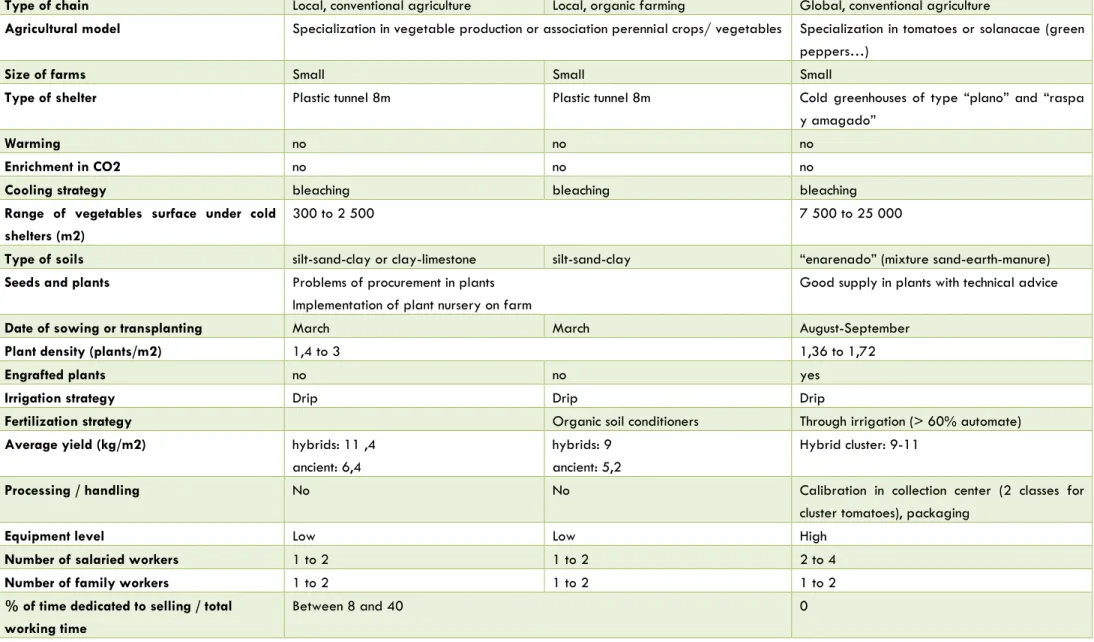
3.3.3. Comparison between local and global production systems
Flow of material and services
Experimentation and technical support
Flow of product
Table 3: characteristics of production systems according to the type of chain considered in the study case
France Spain
Type of chain Local, conventional agriculture Local, organic farming Global, conventional agriculture
Agricultural model Specialization in vegetable production or association perennial crops/ vegetables Specialization in tomatoes or solanacae (green peppers…)
Size of farms Small Small Small
Type of shelter Plastic tunnel 8m Plastic tunnel 8m Cold greenhouses of type “plano” and “raspa
y amagado”
Warming no no no
Enrichment in CO2 no no no
Cooling strategy bleaching bleaching bleaching
Range of vegetables surface under cold shelters (m2)
300 to 2 500 7 500 to 25 000
Type of soils silt-sand-clay or clay-limestone silt-sand-clay “enarenado” (mixture sand-earth-manure)
Seeds and plants Problems of procurement in plants
Implementation of plant nursery on farm
Good supply in plants with technical advice
Date of sowing or transplanting March March August-September
Plant density (plants/m2) 1,4 to 3 1,36 to 1,72
Engrafted plants no no yes
Irrigation strategy Drip Drip Drip
Fertilization strategy Organic soil conditioners Through irrigation (> 60% automate)
Average yield (kg/m2) hybrids: 11 ,4
ancient: 6,4
hybrids: 9 ancient: 5,2
Hybrid cluster: 9-11
Processing / handling No No Calibration in collection center (2 classes for
cluster tomatoes), packaging
Equipment level Low Low High
Number of salaried workers 1 to 2 1 to 2 2 to 4
Number of family workers 1 to 2 1 to 2 1 to 2
% of time dedicated to selling / total working time
The figure below represents the typical soil used in Almeria tomato production.
Figure 5: soil ‘enarenado’ used for tomato production under shelter in Almeria
Source : Cajamar caja rural, 2014
Figures 6 and 7 compare the shelters used respectively in Almeria and Languedoc-Roussillon for tomato production.
Figure 6 : Types of shelters used in Almeria : type parral plano (a) et type raspa y amagado (b)
Source : Cajamar caja rual, 2014
(a)
(b)
Figure 7 : type of shelters used in local chains in Languedoc-Roussillon
Height : 3 to 4 m Width: 7 à 9.50 m
Source : Bouchaud, 2014
2.3. Main critical issues of the local and global chains
A first review of literature and interviews with experts during the GLAMUR quickscan, highlighted some critical issues in the fresh tomato chains, both in France and Spain. Those are useful for framing the case study, and will be discussed after data processing:
Price and distribution of added value: Price is the first buying criteria for most consumers. At the level of
the global market there is a strong price competition between mediteranean producing countries. In the case of farmers involved in the global food chain, prices of inputs are an important component of production costs. Energy consumption and productivity of land are also important factors in this regard. Selling prices as well as volumescontribute to make the business profitable.
The number of intermediaries and the effect of competition tend to reduce the level of remuneration of producers and workers in the global chain. Central purchasing imposes low prices to farmers, who are faced with massive competition from imported products. Downstream distributors are looking to increase their margins, and consumers are finally buying a kilo of tomatoes three to four times more expensive than the price paid to producers.
Models of production: To provide tomatoes all the year at competitive prices, agro-industries choose
models of intensive crop systems under greenhouse, in many cases soilless, to maximize yields and control plant nutrition parameters. This model may nevertheless be presented and even assessed as environment-friendly as inputs are under control and relation with the natural environment is reduced.
Pollution and environmental impacts: Tomatoes produced in Spain make long distance in refrigerated
trucks to be sold in France and others countries, increasing GHG emissions. Almeria is located in a lot of
waste and residues tarps scattered around sites of production. However, the area has official landfills and recycling plans, but they are scarce and expensive, prompting farmers to burn their waste on site. Fertilizers and pesticides are also used in large quantities. They accumulate in soils and waters, disrupting the functioning of ecosystems.
Working conditions and labour rights: The search for economic competitiveness by tomato growers in
Almeria is associated with a hiring strategy of foreign workers enabling companies to minimize labor cost. The respect of labor rights and descent living conditions are strong issues in this agricultural region. Moreover, workers are the first exposed to the effects of chemicals used in greenhouses. Local chains also appear, in some cases, as sources of moonlighting with difficult working conditions.
Workers and consumers health: While workplace exposure to pesticides has a direct impact on workers
(production, processing crops, health programs, etc.), the population is exposed primarily through its food and its environment. Tomato consumption may be questioned as far as chemicals use may be important and little controlled, both in global and local conventional chains, beyond official regulations.
4. Research Design
4.1. Global design of research: an iterative process
We implemented an iterative process to get the final list of research questions, attributes and indicators of performance that will be assessed through the present case studies.
1. Definition of a first set of research questions regarding the main issues of global and local tomato chains in Spain and France from the quickscan reports, further discussions between the French and Spanish teams and a thorough literature review
2. Selection of relevant attributes regarding these questions
3. Mind map of the relations between research questions and attributes
4. Selection of indicators from available lists of sustainability indicators or from more focused works (especially in the social dimension)
5. Comparison of the selected indicators with the available data, experts’ points of view and Spanish team objectives
6. Modification of research questions and adaptation of the list of relevant attributes
7. Definition of relevant and assessable indicators regarding the new list of research questions: different choices between the French and Spanish teams
8. Definition of sub-indicators for complex indicators
9. Characterisation of each indicator or sub-indicator considered as a chain descriptor 10. Benchmark of each indicator or sub-indicator of chain performance
4.2. Final list of Research Questions
1. How and at which stage does each chain create added value and how is this added value distributed among actors, including farms’ employees?
This question is also a way to cross economy and environment: in what extent added value is created through environment preservation? (e.g. through ancient varities, etc.)
2. How and to what extent do the two chains contribute to the national, sectorial, territorial economy, including employment?
This question leads to include taxes in the assessment.
3. How and to what extent are the two chains physically accessible, economicallyaffordable and socially trustfull?
A national enquiry in France showed that short chains are used by 42% of the French population but that their use remains limited because short chains are too difficult to access (lack of time, lack of visibility...) (François et al., 2014).
4. At which level and to what extent does each chain favour both autonomy and cooperation?
“Autonomy” and “cooperation”, often addressed in literature, are complex and highly discussed concepts that need innovative indicators: the GLAMUR project is an opportunity to deepen such important issues. 5. How and to what extent does each chain consume, preserve, deteriorate, reproduce or improve natural resources?
This question is more complex than the others as far as it needs a longitudinal approach. However, this is a crucial issues regarding the transiton of food chains towards sustainabillty. Our work may give some tracks, if not results.
4.3. Final list of attributes and indicators
4.3.1. Final list of selected attributes
As mentiones before, we made a first list of attributes and indicators related to our research questions based on a review of existing performance grids (notably, SAFA) and more focused research works. Comparison with the available data and experts’ points of view, discussions with the Spanish team and working sessions to prepare data collection led us to modify both attributes and indicators. However, we kept the ambition to cover the maximum of dimensions of performance, especially the social and ethical ones, even if there may appear more difficult to assess than the others. Some attributes are linked to different dimensions.
Table 4: Selected attributes of performance of the case studies (attributes are associated with the main dimension to which they belong but we put in brakets how they may also contribute to another dimension)
DIMENSION ATTRIBUTE
Economic
1.Contribution to economic development 2.Creation and distribution of added value 3. Affordability Environmental 4.Biodiversity 5.Pollution 6.Ressource use Social
7.Information and communication 8.Connection
9.Territoriality (+ 2, 3, 11, 12, 13)
Health 11.Food safety
12. Nutrition
Ethical 13.Labor relations
(+ 2, 3, 7)
4.3.2. Final list of indicators
The iterative process between research design and confrontation to data, experts and colleagues led to a final list of indicators, relevant to assess the research questions. However, the final list remains a working list: the GLAMUR project is an opportunity to test the relevance and the feasibility of the selected indicators in order to assess food chain performance. This test is a result in itself, as well as the redefinition of indicators.In available grids as SAFA for instance, indicators are still general or complex, and often difficult to assess directly. A more operational definition, focused on what has to be measured, scored or qualified, is needed to assess SAFA indicators.
From a first list of 13 attributes and 45 indicators, we consolidated a list of 13 attributes and 31 indicators, both quantiative and qualitative. The Spanish team chose to focus on a smaller list of indicators, mainly quantitative.
Note that some indicators are still a synthesis of other indicators: for instance, the ‘GHG emisions’ requires the implementation of a Life Cycle Assessment method to be calculated.
4.4. Contextualizing and benchmarking of the indicators
The process of definition and contextualization of each indicator has been implemented from litterature review and collection of references in order to develop a set of benchmarks to score performance. We also mobilised experts from scientific and technical areas to support this process, either during individual interviews or through a collective workshop in Montpellier.
The table bellow shows the list of experts we mobilized in the process of indicators and benchmarks definition and validation.
Table 5: panel of experts mobilized in the study case
Name of the expert Organization Area of expertise
Martine Padilla CIHEAM, research – FLONUDEP European project
Food Chain global approach, specialist in nutrition/consumers issues
Fatima el Haddad Gautier CIHEAM / UMR MOISA, research Governance of global value chain Selma Tozanli CIHEAM / UMR MOISA, research Governance of LFC, of GVC Dominique Grasselli CTIFL Technical institute Economic approach of tomato
chains
Mireille Navarrete Agricultural research INRA Cropping systems
Zouhair Bouhsina Agricultural research INRA Economy and relations among chain actors, Fruit and vegetable specialist
Valérie Séné INTERFEL, interprofesional organization
Governance and commercial relations in the vegetables chains Benoît Jeannequin Agricultural research INRA Cropping systems, specialist of
vegetable production in global chains
Marc Voltz Agricultural research INRA Soil mechanisms and interaction plant-soil
Alain Arrufat CIVAM 66, farming development association
Specialist of vegetable production
Gilles Planas Chamber of Agriculture 66, extension agricultural organism
Specialist of vegetable production
4.5. Final methological matrix
Benchmark ranking Benchmark
Sub-indicators Method for assessment and
resources Unit Indicator Attribute High : France 28 000€ (Agreste, 2013); Spain 21662 € (MAAMA, 2013) Medium : France 14000€ ; Spain 10831€ Low : 0 Compare the net income for farmers to the national average for the same type
of crop system
In France : 25400€ (2013) Annual disposable income obtained by
farmers EUR/FTE (farm) Net Income Co nt rib ut io n to e co no m ic de vel op m en
t High : 2,5 national average
for vegetable sector Medium : 1,25 Low : 0 Direct employment created at the level
of the production.
Both salaried and non-salaried work have been included
FTE/ha (Full Time Equivalent) 1 FTE = 229 working days/year, 1 607 h Contribution to employment High : 8 Medium : 4 Low : 0 1. score of 0 to 2 1.a. if > 10€/m2(1 point) 1.b. if > 15 000 €/ha (1 point) 2. score between 0 and 4 3. score between 0 and 2 (check number of standards applied by farmers/organizations) 4. score between 0 and 2 (deducted)
1. installation costs
1.a. greenhouses (€/m2) (except land,
including subsidies) 1.b. agricultural land cost
2. degree of concurrency in the chain [check: number and type of operators for the same product, regulation barriers] 3. Application of specification / private voluntary standards (sanitary requirements, quality)
4. Implementation of strategies to enter the market (risks and flows rationalization, logistical platform, resource pooling, long winter crop cycles, engaging consumers) Check factors that limit market access
for producers and producers organization (global)
Level of difficulty to enter the chain according to chain actors Ordinal Four categories Access to market High : 1,8 Medium : 0,9 Low:0 Calculate the added value created for one kilo of product and received by the
farmers. Check the amount of added value per
kilogram of product sold EUR/kg Added Value Cre at io n a nd d ist rib ut io n o f a dd ed va
lue High : 5,85 Medium : 2,93
Low : 0
Added value/m2
Measure the amount of added value per unit of productive land at the level of the farm. EUR/m2 Economic Productivity High : 100% Medium : 50% Low:25% Compare the price paid to the farmers with the price paid by the consumer.
Average annual price obtained by farmer/average annual price paid by consumer (%)
% Share of farmer's price
on retail price
High : 10 Medium : 5 Low:0 1.score between 0 and 4 (1 is
low and 4 is sufficient throughout the year)
2.score between 0 et 2 (2 if self-funding, 1 if self-funding + loans, 0 if no possibility to fund) 3. score between 0 et 2 (2 if positive cash position all the year, 1 if time< 4 months, 0 if time > 4 months)
4.score between 0 and 2 (2 if no debts, 1 if debt ratio< 30% of net assess, 0 if debt ratio > 30% 1.Level of Cash (possibility for the farmer
to collect reasonable level of income throughout the year [local])
2. Ability to finance current investments (small equipment, etc.)
3.Cumulated time during which cash position is negative or not sufficient
4. Debt ratio Identify the trend of the net cash flow
for the enterprise, the cash issues associated and the strategy to solve it Ordinal
Four categories Cash Position
net assess) High : 6 Medium : 3 Low:0 1.yes = 1 point / no 2.yes = 1 point / no 3. score between 0 and 2 (0 is high volatility, 2 is stable prices)
4. yes = 1 point / no 5. yes = 1 point / no 1. access to relevant information for pricing
2.capacity to fix or negotiate the sale price 3.level of volatility of the market prices (eg differentiation of marketing channels) 4.long-term commitment with an agreed minimum price
5.availability of mediation systems / communication for negotiating prices and contracts
Qualitative indicator Focuses on the type of policies and practices of buyers which recognize and support two dimensions: primary producers’ rights to fair pricing; and primary producers’ rights to fair contracts or agreements. Assesses the rules of negotiation between producers and buyers. Proxy to assess how chains favour fair trade. Ordinal
Price decision-making
High : 4 Medium : 3 Low : 2 Check the average retail price of the
product for the considered period EUR/kg Retail price Affo rd ab ili ty High : 8 Medium : 4 Low : 0 1.yes / no (yes = 0) 2. yes / no (yes = 1)
3. delay<2 years = 0), between 2-4 years = 1,> 4 = 2 (excluding Solanacae) 4. yes/ no (yes = 1) 5. yes / no (yes=1) 6. yes=1 7. yes / no (yes = 0) 1. Limited area to produce under
greenhouse 2. Crop rotation
3. Delay in return of culture 4. Addition of green manure in intercropping
5. Organic fertilization
6. Preference for practices to soil protection 7. Use of heavy machinery
Assessment of the implementation of the best farming practices regarding the structure and the texture of the soil Ordinal Seven categories Soil management practices Bi od iv er sit y High : 8 Medium : 4 Low : 0 1.specialized in solanaceous=0, polyculture<10 species=1, polyculture> 10 species=2 2. : 1<VarTo<5 = 1, 5<VarTo<10 = 2
3. ecological zone (flower strips, grass strops) = 1, integrated management pest = 1 point or biological control= 2) 4. yes/no, yes= + 1 1.Agricultural model:
2. number of tomatoes varieties cultivated on farm
3. Existence of practices to preserve biodiversity
4. Presence of traditional / non-hybrid varieties
Assessment of the level of implementation of the best farming practices regarding functional and natural biodiversity Ordinal Four categories Agro-biodiversity preservation practices High : 0 Medium : 5 Low : 10 1. yes/no (yes = 1 point)
2. score between 0 and 5
3. score between0 et 4 1. Presence of visual waste
2. Degree of alteration of the natural landscape by intensification of agricultural activities [e.g. soil degradation,
conservation of flora and fauna habitat, contribution of the activity to ecosystems connectivity and structural complexity of the landscape]
3. Modification of the landscape
[geomorphological modification , degree of occupation of productive land by the considered agro-system]
Assessment of the worst farming practices regarding landscape Ordinal Three categories Landscape management practices High: 12 Medium: 6 Low:0 1. score between 0 and 2
2. score between 0 and 2 3. score between 0 and 2 4. score between 0 and 2 5. yes/no (yes =1) 1. Limitation and rationalization of
phytosanitary products
2. Limitation and rationalization of fertilizers products
3. use of organic matter amendment 4. soil protection practices: e.g. grassing Sums the practices implemented to
reduce pollution on air, water and soil Ordinal Nine categories Environmental pollution mitigation practices Po llu tio n
w.glamur.eu
26
6. yes/no (yes =1) 7. yes/no (yes =1) 8. yes/no (yes =1 point) 9. score between 0 and 2 (deducted)
5. GHG mitigation practices [reflection of solar radiation, reduction of temperature] 6. preference for local-regional sourcing 7. effluent recovery equipment 8. preference for recyclable material 9. pressure on natural resources [water, land, natural]
Wp4 Evaluation of impact of Greenhouse
effect 100 years (in tonsof CO2 equivalent per unit of product). At the level of the production stages. LCA methodology kg CO2 équivalents/kg GHG emissions High : 6 Medium : 3 Low:0
Calculation method of the final score of performance = 1 - (score / highest value) 1. score between 0 and 3 (1
point per source of waste) 2. score between 0 et 3 (1 point per source of waste)
3. score between 0 et 3 (1 point per practice reducing
waste)[deducted] 1. Production stage : [non used inputs,
agricultural plastic used, residues of by-products of culture]
2. Packaging and distribution stage: [cardboards, papers, plastics] 3. Mitigation practices: [presence of recycling infrastructure in the production area, inputs collection chain, use of renewable material for the production and packaging of the product]
Qualitative indicator to identify the expression of different sources and types of waste along the chain linked with actors practices.
Checks the presence of each type of waste or wasting practice. Ordinal
Material waste
WP4 Assesses the non-renewable primary
energy consumption at the production stage MJ equivalent/kg Energy Consumption Re so urc e use High : 12 Medium : 6 Low: 0
Calculation method of the final score of performance = 1 - (score / highest value) 1. score between 0 and 4
1.a. yes/no (yes=1) 1.b. yes/no (yes= 1) 1.c. yes/no (yes= 1) 1.d. yes/no (no=1) 2. score between 0 et 4 2.a. if >2 steps= 1 2.b. if >100km=1 2.c. yes/no (yes=1) 2.d. yes/no (yes 1) 3. score between 0 and 4 3.a.yes/no (yes=1) 3.b.iftimei<7 days=0, if >7 days=1 3.c. yes/no (no=1) 3.d. yes/no (yes=1) 1. Production stage :
1.a. product fragility
1.b. over-exploitation of primary production
1.c. calibration norms
1.d. valuing of non-sold or 2nd category
2. Agro-food process and logistics stages : 2.a. number of steps in which product is handled
2.b. scale of marketing 2.c. packaging 2.d. warehousing 3. distribution stage : 3.a. product handling 3.b. time harvest-consumption 3.c.display rationalization 3d. product crushing Assesses the expression of micro and
macro factors impacting loss of product along the chain
Ordinal Three categories Loss of product along
the chain
High : 4 Medium : 2 Low:0 1. choice : drip (1pt), sprinkler(0
pt), hose pipe(0 pt)
2. watering during the day (0 points), watering morning and / or evening (1 point)
3. yes/no (yes=1 point) 4. public network (1 point), river, rain water pumping ground water (1 point), water from a desalination plant(0 pt), no control of water use (0 pt) 1. technology and equipment do you use
for irrigation 2. irrigation practices
3. technology and strategies for water preservation [sprinkler, mulching, watering in the evening / morning tighter crop hoeing]
4. Main source of water for irrigation use by farmers : [hierarchization of the sources of the most harmful to the sustainable / renewable]
Measure the water management practices used by the farmers and industry in the chain and assess the competition of agriculture to human water consumption. Ordinal Four categories Water consumption practices
w.glamur.eu
27
High : 8 Medium : 4 Low:0 1. yes/no (yes =1t) 2. yes/no (yes =1) 3. yes/no (yes =1) 4. yes/no (yes =1) 5. yes/no (yes =1) 6. yes/no (yes =1) 7. yes/no (yes=1) 1. environmental or social performance
2. geographic origin 3. production methods 4.harvest date
5. direct communication between producer-consumer
6.website available
7. In addition 1 point if other key information given to consumers : nutritional quality, ingredients…)
Assess the ability of chain actors to communicate and share information to consumers.
Checks the number and nature of key information available for consumer Ordinal Sevencategories Transparency for consumer Info rm at io n and c om m uni ca tio n High: 4 Medium: 2 Low:0 1. yes/no (yes =1)
2. score between 0 and 2 3. yes/no (yes=1) 1. pedagogic activities on farm
2. pedagogic/
Awareness-raising actions to food activities in selling point
3. actions to promote fruits and vegetables consumption
Assess the capacity of chain actors to raise consumer awareness on topics related to the product, impacts, consumption, etc. Ordinal Threecategories Pedagogic contribution High : 10 Medium : 5 Low : 0 1. score between 0 and 2
1.a. yes/no (yes=1) 1.b. yes/no (yes=1) 2. score between 0 and 4 2.a. yes/no (yes=1) 2.b. yes/no (yes=1) 2.c. yes/no (yes=1) 2.d. yes/no (yes=1)
3. score between 0 and 4
3.a. yes/no (yes=0)
3.b. yes/no (yes=1) 3.c. yes/no (yes=1) 3.d. yes/no (yes=1) 1. Imposed relationship or chosen by the
producer
1.a. choice of suppliers by producers 1.b. match between supply and demand 2. Quality of service
2.a. timely delivery
2.b. mutual communication and making producers informed on progress and developments
2.c. technical advice provided by the supplier
2.d. satisfaction with the existing advice and services
3. strategy to minimize the risk and diversify suppliers when it is more appropriate: stability and diversity of relations
3.a. fluctuations in the relations with suppliers
3.b. diversification of suppliers
3.c. integration in an association providing support and advice
3.d. facilities to change of commercial partner
Qualitative indicator to measure the level of connection between producers or producer organization and suppliers Ordinal Three categories Relationships with suppliers Co nn ex io n High : 16 Medium : 8 Low : 0 1. yes/no (yes=1) 2. score entre 0 et 4 3. score entre 0 et 4 4. yes/no (yes=1)
5. yes/no (yes=customers not stabilized=0)
6. score between 0 and 4 7. yes/no (yes=1) 1.relation chosen by the producer/coop
2. diversification of customers 3. facilities to change of customers [capacity to substitute after customer leave] 4. relation formalized through a contract 5. prospect of customers
6. level of requirements of customers (specifications, complexity) 7. existence of a coordination device Qualitative indicator to measure the
level of connection between producers/cooperative and customers Ordinal Seven categories Relations with customers High : 14 Medium : 7 1.score between 0 and 4
2.score between 0 (no advice 1. number of collective agricultural actions
implying producers Qualitative indicator to measure the
level of connection between farmers Ordinal
Four categories Cooperation between
farmers
Low : 0 relations) and 4
3. score between 0 and 4
4. score between 0 and 4 2. existence/regularity/usefulness of
advice relations with peers
3. implication of farmers in cooperative or collective actions management
4. number of territorial actions implying producers and favouring their meeting
High : 8 Medium : 4 Low : 0 1. yes/no (yes=1) 2. yes/no (yes=1) 3. yes/no (yes=1) 4. yes/no (yes=1) 5. score between0 and 4 1. physical proximity between
producer/coop and consumer 2. sale on farm
3. welcome on farm
4. existence of a mediation between producer and consumer
5. frequency of meeting between producer/coop and consumers Considered actor : local=producer,
global=cooperative
Assesses the capacity of a supply chain to strengthen links between producers and consumers, such as developing communication, sharing information Ordinal Five categories Producer-end-consumer link High : 8 Medium : 4 Low:0 1. score between 0 and 4
2. score between 0 and 4 1. implication of chain actors in local life
2. local social externalities: funding of social activities, social innovation… Assesses socio-cultural relations and
externalities linked with food chains, contributing to create social cohesion Ordinal Three categories Contribution to territorial cohesion Te rri to ria lit y High : 10 Medium : 5 Low:0 1. score between 0 and 2
2. score between 0 and 5 2.a. production contribution yes/no (yes= 1), packaging and distribution yes/no (yes = 1) 2.b. creation yes/no (yes=1), distribution yes/no (yes=1), 2.c. yes/no (yes=1) 3. score between 0 and 3 3.a. yes/no (yes=1) 3.b. yes/no (yes=1) 3.c. yes/no (yes=1point) 1. Environmental links (landscape
management, improvement of biodiversity) 2. Economical
2.a. direct employment contribution 2.b. creation and distribution of added value for territory
2.c.Involvement of enterprises in territorial project (Agrotourism project, patrimonial conservation)
3. Cooperation
3.a. Creation of partnership in the territory 3.b. Diffusion of knowledge in the territory 3.c. Local diffusion of technology and innovations
Measures the level of connection with the territory along the chain. Taking in account different ways to make links with the territory: identifies number and nature of links and score.
Ordinal contribution to territorial development High : 8 Medium : 4 Low:0
Calculation method of the final score of performance = 1 - (score / highest value) 1. if ASI<1700 = 0 point), if
ASI>1700 (= 1 point) 2. score between 0 and 2 2.a. yes/no (yes=1) 2.b. yes /no (yes=1) 3. green-yellow-green (1), orange-red (0)
4. score between 0 and 2 ; zero steps=0,< 2 steps=1, > 2 steps=2
5.< 1 day=0, 1<T<3=1, >3=2 1. annual solar irradiation
(ASI)(kwh/m2/year) 2. Influence of temperature:
2.a. heat episode > 30°C during growing period
2.b. Cold episode with temperatures <10°C=1, during the growing period 3. Harvest: ripening stage[green-yellow-green, red-orange to deep red] 4.Number of steps between farm and consumption
5.Freshness: Time between harvest and retail
Checks the influence of bio-physical parameters on the final quality of the product [antioxidants: lycopene, vitamin E, vitamin C and flavonoids]
Ordinal Five categories Nutritional quality Nu trit io n
w.glamur.eu
29
Table 6: detailed methodological matrix of indicators used in the study case
High: 8 Medium: 4 Low:0 1.score between 0 and 4
[number of different standards] 2. yes/no (yes=1)
3.yes/no (yes =1) 4. yes/no (yes =1) 5. yes/no (yes =1) 1. Application of standards on products
[Organic Farming, Compliance Certification, Distributor specifications]
2. Implementation of auto-control device 3. Existence of control system between producers and consumer
4. Existence of quality management system along the chain [HACCP, ISO…]
5. Control and monitoring by third-party organisms
Checks whether there are effectively processes to prevent and control food hazards and food contamination Ordinal
Five categories Traceability System &
Control Measures Fo od sa fe ty
High : 40 (European legal average minimum ) Medium : 50<x<60 Low : >70 hours/week Calculation method of the final score of performance = 2- (score/highest value) Calculate the average number of
worked hour per day by the farmer (not workers) h/week Workload La bo r r el at io ns High : 8 Medium : 4 Low:0 1. score between 0 et 4 2. score between 0 et 4 1. Access to in-service training by managers
2. Access to in-service training by workers Assesses the contribution of the chain to
strengthen skills [technical,
organizational, marketing] of farmers and workers through in-service training Ordinal
Two categories Contribution to human
capital
5. Methods of Data collection and analysis
5.1. Plan for data collection
5.1.1. General Source of data
Data sources Local chain in France Global chain France to Spain
Primary data (quantitative and qualitative)
Local farmers (2 samples; 60 producers)
Director of the 2nd degree
cooperative platform in France Fruits and Vegetables coordinator for System U buying center
Secondary data Databases and national statistics Regional department of Agriculture Articles
Professional reports
Book keeping of cooperatives Reports from retail groups Articles
Websites
Table 7: source of data
5.1.2. Method and source of secondary data
Tomato is one of the ‘model plant’ in national agricultural research (INRA): many data have thus been produced and many research and research-development projects have been implemented. A difficult and time-consuming job was nevertheless to gather all the available information, to look at the conditions in which data have been produced, to select the relevant sources. In parallel, technical institutes, professional organisations produced a lot of data on tomatoes. The GLAMUR project is an opportunity to build a specific data base on tomatoes: we coded all the available sources according to their relevance and to our list of indicators.
5.1.3. Collection of primary data
Table 8: compared interest of focus group and interviews
The GLAMUR project is an opportunity to value previous interviews with farmers and traders of vegetable chains in South of France, already focused on sustainability issues (Chiffoleau, 2009, 2012; Bellec-Gauche, Chiffoleau, 2015). Some of them have been reinterviewed in order to update or get complementary and new actors have been enquired in the global chain.
5.2. Data analysis and ranking
We followed the SAFA approach and translated all quantitative and qualitative scores in percentage scores of performance.
5.3. Data quality check
5.3.1. For secondary data
Quality of secondary data requires to archive additional information with the data itself; information should at least include the study purpose, operationalization, data collection details (who, when, and where), entities being studied and sampling criteria, and any known biases (Hox, Boeije, 2005).
5.3.2. For primary data : Pedigree matrix approach
The criteria in controlling data quality are representatively, reliability and pertinence. In order to check the quality of data stability, equivalence and homogeneity, we used the pedigree matrix approach to measure the 'real' level of quality of data (Ciroth et al., 2015).
The data quality score (DQD) has to be calculated for each data so an automated calculation is necessary and then averages can be made to assess the overall data quality.
We considered an “adequate period” for the data collection. We wanted to ensure temporal correlation between our results and the situation observed. Although, some data were quite old and had to be verified/adjusted/updated, some of them were available for a period of 3 or 5 years, others only available for one year. So the quality of data we collect fluctuates and is function of the source: we tried to take it in account
.
Indicator LOCAL CHAINS GLOBAL CHAIN
Total DQD Quality class Total Quality class
Price to consumers per unit of product 0,2 A 0,2 A
Soil management practices 0,2 A 0,8 B
Agro-biodiversity preservation practices 0,2 A 0,8 B
Landscape management practices 0,4 A 0,8 B
supplier relationship 0,2 A 0,4 A customer relationship 0,4 A 0,4 A Farmers cooperation 0,4 A 1,2 A Producer-consumer link 0 A 0,8 B Economic Productivity 0,2 A 0,4 A Contribution to employment 0,2 A 0,4 A
Access to the market 0,2 A 0,4 A
Net Income 0,2 A 0,8 B
Share of farmer's price on retail price 0 A 0,2 A
Added Value 0,2 A 0,8 A
Cash Position 0,2 A 0,4 A
Price decision-making 0 A 0,4 A
Limiting factor in Nutritional quality 0,4 A 0,4 A
Traceability System & Control Measures 0,2 A 0,4 A
Pedagogic contribution 0,2 A 0,6 A
Transparency for consumer 0,2 A 0,6 A
Hourly wage 0,4 A 0,4 A
Workload 0,2 A 0,8 B
Contribution to human capital 0 A 0,4 A
Environmental pollution mitigation practices 0,2 A 0,6 A
GHG emissions 0,2 A 0,6 A
material waste 0,2 A 0,4 A
Energy Consumption 0,4 A 0,4 A
Waste and loss of products along the chain 0,4 A 0,4 A
Water consumption practices 0 A 0,2 A
Contribution to territorial cohesion 0,4 A 0,4 A
contribution to territorial economic development 0,4 A 0,4 A
6. Results: indicators of performance
6.1. Economic dimension
6.1.1. Attribute Contribution to economic development
Indicators and sub-indicators
Local chain Organic local chain Global chain Economic Productivity (EUR/m2) [2,8 - 4]=58% [4,6 - 7,1]=100% [2,2 - 3,2]=46% Contribution to employment (FTE/ha) [2,3 - 2,5]=96% [2,2 - 2,5]=94% [1,57 - 2,3]=77%
Access to the market 88% 75% 50%
Indicators and sub-indicators
Relevant indicator to differentiate Local from Global?
Comparison about performance of Local and Global Comment Economic Productivity (EUR/m2) Yes
Local Organic > Local conv. > Global
We calculated added value/ha, at production level. Local chains perform better than global ones
because of: a higher yield in conv., a higher price/kg. The highest value of benchmark = highest
value of organic local
Contribution of production to
employment (FTE/ha)
Yes Local>Global jobs/ha. We were not in a position to assess jobs for At production level, local chains represent more all the chains.
Access to the
market Yes Local conv.>Organic Local>Global Installation in global chains is costly and markets are very competitive.
Figure 8 : Economic Productivity -Added value per unit of land
Figure 9 : Contribution of production to employment
Figure 10 : chain performances for attribute Contribution to economic development