HAL Id: hal-01608285
https://hal.archives-ouvertes.fr/hal-01608285
Submitted on 25 May 2020HAL is a multi-disciplinary open access
archive for the deposit and dissemination of sci-entific research documents, whether they are pub-lished or not. The documents may come from teaching and research institutions in France or abroad, or from public or private research centers.
L’archive ouverte pluridisciplinaire HAL, est destinée au dépôt et à la diffusion de documents scientifiques de niveau recherche, publiés ou non, émanant des établissements d’enseignement et de recherche français ou étrangers, des laboratoires publics ou privés.
Fungal adaptation to contemporary fungicide
applications: the case of Botrytis cinerea populations
from Champagne vineyards (France)
Anne-Sophie Walker, Virginie Ravigné, Adrien Rieux, S. Ali, Florence
Carpentier, Elisabeth Fournier
To cite this version:
Anne-Sophie Walker, Virginie Ravigné, Adrien Rieux, S. Ali, Florence Carpentier, et al.. Fungal adap-tation to contemporary fungicide applications: the case of Botrytis cinerea populations from Cham-pagne vineyards (France). Molecular Ecology, Wiley, 2017, 26 (7), pp.1919-1935. �10.1111/mec.14072�. �hal-01608285�
Accepted
Article
This article has been accepted for publication and undergone full peer review but has not
been through the copyediting, typesetting, pagination and proofreading process, which may
lead to differences between this version and the Version of Record. Please cite this article as
DR. ANNE-SOPHIE WALKER (Orcid ID : 0000-0002-1246-246X)Received Date : 05-Jul-2016 Revised Date : 13-Feb-2017 Accepted Date : 13-Feb-2017 Article type : Special Issue
Fungal adaptation to contemporary fungicide applications:
the case of Botrytis cinerea populations from Champagne
vineyards (France)
A-S. WALKER1*, V. RAVIGNE2,3, A. RIEUX2,3, S. ALI4,5, F. CARPENTIER1 and E. FOURNIER4
1
UMR BIOGER, INRA, AgroParisTech, Université Paris-Saclay, Avenue Lucien Brétignières, 78850 Thiverval-Grignon, France
2
CIRAD, UMR PVBMT, 97410 Saint-Pierre, Réunion, France
3
CIRAD, UMR BGPI, 34398 Montpellier, France.
4
UMR BGPI, INRA, CIRAD, Montpellier SupAgro, TA A 54/K, Campus international de Baillarguet, 34398 Montpellier cedex 5, France
Accepted
Article
*anne-sophie.walker@inra.fr ; Fax: +33 1 30 81 53 06
Keywords: selection, migration, resistance cost, diversity, fungicide resistance modelling
Running title: Fungicide selection in B. cinerea populations Abstract
In addition to being one of the most acute problems impeding chemical control of fungal diseases, the evolution of fungicide resistance is an emblematic case of local adaptation to spatially heterogeneous and temporally variable selection pressures. Here we dissected the adaptation of
Botrytis cinerea (the causal agent of grey mould) populations on grapes to several fungicides. We
carried out a two-year survey (four collection dates) on three treated/untreated pairs of plots from vineyards in Champagne (France), and monitored the frequency of four resistant phenotypes that are unambiguously associated to four distinct genotypes. For two loci under selection by currently-used fungicides (MDR1 and MDR2), the frequencies of resistant mutations at vintage were greater in treated plots compared to untreated plots, showing that the effect of selection is detectable even at the plot scale. This effect was not detectable for two other loci under selection by previously-used fungicides (BenR1 and ImiR1). We also found that treatment with currently-used fungicides reduced
B. cinerea effective population size, leading to a significant decrease in genic diversity and allelic
richness in treated versus untreated plots. We further highlight that even under ample drift and migration, fungal populations can present an efficient response to selection. Finally, for the four studied loci, the costs of fungicide resistance were estimated by modelling the decrease in the frequency of resistant mutations in the absence of treatment. We discuss the importance of these estimates for defining strategies for limiting or counteracting the local adaptation of pests to fungicides.
Accepted
Article
Introduction
Since the ‘green revolution’, agriculture has much suffered from omitting the important evolutionary potential of plant pathogens. Plant pathogens have proved their capacity to adapt to homogeneous selection pressures even in species that do not necessarily combine the traits usually associated with high evolutionary potential (e.g. mixed mating system and high potential for gene flow; McDonald & Linde 2002 and within examples of pathogens exhibiting high risk of adaptation to plant resistance genes). The introduction of spatio-temporal heterogeneity in agricultural systems is considered a key avenue for sustainable management of plant pathogens (Mundt 2014; Rex Consortium 2016). But the precise design of such strategies requires a fine understanding of the mechanisms underlying the local adaptation of plant pathogens. Local adaptation results from the tension between selection on the one hand and migration and drift on the other. Estimating the intensity of these evolutionary forces is therefore an important step towards proposing evolutionary-proof management strategies (Lenormand et al. 1999; Milgroom 1989; McDonald & Linde 2002). It has however very seldom been achieved in the context pf plant pathogens.
Pesticides were introduced decades ago, to protect crops against pests and to guarantee yields. Pesticides are still widely applied, despite pressure from society to decrease their use in modern agricultural ecosystems. Pesticides constitute a major selective force on pathogen and pest populations (Stukenbrock & McDonald 2008) and create spatially heterogeneous and temporally variable local environments. Fungicide applications can alter the genetic composition of fungal populations by favouring resistant genotypes over susceptible ones. Fungicides can greatly decrease the size of fungal pathogen populations and shape population diversity. Adapted fungal strains are easy to describe and quantify in populations since they develop resistance to fungicides (Ishii & Hollomon 2015). About 300 cases of resistance to fungicides with 30 different modes of action have been reported in 250 species of phytopathogenic fungi (Fungicide Resistance Action Committee database; http//www.frac.info). Resistant genotypes present changes relative to the wild type in one
Accepted
Article
or several genes (point mutations, deletions or rearrangements). These changes cause a decrease in susceptibility to the pesticide and are transmitted to the pathogen progeny. In the absence of the pesticide (i.e. in untreated areas), pleiotropic effects associated with the resistant allele may result in a fitness penalty penalising the genotypes carrying this allele (Fisher 1930; e.g. Lalève et al., 2014). Therefore, fungicides constitute a good model to study rapid and strong local adaptation in organisms with short generation times and high population sizes.
Resistance to pesticides is a major issue for agronomy and food production, because of the associated crop yield or quality losses. Moreover, the generalisation of resistance in pest populations often leads to greater pesticide consumption, which is costly for farmers and detrimental to the environment and human health. Last, but not least, the number of modes of action available is limited. For all these reasons, developing sustainable strategies of fungicide use is a crucial issue for modern agriculture. Anti-resistance strategies (namely mosaic, alternation, mixture and dose modulation) rely on different mechanisms. Among them, only mosaic and alternation may allow the expression of resistance costs between generations. Determining the respective magnitudes of the evolutionary forces at work in a given system subject to spatially heterogeneous selection is of major importance, as this is the first step towards defining strategies for limiting, disrupting or counteracting the local adaptation of pests (Lenormand & Raymond 1998; REX Consortium 2013). Several evolutionary forces may operate in heterogeneous landscapes where treated and untreated areas are embedded. In treated areas, the positive selection exerted by pesticides promotes resistant genotypes (Barton et al. 2007). Decreases in population size due to pesticide treatment also amplify genetic drift, leading to a decrease in genetic diversity and the loss or fixation of rare alleles. In untreated areas (whether never treated or treated in the past), fitness penalty of resistant genotypes (i.e. resistance cost) leads to negative selection on these genotypes, thus to a decrease in resistance frequency. Opposing these effects, migration between treated and untreated populations homogenises allele frequencies. The mode of reproduction may also affect resistance frequency: asexual reproduction causes linkage along the genome, and especially between alleles at neutral and
Accepted
Article
selected loci, whereas sexual reproduction shuffles allelic associations, depending on time and recombination rate. The balance between all these evolutionary forces and the constraints imposed by the mode of reproduction and the genetic architecture of resistance determines the outcome of population evolution, and depends on pest biology on the one hand, and the nature and intensity of environmental and anthropogenic constraints on the other.
Botrytis cinerea is a necrotrophic ascomycete fungus that causes grey mould, together with
its cryptic sister species, B. pseudocinerea (Walker et al. 2011), on more than 2000 host plants (Elad
et al. 2016). It can infect dead or living plant material (Martinez et al. 2003), and it decreases crop
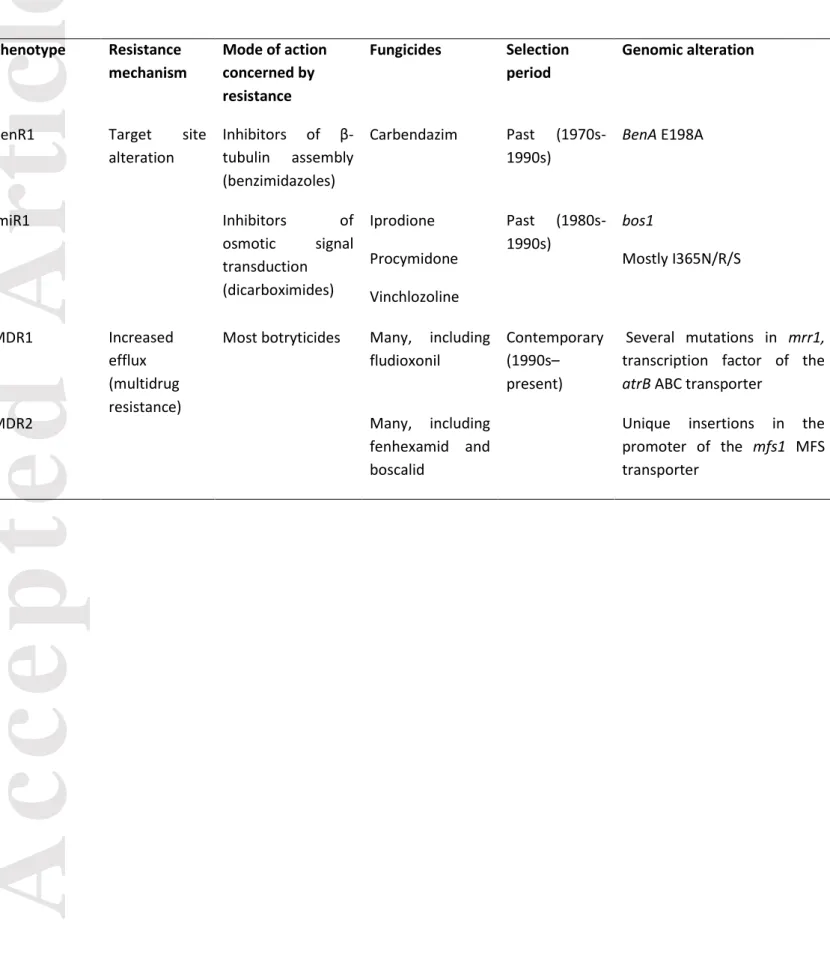
yield and quality, especially on perennial hosts, such as grapevine. Botrytis cinerea is known to be highly variable with substantial genetic diversity and populations experiencing regular recombination, especially on outdoor crops (Fournier & Giraud 2008; Giraud et al. 1997; Walker 2016). Populations display a geographical structure only at the continental scale (Isenegger et al. 2008). Differentiation due to the host plant and limited geographical subdivision at a country scale have been documented (Fournier & Giraud 2008; Karchani-Balma et al. 2008; Walker et al. 2015). In French vineyards, grey mould is controlled principally with fungicide sprays (0 to 3 per year, depending on the vineyard and epidemics intensity), with six modes of action and fourteen molecules deployed since the 1970s (Supplementary Information 1). The older modes of action (inhibitors of β-tubulin assembly -benzimidazoles- and some inhibitors of the osmotic signal transduction - dicarboximides) are no longer used. The contemporary fungicide selection is mainly exerted by four modes of action (two categories of respiration inhibitors, inhibitors of cell cycle progression, and inhibitors of sterol demethylation). Resistance to most modes of action of fungicides has arisen mainly through specific resistance mechanisms, determined by single or few mutations in the gene encoding target proteins. Patterns of cross resistance and genomic determinants, when known, are fully described in Supplementary Information 1. The resistant phenotypes to the different modes of action, and therefore, the corresponding specific mutations, can unambiguously be scored through routine monitoring using adapted discriminating doses of
Accepted
Article
fungicides (Walker et al. 2013). Moreover, an additional resistance mechanism, distinct from target site alteration and associated to broad-spectrum resistance, was also selected in vineyards in the mid-1990s, possibly after the concurrent use of the modern modes of action cited above. This multidrug resistance (MDR) is mediated by an increase in drug efflux outside of the fungal cell. Three phenotypes (MDR) can be distinguished according to their high resistance to tolnaftate (a squalene epoxidase inhibitor used as a drug and in field monitoring to discriminate these strains) and to their distinctive patterns of cross-resistance between unrelated modes of action (Leroux & Walker 2013). The MDR1 phenotype corresponds to numerous point mutations in the transcription factor of the atrB ABC transporter, and the MDR2 phenotype corresponds to two rearrangements in the promoter of the mfsM2 MFS transporter (Kretschmer et al. 2009; Mernke et al. 2011). The MDR3 phenotype results from the natural hybridization of the two previous MDR phenotypes and therefore combines both genomic changes. To our knowledge, the amplitude of the selective response of B. cinerea populations to fungicide applicationson grapevine, and the putative existence of associated costs of resistance, have never been studied.
In this study we aimed at understanding the local adaptation of B. cinerea on grape in response to fungicide application. We specifically addressed the following questions: (1) Are the frequencies of resistant mutations higher in the treated than in the untreated plots, following the application of fungicides? (2) Can we detect a reduction in genetic diversity and effective population size in treated plots compared to untreated ones, following the application of fungicides? (3) Can we estimate the costs of resistance associated to resistant mutations? We tracked signatures of selection by studying the spatiotemporal variation of the frequency of resistance at four resistance loci (ImiR1 and BenR1, under past selection and MDR1 and MDR2, under contemporary selection) in three pairs of treated and untreated grapevine plots in vineyards in Champagne (North-Eastern France), over two years. We documented the effect of genetic drift through the investigation of effective population sizes and other diversity indices at eight microsatellite loci, on the same plots. We finally provided two independent estimates of resistance costs under field conditions using this
Accepted
Article
short-term small-scale dataset and a completely independent dataset consisting of historical monitoring data, collected fromall Champagne vineyards since the 1980s (Walker et al. 2013).
Materials and methods
Studied sites and isolate sampling
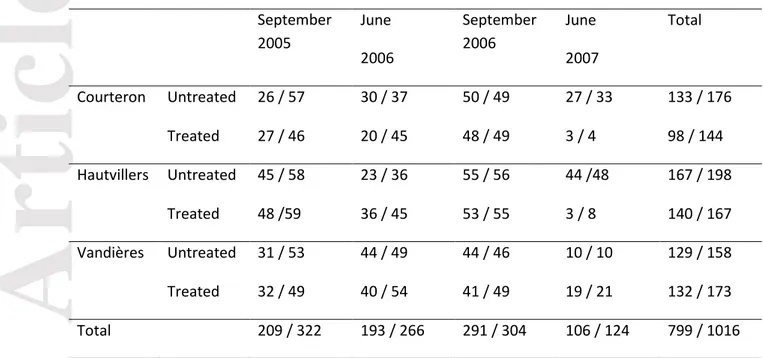
Samples were collected at four dates: September 2005, June 2006, September 2006 and June 2007. The collections in June corresponded to the start of the cropping season, after presumed sexual reproduction in winter and before the first fungicide application against grey mould (Fig. 1 and Walker et al. 2015). September collections took place at the end of the cropping season, just before vintage, after asexual multiplication on the host and after fungicide applications. Samples were collected from grapevine (V. vinifera) at three locations (Courteron, Hautvillers and Vandières), 20 to 208 km apart, in Champagne, France (Table 1). At each site, surveys were carried out on a commercial plot split into two parts. One part of each plot had not been treated with fungicide for at least three years before the start of the experiment, whereas the other part of the plot had been sprayed with fungicide three times per year. The agronomic management of the two parts of the plot were otherwise identical (same grape variety, climatic and soil conditions and cropping practices). The two parts of the plot were separated by at least four rows from which no samples were collected. Chemical protection against disease in the treated part of the plots included, for the three plots and the two years of study: fenhexamid, at the end of flowering, fludioxonil, at bunch closure and pyrimethanil or fluazinam, at veraison. All fungicides were applied at the dose recommended by the manufacturer. B. cinerea was collected with cotton swabs from sporulating lesions on berries in September and from asymptomatic flower caps in June. For the June collections, isolates were obtained after incubation of the plant material in a humid chamber at room temperature until sporulation was clearly visible.
Accepted
Article
Strain isolation and storage
Single-spore cultures were established for all strains. Stocks suspensions of spores in 20% glycerol were prepared for each strain and stored at -80°C until use. When required, single-spore cultures were grown on malt-yeast-agar (MYA) medium (20g.l-1malt extract, 5 g.l-1 yeast extract and 12.5 g.l-1
agar) incubated at 19°C to 21°C, under continuous illumination, to induce sporulation.
Resistance phenotyping
The resistance phenotype of each strain to five modes of action (see below) was established (Supplementary Information 1) by exposure to discriminating doses of fungicides in synthetic medium, followed by the recording of spore germination or germ tube elongation at 24h to 48h after incubation in the dark at 20°C, as previously described (Walker et al. 2013). We searched for specific resistance to five modes of action: benzimidazoles (e.g. carbendazim), which inhibit microtubules (phenotype BenR1); hydroxyanilides (e.g. fenhexamid), which inhibit sterol C4-demethylation (phenotype HydR3); dicarboximides (e.g. iprodione, pyrimethanil), which inhibit osmotic signal transduction (phenotype ImiR1); anilinopyrimidines (e.g. pyrimethanil, cyprodinil), which inhibit cell cycle progression (phenotype AniR1) and carboxamides (e.g.boscalid), which inhibit succinate dehydrogenase (phenotype CarR). We also identified multidrug-resistant strains (phenotypes MDR1, MDR2, MDR3) displaying a nonspecific increase in drug efflux by using a discriminating dose of tolnaftate, a drug inhibiting sterol biosynthesis (Kretschmer et al. 2009; Leroux & Walker 2013). MDR phenotypes are distinguished using specific discriminating doses of fludioxonil and fenhexamid, as their pattern of cross-resistance may differ according to these fungicides. Full descriptions of all phenotypes (EC50s, resistance factors, cross-resistance), as well as
the associated alterations to the target proteins or transporters in field resistant strains are reviewed in the literature (Leroux et al. 1999; Leroux et al. 2002; Walker et al. 2013) and summarized in Supplementary Information 1. Therefore, scoring for resistance phenotypes directly allows the inference of the frequencies of the corresponding resistant mutations.
Accepted
Article
Historical data
Historical data from a long-term resistance survey carried out in Champagne vineyards since the early 1980s were available. This regional sampling has been described in Walker et al. (2013); it included at least 150 to 200 plots representative of the diversity of agronomic situations found in this area, analyzed each year on the basis of September collections. This dataset includes estimates of resistance frequency for the four studied phenotypes (BenR1, ImiR1, MDR1, MDR2) for each plot over 22-32 years. Procedures to collect, phenotype and keep these populations were similar to those previously described for the specific sampling of this paper. No genotyping was achieved in this historical dataset.
Molecular genotyping
Total genomic DNA was extracted with Plant DNeasy kit (Qiagen). All strains were genotyped for eight SSR markers, Bc1, Bc2, Bc3, Bc4, Bc5, Bc6, Bc7 and Bc10 (Fournier et al. 2002), by multiplex PCR, as previously described (Leroux et al. 2010). We checked the neutrality of these markers (Supplementary Information 2). We excluded strains of the cryptic species B. pseudocinerea, which is morphologically similar to B. cinerea, by molecular and phenotypic techniques (Leroux et al. 2002; Walker et al. 2011). Only isolates genotyped for all SSR markers were included in the study (Table 1).
Analysis of population diversity
Within-population diversity was assessed for each site × collection date × disease control strategy (fungicide treated vs. untreated) combination. GENETIX (Belkhir et al. 1996-2004) was used to
estimate gene diversity (HE, unbiased estimate; Nei 1978). Allelic richness (AR), defined as the mean
number of alleles over the eight loci, and private allelic richness (PAR), defined as the number of
alleles detected in one population but absent from the other, were estimated with the rarefaction procedure implemented in ADZE (Szpiech et al. 2008). MULTILOCUS was used to estimate rD, the
Accepted
Article
unbiased index of multilocus linkage disequilibrium (Agapow and Burt 2001). Departure of rD from 0,
corresponding to the null hypothesis of complete panmixia, was tested using 1000 randomizations.
Statistical analysis
We analyzed the effect of fungicide treatment on the genetic diversity of B. cinerea populations using three-way ANOVAs on HE, AR and PAR indices with treatment, collection site and date as fixed
factors. A second order interaction term was integrated or not according to a stepwise procedure based on Akaike information criterion (AIC). Adjusted means for treated and untreated plots were computed and their difference was tested. Similar analyses were conducted on resistance frequency (phenotypes BenR1, ImiR1, MDR1 and MDR2). All analyses were performed with the statistical program R version 3.3.1 and the car and lsmeans packages (R Core Team 2016).
Detection of changes in population size
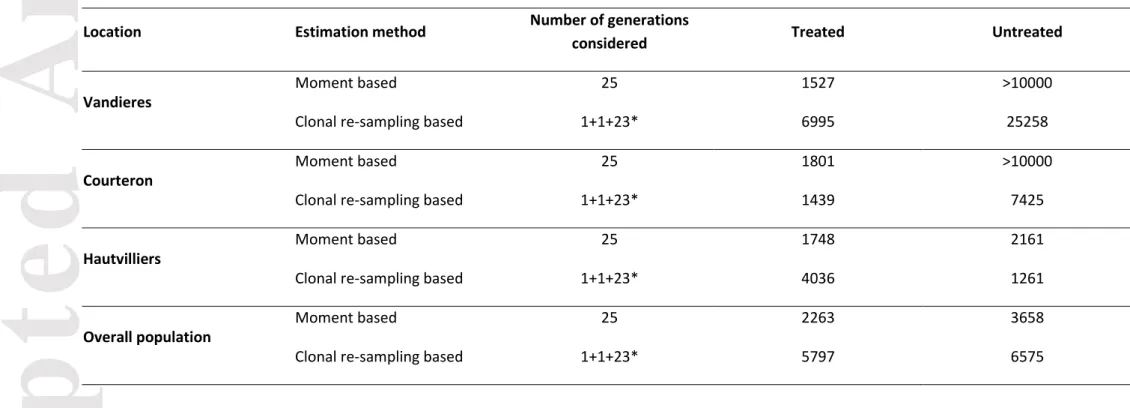
To test whether effective population size was reduced in treated plots as compared to untreated plots, we used two methods based on temporal samples to estimate contemporary effective population size. The first method calculates a moment-based point estimate of effective population size based on the variance in allelic frequencies among the temporally spaced populations (Waples, 1989). The second method estimates jointly the contemporary effective population size and the relative contribution of sexual vs. asexual reproduction (s) based on clone-mates re-sampling probability within temporally spaced samples (Ali et al., 2016). Effective population size was estimated for all the three locations across treated and untreated plots, considering samples at various time points using the number of generations based on information of the pathogen life cycle (Beever & Weeds 2004; Walker et al. 2015). Moment based estimation was run using NE-ESTIMATOR
software (Do et al., 2014), while clone-mate re-sampling based estimation was done using CLONCASE
package in R-statistical software (Ali et al., 2016). Multilocus genotypes (MLGs) were detected using the GENCLONE software (Arnaud-Haond & Belkhir, 2007), to identify clone-mates and prepare the
Accepted
Article
Estimation of resistance cost changes in allelic frequencies
With the available data, it was possible, in principle, to infer the evolutionary parameters determining the dynamics of resistance frequencies in treated and untreated areas (Lenormand & Raymond 2000), by modelling the change in allelic frequencies at resistance loci over time. We assumed that different processes governed allelic frequencies between September and June (hereafter referred to as ‘winter’) on one hand and between June and September (hereafter referred to as ‘summer’) (Fig. 1) on the other hand. This assumption arose naturally from the seasonality of temperate crops. In summer, reproduction is clonal. Any change in allele frequencies at resistance loci during this period therefore results from a combination of direct selection pressures (positive selection in treated areas and negative selection in untreated areas) and indirect selection pressures acting on other loci, such as those involved in host infection and exploitation, the aerodynamic characteristics of spores or their resistance to desiccation. It was, therefore, difficult to infer resistance parameters from summer data. In winter, sexual reproduction occurs (Beever & Weeds 2004; Walker et al. 2015), and erodes linkage disequilibria between resistance loci and other loci, allowing for proper estimates of resistance parameters. We therefore focused on winter data. Winter is characterised by specific climatic conditions, an abrupt decrease in host availability at the beginning of the period (vintage), and an absence of treatment, even in fields that are usually treated. Exchanges between plots are thought to be limited during most of the winter period, but some exchanges may have occurred just before the samplings in June. We expected the frequency of resistance to decrease between September and June under the influence of two main factors: the cost of resistance, resulting in higher mortality rates or lower multiplication rates for resistant strains than for susceptible strains, and migration from untreated areas in which resistance frequencies are low. For the sake of simplicity, we assumed that the observed pattern could be attributed entirely to the cost of resistance (but potential effects of drift and migration were examined in Supplementary Information 3). Migration from untreated areas was thus ignored. At each site, we considered the initial frequency of resistance to be psept. In the absence of fungicide application, susceptible strains
Accepted
Article
multiply at a rate w and resistant strains multiply at a rate w (1 – c), where cis the cost of resistance over the whole season. In June, the frequency of resistant strains was (Crow & Kimura 1970):
p
June
p
Septw(1
c)
p
Septw(1
c)
(1
p
Sept)w
, (1)which can also be written:
p
June
(1
c)p
Sept1
cp
Sept . (2)The above equation could be used to infercdirectly by non-linear regression. In addition, the likelihood of the 12 ‘winter’ transitions (three sites × two patches × two years) could then be calculated according to the model defined by equation (2). The observed frequencies were considered to result from a binomial sampling, such that the likelihood of a given transition was:
V p
Sept, N
June, R
June,c
C
NRJuneJune(1
c)p
Sept1
cp
Sept
RJune1
(1
c)p
Sept1
cp
Sept
NJuneRJune , (3)where NJune and RJune are the number of strains tested and the number of resistant strains found,
respectively. Assuming that the cost of a given fungicide was the same at different sites and on different dates (as suggested by the model selection procedure conducted in Supplementary Information 3), we calculated the likelihood of the whole dataset as the product of the 12 transition likelihoods. Likelihood was maximised with respect to c, with the Maximize function of Mathematica 10.3 (Wolfram Research, Inc.). Support limits were estimated within two units around the maximum likelihood value.
The fitness cost c accounts for the effect of resistance cost over the whole season. We also produced instantaneous cost estimates in days-1by the same non-linear regression and maximum
Accepted
Article
continuous-time model of resistance evolution in closed populations (Crow & Kimura 1970; Milgroom et al. 1989), the dynamics of the frequency of resistance alleles p can be modelled as:
dp
dt (rSrR)p(1p), (4)
where rS and rR are the fitness of susceptible and resistant strains, respectively. Let cinst denote the
fitness differential between susceptible and resistant strains:
r
S
r
R
c
inst. Solving equation (4) between September and June leads to:(5)
Finally, we assessed the sensitivity of the estimates obtained to the migration of susceptible strains from untreated patches to treated patches. Assuming a negligible frequency of resistant strains in untreated patches (this assumption does not hold for all sites, but is conservative), the model became:
p
June
(1
m)p
T ,Sept(1
c)
(1
m)(1
cp
T ,Sept)
mr
, (6)where m is the rate of migration between the treated patch and the untreated compartment and ris the ratio of the effective population sizes of the treated and untreated populations. New estimates of c and cinst were then obtained, by the non-linear regression approach, with a range of fixed values
for m and r.
These estimates were first generated from the results of sampling at three sites for the BenR1, ImiR1, MDR1 and MDR2 phenotypes. Second, using the historical database (Walker et al. 2013), we extracted resistance frequencies between 2002 and 2011 and between 1999 and 2011 for the BenR1 and ImiR1 phenotypes, respectively. These periods coincided with a significant decrease in resistance in the vineyard and very limited use of benzimidazoles and dicarboximides. Such calculations were not possible for MDR1 and MDR2, because the mean frequencies of these types of
Accepted
Article
resistance continued to increase under contemporary selective pressures. As resistance was measured only once per year, at vintage, the observed decrease in the frequency of resistance may have resulted from the overall combination of all the evolutionary forces acting over the entire year. The estimates of c may differ but they are comparable with previous estimates. As these data were based on resistance frequencies (rather than the number of resistant strains), we calculated only the linear regression of
Ln p (1
p)
against time to infer the instantaneous cost of resistance (here, the slope of the regression line).Results
Effects of fungicide application on frequencies of resistant mutations in populations
In this system, resistance phenotypes corresponded unambiguously to known mutations at resistance loci for the five studied fungicide modes of action (Supplementary Information 1). We therefore used resistance phenotypes of the 1016 strains collected at four sampling dates to score the frequencies of resistant mutations in B. cinerea populations, and named the phenotypes accordingly (Supplementary Information 1). For hydroxyanilides, carboxamides and anilinopyrimidines fungicides, molecules of contemporary use, the overall percentages of corresponding resistant mutations in the populations (scored by the HydR3, CarR and AniR1 phenotypes, respectively; Walker et al. 2013) were below 5%, making it impossible to detect selection acting on the corresponding loci. By contrast, the overall percentages of resistant mutations to some previously-used fungicides reached 61.2% for resistance to benzimidazoles (BenR1 phenotype) and 10.1% for dicarboximides (ImiR1 phenotype). The two mutations causing multidrug resistance, selected after the contemporary use of most anti-Botrytis fungicides, were present at 23.8% (MDR1 phenotype) and 11.7% (MDR2 phenotype). Therefore, further analyses will focus on these four phenotypes, described in Table 2.
Accepted
Article
For BenR1, ImiR1, MDR1 and MDR2 phenotypes, we tested whether the frequency of resistant mutations was significantly higher in treated than in untreated plots, using three-way ANOVAs (Fig. 2). For the BenR1 phenotype, the mean resistance frequency, over all locations and collection dates, was similar between untreated (55.9%) and treated (58.0%) plots, with no significant effect of the treatment. Similarly, no significant increase in ImiR1 resistance in treated vs untreated plots was detected, with mean frequency similar between populations in treated (10.9%) and untreated (7.5%) plots. By contrast, a significant effect (F= 17.52; df=1; P=0.001) of fungicide application was detected for MDR1, with a higher mean frequency or resistance in treated plots (29.9%) than in untreated ones (13.3%). The difference between adjusted means of MDR1 frequency in untreated vs treated plots was always negative and was significantly different from 0 in September 2005 (Δ= -20.44 ± 7.93; t=-2.58; df=14; P=0.022) and September 2006 (Δ= -34.74 ± 7.93; t=-4.38; df=14; P=0.001). Finally, the effect of fungicide treatment on MDR2 frequency was not significant but the P-value associated to this factor was low (P=0.118), with a mean MDR2 frequency of 9.2% in untreated plots compared to 15.1% in treated ones. In addition, the difference between adjusted means of MDR2 frequency in untreated vs treated was negative and close to be significantly different from 0 in September 2005 (Δ= -14.21 ± 7.14; t=-1.99; df=14; P=0.066) and significantly different from 0 in September 2009 (Δ= -15.36 ± 7.14; t=-2.15; df=14; P=0.049).
Moreover, resistance frequency varied over time in treated and untreated plots, with lower frequencies usually observed in spring, before the first fungicides treatments were applied (Fig. 2). The magnitude of these differences between treated and untreated plots differed according to phenotype (mean values of 5.9%, 10.5%, 10.8% and 19.9% for ImiR1, MDR2, BenR1 and MDR1, respectively). The effect of the collection date was significant for BenR1 (F= 8.00; df=3; P=0.002) and MDR1 (F=4.71; df=2; P=0.018). The effect of the collection site was significant only for BenR1 (F= 7.23; df=2; P=0.005) and ImiR1 (F= 5.21; df=2; P=0.023).
Accepted
Article
Effects of fungicide application on neutral diversity and effective population size
Multilocus linkage disequilibria were calculated for all plots an all sampling dates (except for Hautvilliers in June 2007 in treated plot due to too small sample size). Fifteen out of 23 rD values,
estimating multilocus linkage disequilibrium, were significantly different from 0, and ranged between 0 and 0.18 (mean = 0.064). This confirmed that the studied B. cinerea populations were recombining and that clonality could be neglected. The contribution of sexual reproduction was high, as evidenced from relatively small rD in all populations (see above), as well as from high relative
contribution of of sexual vs. asexual reproduction (0.468-0.849) in at least three situationsand high genotypic diversities (Supplementary Information 5).
We tested whether fungicide applications reduced population size in treated plots across locations and in the overall population (Table 3, Supplementary Information 5). The effective population size estimated over one complete life cycle (September 2005 to September 2006, i.e. three time points) was higher in untreated than in treated plots for all three sites and across all populations (except in Courteron with the clonal re-sampling based method; Table 3). The effective population size estimated with moment based method ranged from 1527 (Vandières in treated plots) to more than 10000 (for untreated plots in both Vandières and Courteron). The estimation based on clonal re-sampling ranged from 1261 (for untreated plots in Courteron) to 25258 (for untreated plots in Vandières). Higher effective population size in untreated compared to treated plots was also observed when it was estimated based on each interval i.e., September 2005-June 2006, June 2006-September 2006, September 2006-June 2007 (Supplementary Information 5). We tested whether genetic diversity decreased in treated plots as compared to untreated plots, at various collection dates (Fig. 3). The mean values of multilocus gene diversity HE were 0.478 in
treated plots and 0.530 in untreated plots. The effect of fungicide treatment on HE, tested using a
3-way ANOVA, was significant (F=6.008; df=1; P=0.029). The difference between adjusted means of HE
Accepted
Article
t=2.14; df=15; P=0.049). Similarly, the mean values of allelic richness AR were 4.60 alleles/locus in
untreated plots and 4.24 alleles/locus in treated plots. The effect of fungicide treatment on AR was
significant (F=11.482; df=1; P=0.011) and the difference between adjusted means of AR in untreated
vs treated plots was positive in Courteron and Hautvillers and significantly different from 0 only in
Hautvillers. Finally,the mean values of private allelic richness PAR were 1.39 alleles/locus in untreated
plots and 0.77 alleles/locus in treated ones, the effect of fungicide treatment being significant (F=16.830; df=1; P=0.001). The difference between adjusted means of PAR in untreated vs treated
plots was positive and significantly different from 0 in Courteron and Hautvillers. Overall, these results showed that population size tended to be reduced in treated plots following fungicide application, and that genetic diversity was reduced in treated plots at least in Courteron and Hautvillers.
The effect of the collection date was significant for HE (F=5.045; df=3; P=0.008), AR (F=37.575; df=3;
P=0.0001) and PAR (F=4.100; df=3; P=0.030). The effect of the sampling site was significant for HE
(F=3.843; df=2; P=0.045) and AR (F=6.569; df=2; P=0.025).
Estimation of resistance costs
All instantaneous fitness costs were very low (range 0.0022 - 0.0078 day-1). The total fitness cost
estimated for the BenR1 locus was of the same order of magnitude at all three sites when calculated by the nonlinear regression or maximum likelihood method (0.569 - 0.582). For the other loci, the maximum likelihood method generally gave a smaller estimate (ImiR1: 0.529 - 0.682; MDR1: 0.542 - 0.758; MDR2: 0.327 - 0.548), probably due to the greater variability of resistance frequency in these datasets, as confirmed by the large confidence intervals (Fig. 4). The sensitivity of these estimates to the emigration of susceptible genotypes from untreated areas to treated patches during winter was assessed (Fig. 5). Assuming equal population sizes in treated and untreated areas, estimates were unaffected by winter migration rates of up to 0.1 per generation. By contrast, assuming a 10-fold larger population size in untreated areas, estimates of resistance cost were unaffected for winter
Accepted
Article
migration rates of up to 0.01 per generation and fell to 0 for migration rates of 0.1 and above. Finally, under a 1000-fold larger population size in untreated areas, estimates of resistance cost were null even for very low migration rate (above 0.001).
The fitness costs calculated from all the vineyard data were smaller than those calculated from data for the three experimental plots, by a factor of 6 to 7 for BenR1 and 9 to 14 for ImiR1 (Fig. 4).
Discussion
We report the role of contemporary fungicide application on selection of resistance mutants of B.
cinerea in relation with the pathogen population structure in terms of population size, genetic
diversity and cost of resistance. Our conclusions are based on the populations from Champagne vineyards, which suffer from more severe grey mould epidemics than vineyards in other parts of France, and thus receive two to three fungicide treatments per season (Walker et al. 2013). Local adaptation, revealed as the spatio-temporal variation in resistant mutants’ frequency, is discussed to better understand how pathogens evolve in response to fungicide selective pressure and to identify further implications for sustainable fungicide application strategies.
The frequency of fungicide resistance varies over time, space and between selected loci
We observed two situations of response to selection, depending on the resistance locus considered. For MDR1 and MDR2, the frequencies of resistance were higher in the treated than untreated plots, at all three sites. This was even more accentuated in September collection dates, as the fungicide selection pressure acted during the summer. MDR phenotypes are selected by fungicides in contemporary use and display broad-spectrum cross-resistance to these fungicides still widely used
Accepted
Article
in French vineyards, particularly on the plots we studied (Leroux & Walker 2013; Walker et al. 2013). MDR phenotypes may be more easily selected than separate multiple resistances, because a single event leads to a similar broad-spectrum phenotype without the drawback of accumulating a number of possibly deleterious mutations. MDR1 and MDR2 resistance frequencies were low, but not zero, in untreated plots. If we assume that the unintentional spraying of untreated plots is negligible, which is a reasonable assumption in the high-value vineyards of Champagne in which most vine-growers are well equipped, then these low frequencies may be due to the migration of resistant strains from treated to untreated plots. In this respect, our results differ from those reported for M.
fijiensis, for which full susceptibility was observed close to the border between treated and
untreated populations (Rieux 2011). Migration between plots but also from and towards other reservoirs (e.g. other crops or wild plants) may also explain some significant decrease of resistance frequency during winter, when associated to resistance cost. Therefore, from these data, we cannot exclude that some migration occurs in winter and contributes to variation of resistance frequency over time and space, but it is difficult to quantify from our dataset. Host availability is limited until new grapevine leaves emerge in April; exchanges may occur between April and June but might be limited by unfavourable sporulation on leaves and flowers compared to the one on mature berries (end of summer).
Conversely, frequencies of resistance were similar at the BenR1 and ImiR1 loci, between treated and untreated plots, regardless of collection date. This result is consistent with little or no positive selection being exerted on these loci. Benzimidazoles and dicarboximides were widely deployed in the 1980s but are no more in use in the studied area due to the generalisation of resistance that largely decreased their efficiency, while alternative chemicals became available with new modes of action and greater intrinsic activity (Walker et al. 2013). Nevertheless, the frequencies of these resistances remain detectable despite the negligible levels of use of these fungicides. This might first be explained by null or very low costs of resistance at these loci. An alternative explanation is that between-plots migration would homogenise resistance in vineyards, as evidenced
Accepted
Article
by the similarity in the frequency of resistance between treated and untreated plots. Finally, the persistence of BenR1 strains could also be explained by the accumulation of compensatory mutation over time. Our results are thus the first case to highlight the contrast between the role of contemporary and past selective pressures on fungicide resistance in fungal pathogens.
Fungicides reduce population size in treated plot and consequently lead to reduced genetic diversity
due to genetic drift.
In this study, we hypothesised that fungicide treatments would affect population diversity for two main reasons. Fungicide treatments exert strong constraints on treated populations, leading to a decrease in their population size during the summer. This decrease in population size may also favour the fixation of rare alleles in treated areas, due to stronger genetic drift (Hoffmann & Willi 2008). Indeed, we observed an overall tendency of a reduction in effective population size in treated plots across all locations and in overall populations at all time points, except for the estimation made for the period September 2006-June 2007, when both the treated and untreated populations reached to infinity. The very low sample size in June 2007 from a population arising from the onset of sexual reproduction in winter would explain the infinite estimate where genetic drift has no role in changing population genetic structure, apart from random error (Do et al., 2014). Consequently, we demonstrated that fungicide applications had a significant effect on gene diversity, allelic richness and private allelic richness. These results are consistent with low survival rates in treated populations and/or with stronger genetic drift, as a consequence of reduced size of treated populations. This phenomenon may differ according to the collection date and the collection site, with, for example, genetic diversity mostly reduced at vintage, after the occurrence of fungicide selection, and significant decrease of private allelic richness observed only in Courteron and Hautvillers. Nevertheless, a clear impact of fungicides on populations at a small spatio-temporal scale suggests that this positive selection is rather strong.
Accepted
Article
Fungicide treatments also cause temporal and spatial heterogeneity in the environment of the pathogen, potentially limiting the production and dissemination of susceptible propagules, thereby reducing gene flow between treated and untreated plots. Analyses of population structure (Supplementary Information 4) showed that fungicide sprays had no impact on population subdivision suggesting gene flow between treated and untreated plots. This is consistent with findings for the fungal pathogen of banana Mycosphaerella fijiensis (Rieux et al. 2013). This lack of structure due to treatment was expected for B. cinerea, given the regular occurrence of sexual reproduction in this species, its great dispersion ability and the fact that fungicides have been used for decades: these factors allowed resistance loci to recombine into multiple genomics backgrounds.
Contrasting resistance costs in the vineyard
Measuring fitness is a key issue in evolutionary biology that may confirm hypotheses about the adaptive significance of phenotypes, such as resistance to drugs (Cowen et al. 2001). There are no standard measures of fungal fitness, because the measurement of survival and reproduction in filamentous fungi can be obscured by difficulties in defining what an individual is, and also because life cycle and genetics seem complicated in comparison to animals and plants (Pringle & Taylor 2002). In B. cinerea, fungicide resistance costs were often estimated after measuring the variation of some fitness components (e.g. mycelial growth, sporulation, sclerotia number and survival) of resistant field strains in comparison to those wild-type ones (Kim & Xiao 2011; Veloukas et al. 2013) or of isogenic strains (Lalève et al. 2014). But since this approach is dependent on the genetic background of the strains tested, and only gives a partial estimates of fitness, more comprehensive methods are required. In a heterogeneous environment consisting of treated and untreated areas, the various forces at work, namely migration and selection, can be estimated with the genetic cline theory (Endler 1977; Haldane 1948; Nagylaki 1975). Genetic clines are spatial gradients of resistance frequency between treated and untreated areas. Cline modelling can be used to estimate parameter
Accepted
Article
values from the theoretical model best fitting the observed allele frequencies, as for example the adaptation pattern of the mosquito Culex pipiens to organophosphate insecticides in Southern France (Lenormand et al. 1998). Here, cline patterns, consistent with selection detection, could be fitted to our dataset, but the poor fit obtained led to unreliable estimates of associated parameters (due to inappropriate sampling design; unpublished data).
Another approach to measure resistance costs involves modelling the temporal variation of allelic frequencies at a selected locus in a subdivided population with island migration (Crow & Kimura 1970; Dempster 1955; Levene 1953), as proposed by Milgroom et al. (1989) and Ennos & McConnell (1995) for Crumenulopsis sororia populations. We adapted this last approach to the case of B. cinerea, making the assumption that negative selection was the main force driving the evolution of resistance frequencies during the winter, in treated and untreated plots, and led to a reduction in the number of the progeny of resistant strains in populations. This assumption, based on the fungus life cycle, was validated by comparing the model with alternative models assuming that resistance costs could vary between sites, between dates and between treatments (Supplementary material 3). Model selection showed that in the contemporary dataset, none of the alternative models tested was better than the model assuming a single resistance cost for all sites, dates and treatments. This suggests a predominant effect of selection on other evolutionary forces (drift and migration) which were expected to translate in different dynamics of resistance (and thus different resistance costs) across sites, dates and treatments. In particular, although the neutral genetic structure of B. cinerea suggests migration between treated and untreated plots, no effect of migration (here modelled as site-specific or date-specific resistance costs) could be detected. One explanation is that migration mainly occurs during summer. During winter – the period over which decreases in resistance frequencies were monitored and used for estimation – migration is expected to be low. We showed that estimates of costs of resistance dramatically drop for increasing migration intensities, all the more so as effective population sizes are higher in untreated than in treated areas. Here, estimates of population sizes varied depending on the considered method.
Accepted
Article
CLONCASE suggests contrasted effective sizes between treated and untreated areas, fairly
incompatible with observed decreases in resistance frequencies. Moment based estimates of Ne suggested that the effective population sizes of untreated areas could be one order magnitude greater than those of treated areas at most. Under this assumption, the estimates of costs of resistance could stay unaffected for migration intensities up to 0.01 and drop to 0 for migration intensities of 0.1 and above. Further estimates of drift and migration would help to refine estimates of resistance costs. Such estimates could be obtained through the study of recombination in genome sequences from our populations or after a specific sampling.
The maximum likelihood method estimated similar costs for the BenR1, ImiR1 and MDR1 loci. By contrast, the non-linear regression method indicated an increase in resistance costs from BenR1 to ImiR1 and from ImiR1 to MDR1. This finding is consistent with the observations of a long-term survey carried out in Champagne (Walker et al. 2013). Indeed, cultivation of the BenR1 strains became generalised in the 1970s, and their frequency had only halved 20 years later, long after the withdrawal of fungicides with the mode of action targeted by this resistance. The cost of BenR1 resistance calculated for the banana pathogen M. fijiensis, bearing a homologous mutation of the β-tubulin gene responsible for a similar phenotype, was smaller, by a factor two to three (c=0.020 in total; Rieux 2011), using a cline modelling approach. This may be due to differences in the biology of these two fungi (e.g. number of sexual generations per year, continuous host availability), raising new questions about the effect of life history traits and biological features on resistance costs. The ImiR1 strains were also widely grown in the late 1970s, but their use rapidly declined when dicarboximides were no longer used. MDR1 strains were first detected in the late 1990s. Their frequency has now stabilised to 20 to 30% of the whole population, whereas the total MDR population is still increasing in size. The MDR2 locus was the least affected by negative selection, for both estimations. These estimations were also the most variable of the dataset. It was recently demonstrated that this phenotype colonised vineyards, initially in France and then in Germany, after one or a small number of mutation events in Champagne (Mernke et al. 2011). On the contrary, the
Accepted
Article
MDR1 phenotype is thought to have emerged several times in France, but also in distant countries, such as Chile. However, field surveys have shown that the observed frequency of MDR2 is greater than that of MDR1 (+10-15%; Walker et al. 2013). The maintenance of MDR2 at high frequencies in the field despite its unique origin may be explained by a lower resistance cost associated with MDR2. It may also be explained by the mechanism underlying resistance: the MDR2 phenotype is caused by overexpression of the MFS transporter mfsM2, whereas MDR1 depends on the ABC transporter atrB, which uses ATP to drive efflux, a potentially more costly mechanism (Kretschmer et al. 2009; Mernke
et al. 2011).
To conclude, the approach used here to estimate resistance costs at loci conferring resistance to fungicides in B. cinerea gathered information in agreement with field observations of resistance evolution and with established knowledge of the mechanisms associated to the resistance phenotype we studied. This approach, based on field data rather than on the variation of fitness components in vitro or in planta, is still rare in the literature and may give rise to more sophisticated developments in other fungal models with simpler life cycle or using dedicated samplings or for estimating resistance costs to some other local adaptations of pathogens (e.g. virulence genes). Compared to other approaches aimed at measuring independent fitness components, this method is independent from the genetic background in which resistance mutations are selected. It also directly combines competitive effects occurring between distinct fitness components and integrates the effect of compensatory mutations selected in the genome of resistant strains. Such approaches aiming to estimate the magnitude of selection due to fungicides are clearly essential since they help predicting the rate of resistance decay in populations, and, from a practical point of view, choosing the appropriate anti-resistance strategy (REX Consortium 2013) and adjusting the interval between consecutive treatments with fungicides with the same mode of action (alternation). More generally, the estimation of selection parameters for various fungicides will help improving the management of fungicide programmes, to increase the durability of the molecules used and provide crop protection strategies that are more environmental-friendly. Similarly, the estimation of the intensity and timing
Accepted
Article
of gene flow between treated plots, untreated plots and other demes may be a promising approach to improve the timing of fungicide applications and implement efficient prophylactic measures. To conclude, we studied how local adaptation of B. cinerea populations in response to the strong selective pressure exerted by fungicide application influence pathogen population structure in terms of population size, genetic diversity and cost of resistance. In our understanding, disentangling the various forces underlying local adaptation of pathogens to fungicides should consequently lead to improve disease control strategies while increasing their substainability.
Acknowledgements
We would like to thank Johann Confais, Angélique Gautier and Laurence Bill from INRA BIOGER, for technical assistance with the collection, isolation, phenotyping and genotyping of the B. cinerea strains. We also thank Marie-Laure Panon and her colleagues from the Comité Interprofessionnel du
Vin de Champagne (CIVC) for their precious help in the identification and characterisation of suitable
sites for these experiments. We are grateful to Laurent Thibault from the French Agency for Food, Environmental and Occupational Health and Safety (Anses), for providing information about registration dates of fungicides. Finally, we wish to thank Pr Ralph Dean and Dr Richard O’Connell for correcting earlier versions of the manuscript, and to Dr Tatiana Giraud, editor of this paper, and to three anonymous reviewers, whose comments greatly contributed to improve this work.
This work was funded by the Plant Health and Environment Department of the French National Research Institute for Agronomy (INRA). AR and VR acknowledge financial support from the European Union Regional Development Fund (ERDF), the Conseil Départemental de la Réunion,
Région Réunion, and the French Agropolis Fondation (Labex Agro–Montpellier, E-SPACE project
Accepted
Article
Data accessibility
The whole dataset (SSR and phenotype data) are available via Dryad: doi:10.5061/dryad.g1hm0.
References
Ali S, Soubeyrand S, Gladieux P, Giraud T, Leconte M, Gautier A, Mboup M, de Vallavieille-Pope C, Enjalbert J (2016) CloNcaSe: Estimation of sex frequency and effective population size by clonemate re-sampling in partially clonal organisms. Molecular Ecology Resources 16, 845-861.
Arnaud-Haond S & Belkhir K (2007) GenClone 1.0: A new program to analyse genetics data on clonal organisms. Molecular Ecology Notes 7:15-17.
Barton NH, Briggs DEG, Eisen JA, Goldstein DB, Patel NH (2007) Evolution. Cold Spring Harbor Laboratory Press, New York, USA.
Beever R, Weeds P (2004) Taxonomic and genetic variation of Botrytis and Botryotinia. In: Botrytis: Biology, pathology and control (eds. Elad Y, Williamson B, Tudzynski P, Delen N), pp. 29-52. Kluwer Academic Publisher, Dordrecht, The Netherlands.
Belkhir K, Borsa P, Chikhi L, Raufaste N, Bonhomme F (1996-2004) GENETIX 4.05, logiciel sous Windows TM pour la génétique des populations (ed. Laboratoire Génome P, Interactions, CNRS UMR 5171, Université de Montpellier II, Montpellier (France). ).
Cowen LE, Kohn LM, Anderson JB (2001) Divergence in Fitness and Evolution of Drug Resistance in Experimental Populations of Candida albicans. Journal of Bacteriology 183, 2971-2978. Crow J, Kimura M (1970) An introduction to population genetics theory.
Dempster E (1955) Maintenance of genetic heterogeneity. In: Symposium on quantitative biology sciences pp. 25-32, Cold Spring Harbor.
Do C, Waples RS, Peel D, Macbeth GM, Tillett BJ, Ovenden JR (2014) NeEstimator V2: re-implementation of software for the estimation of contemporary effective population size (Ne) from genetic data. Molecular Ecology Resources 14:209-214
Elad Y, Pertot I, Prado AMC, Stewart A (2016) Plant hosts of Botrytis spp. In: Botrytis - the fungus, the pathogen and its management in agricultural systems (eds. Fillinger S, Elad Y), pp. 415-458. Springer.
Endler J (1977) Geographic variation, speciation and clines. Monographs in population biology 10, 1-246. Ennos RA, McConnell KC (1995) Using genetic markers to investigate natural selection in fungal populations.
Canadian Journal of Botany-Revue Canadienne De Botanique 73, S302-S310.
Fillinger S, Amselem J, Artiguenave F, et al. (2007) The genome projects of the plant pathogenic fungi Botrytis cinerea and Sclerotinia sclerotiorium. In: Macromolecules of grapes and wines (ed. P. Jeandet CCaAC), pp. 125-133. Lavoisier, London, Paris, New York.
Fisher R (1930) The genetical theory of natural selection Clarendon Press, Oxford.
Fournier E, Giraud T (2008) Sympatric genetic differentiation of a generalist pathogenic fungus, Botrytis cinerea, on two different host plants, grapevine and bramble. Journal of Evolutionary Biology 21, 122-132.
Fournier E, Giraud T, Loiseau A, et al. (2002) Characterization of nine polymorphic microsatellite loci in the fungus Botrytis cinerea (Ascomycota). Molecular Ecology Notes2, 253-255.
Giraud T, Fortini D, Levis C, Leroux P, Brygoo Y (1997) RFLP markers show genetic recombination in Botryotinia fuckeliana (Botrytis cinerea) and transposable elements reveal two sympatric species. Molecular Biology and Evolution 14, 1177-1185.
Haldane JBS (1948) The theory of a cline. J. Genet 48, 277-284.
Hoffmann AA, Willi Y (2008) Detecting genetic responses to environmental change. Nature Reviews Genetics 9, 421-432.
Isenegger DA, Ades PK, Ford R, Taylor PWJ (2008) Status of the Botrytis cinerea species complex and microsatellite analysis of transposon types in South Asia and Australia. Fungal Diversity 29, 17-26. Ishii H, Hollomon DW (2015) Fungicide resistance in plant pathogens: principles and a guide to practical
Accepted
Article
Karchani-Balma S, Gautier A, Raies A, Fournier E (2008) Geography, plants and growing systems shape the genetic structure of Tunisian Botrytis cinerea populations. Phytopathology 98, 1271-1279. Kim YK, Xiao CL (2011) Stability and fitness of pyraclostrobin- and boscalid-resistant phenotypes in field
isolates of Botrytis cinerea from apple. Phytopathology 101, 1385-1391.
Kretschmer M, Leroch M, Mosbach A, et al. (2009) Fungicide-driven evolution and molecular basis of multidrug resistance in field populations of the grey mould fungus Botrytis cinerea. Plos Pathogens 5, e1000696. Lalève A, Fillinger S, Walker AS (2014) Fitness measurement reveals contrasting costs in homologous
recombinant mutants of Botrytis cinerea resistant to succinate dehydrogenase inhibitors. Fungal Genetics and Biology 67, 24-36.
Lenormand T, Bourguet D, Guillemaud T, Raymond M (1999) Tracking the evolution of insecticide resistance in the mosquito Culex pipiens. Nature 400, 861-864.
Lenormand T, Guillemaud T, Bourguet D, Raymond M (1998) Evaluating gene flow using selected markers: A case study. Genetics 149, 1383-1392.
Lenormand T, Raymond M (1998) Resistance management: the stable zone strategy. Proceedings of the Royal Society B-Biological Sciences 265, 1985-1990.
Lenormand T, Raymond M (2000) Analysis of clines with variable selection and variable migration. American Naturalist 155, 70-82.
Leroux P, Chapeland F, Desbrosses D, Gredt M (1999) Patterns of cross-resistance to fungicides in Botryotinia fuckeliana (Botrytis cinerea) isolates from French vineyards. Crop Protection 18, 687-697.
Leroux P, Fritz R, Debieu D, et al.(2002) Mechanisms of resistance to fungicides in field strains of Botrytis cinerea. Pest Management Science 58, 876-888.
Leroux P, Gredt M, Leroch M, Walker A-S (2010) Exploring mechanisms of resistance to respiratory inhibitors in field strains of Botrytis cinerea, the causal agent of gray mold. Applied and Environmental
Microbiology 76, 6615-6630.
Leroux P, Walker A (2013) Activity of fungicides and modulators of membrane drug transporters in field strains of Botrytis cinerea displaying multidrug resistance. European Journal of Plant Pathology 135, 683-693. Levene H (1953) Genetic equilibrium when more than one niche is available. The American naturalist, 331-333.
McDonald BA, Linde C (2002). The population genetics of plant pathogens and breeding strategies for durable resistance. Euphytica 124(2), 163-180.
Martinez F, Blancard D, Lecomte P, et al. (2003) Phenotypic differences between vacuma and transposa subpopulations of Botrytis cinerea. European Journal of Plant Pathology 109, 479-488.
Mernke D, Dahm S, Walker AS, et al. (2011) Two promotor rearrangements in a drug efflux transporter gene are responsible for the appearance and spread ot multidrug resistance phenotype MDR2 in Botrytis cinerea isolates in French and German vineyards. Phytopathology 101, 1176-1183.
Milgroom M, Levin S, Fry W (1989) Population genetics theory and fungicide resistance. In: Plant disease epidemiology (eds. KJ L, WE F). McGraw-Hill, New York.
Mundt, CC (2014). Durable resistance: A key to sustainable management of pathogens and pests. Infection, Genetics and Evolution 27: 446-455.
Nagylaki T (1975) Conditions for the existence of clines. Genetics 80, 595-615.
Nei M (1978) Estimation of average heterozygosity and genetic distance from a small number of individuals. Nature 89, 583-590.
Pringle A, Taylor JW (2002) The fitness of filamentous fungi. Trends in Microbiology 10, 474-481.
R Core Team (2016) R: A language and environment for statistical computing. R Foundation for statistical computing, Vienna, Austria. Vienna, Austria. https://www.R-project.org/
REX Consortium (2013) Heterogeneity of selection and the evolution of resistance. Trends in Ecology & Evolution 28, 110-118.
REX Consortium (2016). Combining selective pressures to enhance the durability of disease resistance genes. Frontiers in Plant Science 7(1916).
Rieux A (2011) Etude des processus de dispersion et des flux géniques chez un champignon phytopathogène: le cas de Mycosphaerella fijiensis à l'échelle d'un bassin de production Camerounais, Supagro –Thèse de doctorat.
Rieux A, De Bellaire LD, Zapater MF, Ravigne V, Carlier J (2013) Recent range expansion and agricultural landscape heterogeneity have only minimal effect on the spatial genetic structure of the plant pathogenic fungus Mycosphaerella fijiensis. Heredity 110, 29-38.
Stukenbrock EH, McDonald BA (2008) The origins of plant pathogens in agro-ecosystems. Annual Review of Phytopathology 46, 75-100.