HAL Id: hal-01790932
https://hal-univ-avignon.archives-ouvertes.fr/hal-01790932
Submitted on 14 May 2018
HAL is a multi-disciplinary open access
archive for the deposit and dissemination of
sci-entific research documents, whether they are
pub-lished or not. The documents may come from
teaching and research institutions in France or
abroad, or from public or private research centers.
L’archive ouverte pluridisciplinaire HAL, est
destinée au dépôt et à la diffusion de documents
scientifiques de niveau recherche, publiés ou non,
émanant des établissements d’enseignement et de
recherche français ou étrangers, des laboratoires
publics ou privés.
on the distribution and prevalence of plant viruses at
the ecosystem scale
Pauline Bernardo, Tristan Charles-Dominique, Mohamed Barakat, Philippe
Ortet, Emmanuel Fernandez, Denis Filloux, Penelope Hartnady, Tony Rebelo,
Stephen Cousins, François Mesléard, et al.
To cite this version:
Pauline Bernardo, Tristan Charles-Dominique, Mohamed Barakat, Philippe Ortet, Emmanuel
Fernan-dez, et al.. Geometagenomics illuminates the impact of agriculture on the distribution and prevalence
of plant viruses at the ecosystem scale. ISME Journal, Nature Publishing Group, 2018, 12 (1), pp.173
- 184. �10.1038/ismej.2017.155�. �hal-01790932�
ORIGINAL ARTICLE
Geometagenomics illuminates the impact of
agriculture on the distribution and prevalence of
plant viruses at the ecosystem scale
Pauline Bernardo
1,2,3,4, Tristan Charles-Dominique
5,6, Mohamed Barakat
7, Philippe Ortet
7,
Emmanuel Fernandez
1,2, Denis Filloux
1,2, Penelope Hartnady
8, Tony A Rebelo
6,
Stephen R Cousins
6, François Mesleard
9,10, Damien Cohez
9, Nicole Yavercovski
9,
Arvind Varsani
11,12,13, Gordon W Harkins
14, Michel Peterschmitt
1,2,
Carolyn M Malmstrom
3,15, Darren P Martin
8and Philippe Roumagnac
1,21CIRAD, UMR BGPI, Montpellier, France;2BGPI, CIRAD, INRA, Montpellier SupAgro, Univ Montpellier,
Montpellier, France;3Department of Plant Biology, Michigan State University, East Lansing, Michigan, USA; 4Department of Plant Pathology, Ohio State University, OARDC, Wooster, OH, USA;5Xishuangbanna Tropical
Botanical Garden, Chinese Academy of Sciences, Center for Integrative Conservation, Community Ecology and Conservation, Menglun, Yunnan, China;6South African National Biodiversity Institute, Kirstenbosch
Research Centre, Cape Town, South Africa;7CEA, CNRS, Aix-Marseille Université, UMR 7265, LEMIRE,
Saint-Paul-lez-Durance, France;8Computational Biology Division, Department of Integrative Biomedical Sciences,
Institute of Infectious Diseases and Molecular Medicine. University of Cape Town, Observatory, South Africa;
9Tour du Valat, Institut de recherche pour la conservation des zones humides méditerranéennes, Le
Sambuc-Arles, France;10Institut Méditerranéen de Biodiversité et Ecologie (IMBE), UMR CNRS 7263-IRD 237,
Université d'Avignon et des pays du Vaucluse, Aix-Marseille Université, IUT d’Avignon, Avignon, France;
11The Biodesign Center for Fundamental and Applied Microbiomics, Center for Evolution and Medicine,
School of Life Sciences, Arizona State University, Tempe, AZ 85287-5001, USA;12School of Biological
Sciences and Biomolecular Interaction Centre, University of Canterbury, Christchurch, New Zealand;
13Structural Biology Research Unit, University of Cape Town, Observatory, South Africa;14South African
Medical Research Council Bioinformatics Unit, South African National Bioinformatics Institute, University of the Western Cape, South Africa and15Graduate Program in Ecology, Evolutionary Biology and Behavior,
Michigan State University, East Lansing, Michigan, USA
Disease emergence events regularly result from human activities such as agriculture, which frequently brings large populations of genetically uniform hosts into contact with potential pathogens. Although viruses cause nearly 50% of emerging plant diseases, there is little systematic information about virus distribution across agro-ecological interfaces and large gaps in under-standing of virus diversity in nature. Here we applied a novel landscape-scale geometagenomics approach to examine relationships between agricultural land use and distributions of plant-associated viruses in two Mediterranean-climate biodiversity hotspots (Western Cape region of South Africa and Rhône river delta region of France). In total, we analysed 1725 geo-referenced plant samples collected over two years from 4.5 × 4.5 km2 grids spanning farmlands and adjacent
uncultivated vegetation. We found substantial virus prevalence (25.8–35.7%) in all ecosystems, but prevalence and identified family-level virus diversity were greatest in cultivated areas, with some virus families displaying strong agricultural associations. Our survey revealed 94 previously unknown virus species, primarily from uncultivated plants. This is the first effort to systematically evaluate plant-associated viromes across broad agro-ecological interfaces. Our findings indicate that agriculture substantially influences plant virus distributions and highlight the extent of current ignorance about the diversity and roles of viruses in nature.
The ISME Journal advance online publication, 20 October 2017; doi:10.1038/ismej.2017.155
Introduction
Over the next 30 years the world’s human popula-tion is expected to increase by 33%, reaching 9.7 billion by 2050 (Department of Economic and Social
Correspondence: P Roumagnac, BIOS, UMR BGPI CIRAD Campus International de Baillarguet, TA A-54/K, Montpellier Cedex 5 F-34398, France.
E-mail philippe.roumagnac@cirad.fr
Received 23 December 2016; revised 21 July 2017; accepted 22 August 2017
Affairs, 2015). Increasing food demands that accom-pany this population growth will continue to drive the conversion of natural areas into intensively managed farmlands (Scherr and Mcneely, 2008). Such land cover change will create numerous opportunities for novel interactions between exotic crop species and resident microbial communities (Burdon et al., 2006; Jones, 2009; Alexander et al., 2014), occasionally leading to outbreaks of pre-viously unknown microbial pathogens (Thresh, 1981; Varsani et al., 2008; Jones, 2009).
Although almost 50% of the microbes responsible for emerging plant diseases are viruses (Anderson et al., 2004), there are major gaps to understand plant virus pathogenesis. One crucial missing component is comprehensive information about the spatial and temporal distributions of plant virus populations existing within different vegetation compartments of agro-ecological landscapes. While crops are occa-sionally surveyed for suites of specific viruses, little is known about the identities of viruses that inhabit interfaces between managed and natural areas (Roossinck and Garcia-Arenal, 2015). For example, ~ 1200 plant virus species are currently recognised by the International Committee on Taxonomy of Viruses (King et al., 2012), fewer than 10% have been isolated from uncultivated plant species (Wren et al., 2006; Roossinck et al., 2015).
To develop mechanistic understanding of how viral pathogens might emerge in crops, it is essential to identify the parameters that determine viral diversity and prevalence across agro-ecological interfaces. Initial work in other situations indicates, for example, that reductions in plant diversity can increase prevalence of plant pathogens, including some viruses (Mitchell et al., 2002; Allan et al., 2003; Pagan et al., 2012; Lacroix et al., 2014). A central issue is thus the degree to which anthropogenic perturbations of natural ecosystems—such as the ecological simplification and changes in host species resulting from agricultural conversion—favor the appearance of new or specific viruses (Pagan et al., 2012). We therefore ask: (1) Are plant-associated virus communities more prevalent, but less diverse in cultivated areas? (2) Are particular families of viruses significantly associated with cultivated areas? (3) Are novel viruses more likely to be discovered in native uncultivated vegetation? A comprehensive assessment of such relationships across agro-ecological landscapes has never pre-viously been made, but recent methodological developments in spatial plant virus metagenomics provide new means of investigation (Muthukumar et al., 2007; Roossinck et al., 2010). While such approaches have discovered novel viruses within uncultivated plants in several unmanaged ecosys-tems (Muthukumar et al., 2009; Bernardo et al., 2013), they have yet to be applied across agro-ecological gradients.
Here we use a new geometagenomics approach to assess the spatial and temporal distributions of plant
viruses at the landscape scale within two Mediterranean-climate ecosystems: the Western Cape region of South Africa and the Rhône delta river region of France. We examine relationships between land use history at both locations and the distributions of 511 plant samples containing single reads and contigs with detectable similarity to plant-associated viruses identified within 1725 location-tagged plant samples. We find that (1) virus prevalence is greater in cultivated areas in both locations, but that plant diversity is negatively associated with family-level diversity of plant-associated viruses, contrary to expectations; (2) some virus families show strong associations with agriculture; and (3) the novel viruses identified (94 putative species) are primarily from uncultivated plants.
Materials and methods
Study sites and geometagenomics sampling grid To quantify landscape-scale patterns of virus dis-tribution, we established permanent 4.5 × 4.5 km2
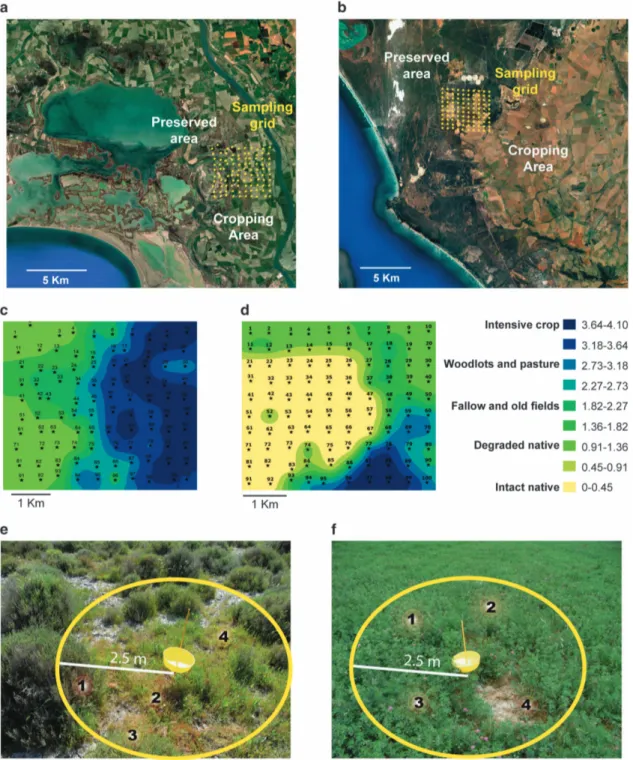
sampling grids across agro-ecological interfaces in two different Mediterranean-climate areas: the Rhône river delta in Southern France and the Cape Floristic Region in South Africa. Both regions represent unique vegetation and have been desig-nated as UNESCO World Heritage Sites (Supplemen-tary Information, Expanded Site Descriptions and Supplementary Table S1). Each grid contained 100 geo-nodes at 500-m spacing (10 nodes × 10 nodes, Figure 1), which were pre-determined using GIS (ArcGIS 10.1, ESRI, Redlands, CA, USA).
In France, the sampling grid spanned an interface between winter wheat, rice and alfalfa fields and the Tour du Valat reserve, which includes a 2600-ha patchwork of seasonal marshes, saline steppes and xero-halophitic meadows. In South Africa, the sampling grid spanned an interface between barley and winter wheat fields to the east and the privately-owned Buffelsfontein Game and Nature Reserve to the west, adjoining the West Coast National Park. This private reserve contains 1600 ha of native strandveld and renosterveld shrublands that are part of the fire-adapted fynbos flora of the Cape Floristic Region—a global biodiversity hotspot (Myers et al., 2000).
Sampling and measurements at each geo-node
Geo-nodes were sampled in the spring (May–June in France; September–October in South Africa) of 2010 and 2012. We navigated to each geo-node with a Trimble Geo XT V6 (50 cm precision). At each visit, we photographed the geo-node area, rated land use conditions, and collected 5 g of leaf and stem tissue from each dominant plant species for virus analysis. Land use types were rated on a five-point scale: (0) intact native communities; (1) native
communities degraded by disturbance or invasion; (2) fallow and old fields; (3) low-intensity polycul-ture (woodlots and paspolycul-ture); and (4) intensive crop monoculture. Types 0–1 were considered to be
uncultivated (non-agricultural), and types 2–4, culti-vated (agricultural).
For virus sampling, we assessed all vegetation within 2.5 m of the geo-node (Figure 1). In
multi-Figure 1 French and South African sampling designs. (a) French and (b) South African sampling sites. Both 4.5 × 4.5 km2sampling grids
contained 100 GPS-nodes with 500 m spacing and were located across agro-ecological interfaces between cultivated and uncultivated areas. Spatial interpolation of degrees of human-mediated disturbance at the (c) French and (d) South African sampling sites. Empirical Bayesian Kriging was performed based on scores depicting the level of intensity of agriculture using ArcGIS to visualise interfaces between uncultivated and cultivated areas. Every sampling point was ranked as follows: (0) intact native communities; (1) native communities degraded by disturbance or invasion; (2) fallow and old fields; (3) low-intensity polyculture (woodlots and pasture); and (4) intensive crop monoculture. (e, f) Examples of two geo-nodes at the French sampling site. (e) exemplifies an uncultivated sampling point at which four plants (numbers 1–4), each within 2.5 m of the geo-node and with a biomass 410 g, were considered ‘dominant’ and sampled. (f) exemplifies a cultivated sampling point, in this case where the vegetation is dominated by alfalfa, at which we collected three separate 5- g alfalfa samples (numbers 1–3) and one (number 4) from a dominant (that is, 410 g biomass) weed.
strata vegetation, we surveyed all canopy layers. Species for which there was at least 10 g of biomass present were considered ‘dominant’; we generally identified 1–13 dominant species at each geo-node (Figure 1). For each species, we collected a separate sample from a single individual, selected hapha-zardly without regard to symptoms. To most fully capture virus dynamics, we also sampled small-statured plant species (almost exclusively Poaceae); for these, it was necessary to sample from multiple (2–10) individuals to reach the required tissue quantity. In crop monocultures, in which there was little other vegetation, we collected three separate 5-g samples of the crop species (Figure 1). All samples were immediately refrigerated at 4 °C in the field and transported with 4 °C refrigeration to Montpellier, France, where they were kept at − 80 °C until processed. Local botanical experts (Yavercovski and Rebelo) confirmed the identities of samples, and categorized them as either crop or non-crop (wild or weedy) species. In 2012, the second set of samples from South Africa was unexpectedly delayed in the middle of air transit and warmed. Thus, these samples are omitted in further analysis.
Virus extraction, library preparation, and 454 pyrosequencing
To identify known and novel viruses in all 1725 plant samples, we used 454 pyrosequencing of both DNA and RNA extracted from semi-purifications of virion-associated nucleic acids (VANA; Palanga et al., 2016). In this process, each plant species sample from each geo-node was individually bar-coded to allow analysis of relationships between plant and virus species in geographic context. For the VANA semi-purification, 1 g of leaf and stem material from each plant sample was ground and centrifuged twice at low speed (3200g for 5 min and 8228g for 3 min), filtered through a 0.45μm sterile syringe filter and centrifuged at 148000g for 2.5 h at 4 °C to concentrate viral particles. Unencapsidated nucleic acids were then eliminated by DNase I and RNase A (Euromedex, France). Total nucleic acids were extracted as a mixed RNA/DNA solution from resuspended virus-particles using a NucleoSpin 96 Virus Core Kit (Macherey-Nagel, Germany). In total 23 samples were extracted in each VANA batch along with a dual extraction control: sugarcane tissue infected with a unique, known sugarcane bacilliform badnavirus (from the CIRAD sugarcane quarantine station in Montpellier, France). This dual control served both as a positive with known sequence (the badnavirus) and a negative for the detection of potential contamination (any virus other than the known badnavirus). Before field samples were extracted, sensitivity tests were conducted with 62 different viruses from eleven viral families with a range of genomic nucleic acid types (RNA and DNA), in both single and co-infections; this unique collec-tion of test viruses was available in vivo from the
CIRAD quarantine station collection (Supplementary Table S2).
For library preparation, complementary DNA (cDNA) synthesis was performed on extracted RNA/DNA solutions using the primer, DoDec (5′-CCT TCG GAT (5′-CCT CCN NNN NNN NNN NN-3′). Additional controls of nucleic acid-free water (blanks) were added to each sample group at the reverse transcription step and carried through to sequencing. Priming and extension were then per-formed with Large (Klenow) Fragment DNA poly-merase (Promega, Charbonnières, France) on all cDNA and genomic DNA in each tube. Next, PCR amplification was carried out using one of the 96 multiplex identifier (MID) tagged primers listed in Palanga et al. (2016). Finally, libraries were run on a GS FLX Titanium (454 Life Sciences, Branford, CT, USA) by the Beckman Coulter Genomics company (Danvers, MA, USA).
Processing of 454 reads
MID-tags and primers were identified in each raw read using agrep (Wu and Manber, 1992) and assigned to the particular samples from which they originated. Separated raw reads were processed to eliminate MID-tags, primers and low quality regions (Phred quality score threshold of 25) using cutadapt (Martin, 2011). Cleaned reads have been deposited in the sequence read archive of GenBank (accession numbers: SAMN05933069–SAMN05933092). We used BlastN and BlastX to compare contigs assembled with CAP3 (Huang and Madan, 1999) and non-assembled reads (minimum length 45 bp) to GenBank sequences (Altschul et al., 1990). When-ever query sequences matched a plant-associated virus with an e-value o0.001, we used the open reading frames Finder NCBI analysis tool (http:// www.ncbi.nlm.nih.gov/gorf/gorf.html) to identify open reading frames that were 420 codons long. For each potential open reading frames, a protein sequence translation was aligned using MUSCLE 3.7 (default settings; Edgar, 2004) to homologous viral protein sequences identified using Blast searches. On the basis of the hosts of their nearest known relatives identified by BlastN or BlastX, reads and contigs were categorized as likely to represent either plant-infecting viruses (henceforth, plant viruses) or viruses infecting plant-associated fungi (henceforth, mycoviruses). We refer to these plant viruses and mycoviruses collectively as plant-associated viruses (PLAV). Initial classifications may be revised in the future based on further characterization and mycov-iruses that are here classified as vmycov-iruses that probably infect fungi may in fact infect plant hosts and be re-classified as plant viruses. About half of known partitiviruses infect plants, while others infect fungi (Nibert et al., 2014); we classified the partitivirus sequences we found as mycoviruses because pair-wise sequence similarity (BlastN or BlastX) and phylogenetic analyses did not indicate that these
reads could be confidently assigned to either one of the two main plant-infecting partitivirus clades (Nibert et al., 2014).
Estimates of virus prevalence and diversity
To render the most informative ecological snapshot of virus dynamics, we collected tissue from both large- and small-statured plant species; the latter are often overlooked but warrant attention. To reach tissue quantity requirements, several individuals of each small-statured plant species were collected together and combined into a single bulked sample. We therefore define individual prevalence as the number of samples that contained at least one PLAV out of the total number of samples collected from single individuals. We define bulked prevalence as the proportion of PLAV-containing samples among the collection of bulked samples. We define sample prevalence as the prevalence of PLAV in individual and bulked samples considered together. The major-ity of samples (65.2%) were individual samples. Bulked samples of smaller-statured species were 94% Poaceae, 5% Trifolium spp. and 1% Schizaea-ceae. Sample prevalence, bulked prevalence and individual prevalence of cultivated and uncultivated plants were compared using two-tailed Z tests.
To evaluate virus diversity, we first enumerated virus family richness per plant sample. In each sample, we counted only the number of virus families represented (if any), as determined by Blast matches, and did not attempt to enumerate genera or species. We adopted this conservative approach because we wanted to avoid‘over-counting’ different reads or contigs from recombinant viruses as if these were an indication of two separate viruses (a co-infection). To estimate virus diversity at each geo-node, we next calculated the Shannon–Wiener index (H), where species richness (s) was conservatively estimated by virus family richness and the propor-tion of individuals belonging to each virus family i (pi) was estimated as the number of samples at that
geo-node in which the family was represented.
Mann–Whitney U-tests were used to evaluate differ-ences between cultivated areas and uncultivated areas with respect to viral prevalence and diversity.
Associations between land use and virus communities To evaluate potential associations between land use and the identity of virus families at geo-nodes, we used RLQ analysis with the fourth corner method (Dray and Legendre, 2008). With this method, we linked three matrices describing land use variables (R), per-site plant family abundances (L), and virus families detected in each plant family (Q). We used the Hill and Smith approach (Hill and Smith, 1976) to ordinate sites in the R matrix by land-use (Legendre and Legendre, 2012), and principal com-ponent analysis (PCA) to analyse the plant family (L) and virus (Q) matrices. Each table was analyzed separately and then compared with results of the three-table RLQ ordination. Statistical significance of the co-structure between land use (R) and virus families (Q) was assessed by comparing total inertia in the RLQ analysis to total inertia after 9999 Monte-Carlo permutations of the rows of the R and Q tables (Doledec et al., 1996). Significance of the association between virus families and land use in the fourth corner analysis (habitat filtering) was evaluated with a two-step testing procedure (Dray and Legendre, 2008). We used 9999 permutations in all randomiza-tion procedures and the false discovery rate method (Benjamini and Hochberg, 1995) to adjust p-values for multiple testing. All analyses were processed using the VEGAN (Dixon, 2003) and ade4 packages within the R statistical computing environment (version 3.0.2).
Identifying potentially novel viruses
It can be challenging to determine which viral reads and contigs represent novel viruses because of the uneven and crop-biased distribution of GenBank accessions available for comparison, and family-specific differences in how plant virus species are
Table 1 Characteristics of geo-metagenomics samples from grids of 100 geo-nodes and subsequent VANA-based 454 pyrosequencing of extracted and tagged nucleic acids
Parameter South Africa 2010 France 2010 France 2012 Percentage of geo-nodes in cultivated areas 34 72 74 No. of plant samples (from 100 geo-nodes) 706 484 535 No. of plant samples containing multiple individuals of same species 112 242 247 Total no. of VANA-based 454 pyrosequencing reads 1332624 1092351 1282799 No. of reads removed during quality control (%) 208675 (15.7) 160118 (14.7) 135390 (10.6)
No. of good reads 1123949 932233 1147409
Mean no. of good reads per plant sample 1592 1926 2145
Mean length of good reads (bp) 246 301 260
No. of plant-associated virus reads (% of good reads) 18353 (1.9) 21247 (2.3) 29612 (2.4) No. of plant-associated virus contigs 3175 2185 2450 No. of samples containing plant-associated virus reads or contigs (%) 195 (27.6) 125 (25.8) 191 (35.7) Percentage of non-identified reads 35.9 31.0 26.0 Percentage of non-identified contigs 43.1 37.4 30.5
differentiated. We therefore used an approach that combined BlastN and BlastX determination of sequence similarity with detailed expert review of each taxon identified. On the basis of pairwise sequence similarity, related groups of virus-like sequences (operational taxonomic units, OTUs) were tentatively assigned to known plant virus families. We then generated maximum likelihood phyloge-netic trees from alignments of OTU protein sequences with homologous GenBank accessions using PhyML 3.1 implemented in MEGA version 6.06 (Tamura et al., 2013) with a JTT amino acid substitution model and 100 bootstrap replicates to quantify branch support. Each OTU-specific tree was individually evaluated to determine whether the OTU-sequences nested within clades containing sequences from the candidate family or appeared to be distinct. Once the most appropriate family was determined, then the OTU was evaluated to deter-mine whether it represented a known species within that family or a potentially novel one. Traditionally, species identities within plant virus families are determined by pairwise sequence identity; viruses are classified as belonging to the same species if their sequence identity is greater than a specific threshold that is particular to each family. To ensure that our ad hoc OTU classification system aligned with the diverse classification systems of known virus families, viral OTUs were classified as known species when they shared 475% pairwise amino acid sequence identity with recognized species in GenBank—75% is the approximate consensus of such species identity thresholds in these plant virus families. More divergent OTUs that phylogenetically clustered within known plant virus families, but sharedo75% aa sequence identity with any of their known members, were classified as potentially novel species within these families. This OTU classifica-tion approach was not used for the mycoviruses because the reads for these viruses were so abundant, divergent and derived from so many different genomic regions that we could not meaningfully align them.
Finally, we tested whether plant virus reads identified in uncultivated plants were less similar to known viruses than those found in cultivated plants. To do this, we portioned plant virus reads according to whether they were obtained from cultivated or uncultivated plants. For each read we took the highest percentage identity Blast search result and compared lists of these identities for read from cultivated or uncultivated plants using a Mann–Whitney U-test.
Results and discussion
Geometagenomics to examine plant virus distributions across the agro-ecological interface
It is well known that viruses cause substantial crop loss and may sometimes be transmitted between
crop and non-crop vegetation. We combined the power of next generation sequencing with best practices in ecological sampling to reveal for the first time the broad sweep of virus infections across agro-ecological landscapes. In total, we analysed 1725 plant samples from France (2010, 2012) and South Africa (2010), using VANA semi-purification and 454 pyrosequencing (Table 1), and detected evidence of 757 plant-associated viruses (PLAVs, both plant viruses and mycoviruses) in 29.6% (511 out of 1725) of the samples (Supplementary Table S3). On the basis of BLAST identities to known viruses and phylogenetic analysis, 42% (318 out of 757) of the detected viruses were found to be most similar to plant viruses and 58% (439 out of 757) most similar to mycoviruses. Plant virus sequences proved easier to classify than those that appeared to be mycoviral. Initial classification of the putative mycoviral reads/contigs suggested that they were most similar to known viruses in the families Partitiviridae (166 out of 439), Chrysoviridae (57 out of 439), and Totiviridae (88 out of 439). An additional 128 reads/contigs appeared to represent single stranded DNA (ssDNA) viruses that might infect fungi (Supplementary Table S3 and Supplementary Material).
In sensitivity tests where we analysed plants with known virus infections, test viruses were success-fully detected in 75.9% (104 out of 137) of cases. As 7 out of 40 of the test viruses were detected by only a single VANA-read (average length 246–301 nt; Table 1 and Supplementary Table S2), we consid-ered a single VANA-read produced from individual field samples to be credible indication of the presence of a plant-associated virus. The rate of cross-contamination (as assessed with negative con-trols) was 4.2%. Rates of unanticipated discovery were somewhat higher (8.3%) in positive control plants, suggesting the real presence of previously unrecognized infections of these plants.
Significantly higher viral prevalence in agricultural areas
Smaller-scale metagenomics surveys of plant vir-omes in natural environments have indicated that ∼ 70% of plant samples in Costa Rican forests (Roossinck et al., 2010) and ∼ 25% of individual plants on an Oklahoma prairie (Muthukumar et al., 2009) harbour identifiable plant viruses. Our esti-mates of PLAVs prevalence in France (2010: 25.8%, 2012: 35.7%) and South Africa (27.6%) were closer to that of the Oklahoma prairie (Table 1).
However, one issue with our sampling procedure that may have impacted our prevalence estimates is that some samples represented individual plants and others represented multiple plants that had been bulked prior to processing. When we excluded the bulked samples from our data, overall virus pre-valence was 18.2% for France in 2010 and 25.7% in 2012 and 21.7% for South Africa in 2010. Although
this indicated that the presence of bulked plant samples may have indeed yielded overestimates of prevalence, the prevalence estimates remained simi-lar to those seen in the Oklahoma prairie ecosystem. We evaluated the extent to which virus prevalence differed between samples collected from cultivated and uncultivated host species. We found that in all surveys the overall proportions of plant samples containing plant viruses were significantly higher (p-valueo0.01, two-tailed Z-test for two population proportions) in cultivated plants relative to unculti-vated plants (Figures 2a–c). Irrespective of whether we considered either only bulked samples or only individual plants samples, plant virus prevalence was higher in cultivated plants than in uncultivated plants (Figures 2d–h). This result is consistent with hypotheses relating to host abundance and pathogen prevalence that generally predict increased pathogen prevalence as host abundance increases (Agrawal et al., 2006; Keesing et al., 2010), as it does in many cropping systems.
We also evaluated the extent to which total virus prevalence differed between samples collected from cultivated and uncultivated areas. We found for two out of the three sampling surveys (South Africa, p-value o0.01, Mann–Whitney U-test, and France 2012, p = 0.0114, Table 2) that the overall prevalence of plant viruses was significantly higher (p-value o0.01, two-tailed Z-test for two population propor-tions) in cultivated areas than it was in uncultivated areas (Table 2).
When the prevalence of plant viruses and mycov-iruses were considered separately, a slightly differ-ent picture emerged. In France, mycovirus prevalence was highest in both uncultivated plants (Figures 2b and c) and uncultivated areas (Table 2). Interestingly, the mycovirus bulked samples preva-lence was higher than the mycovirus individual samples prevalence in uncultivated plants in France (2010, 2012). This suggests that mycoviruses are more concentrated in uncultivated areas than in cultivated ones, which may be attributable to these
0
Virus prevalence
All Plant Myco
Bulked samples 100 60 Host association 20 80 40 * * * 0 V irus prevalence
All Plant Myco
60 40 20 Host association ** ** ** 0 Virus prevalence
All Plant Myco
40 30 10 Host association 20 ** 0 Virus prevalence
All Plant Myco
30 20 10 Host association ** 0 Virus prevalence
All Plant Myco
40 30 10 Host association 20 * 0 Virus prevalence
All Plant Myco
60 40 Host association 20 ** ** 0
All Plant Myco
Host association V irus prevalence 30 20 10 40 ** 0 Virus prevalence
All Plant Myco
60 40 Host association 20 * * Cultivated plants Uncultivated plants All samples South Africa 2010 Bulked samples All samples France 2010 Individual samples Bulked samples All samples France 2012 Individual samples
Figure 2 Virus prevalence associated with cultivated and uncultivated plants. Plant virus and mycovirus prevalence within cultivated and uncultivated plants are indicated in blue and light green, respectively. Significant differences in virus prevalence between cultivated and uncultivated plants are indicated by ** = p-valueo0.01 (two-tailed Z test for two population proportions). In (a–c) sample infection prevalence is defined as the proportion of plant samples that contained at least one plant-associated virus read or contig (PLAVs). In (d, e) individual prevalence is defined as the proportion of samples taken from individual plants that contained at least one PLAVs. Note that this comparison could not be made at the South African site because all cultivated plants that were sampled hado5 g of biomass and, as a consequence of this, multiple plants had to be bulked to obtain enough biomass for analysis. In (f–h) bulked prevalence is defined as the proportion of samples consisting of bulked material from multiple individual plants that contained at least one PLAVs.
viruses having different transmission processes to those of plant viruses (insect transmission for plant viruses vs restricted aerial dispersal for mycoviruses).
By contrast, in South Africa, the prevalence of both plant viruses and mycoviruses was highest in both cultivated plants (Figures 2a–f) and cultivated areas (Table 2). It is possible that these differences between the South African and French sampling sites are a consequence of the different disturbance at these sites. In South Africa, the native ‘fynbos’ vegetation burns naturally about every 15 years (van Wilgen, 2009), with the vegetation primarily regrow-ing from deposited seed. Durregrow-ing the last burn at our sampling site in 2000, only the cropping areas remained unburned. It is possible that regular burning of the fynbos might both reduce the prevalence of viruses that infect fynbos species, which are not seedbourne within this vegetation and constrain the dissemination of plant viruses and mycoviruses, although such phenomena have not yet been studied. At the French site, while no extensive burning has occurred within the last 50 years, agriculture-related ecological disturbances have shifted since the 1940s (Supplementary Figure S1) and locations, which, although presently unculti-vated, were cultivated between the 1970s and 1990s.
Virus diversity does not reflect host diversity
The well-known Janzen–Connell hypothesis in ecol-ogy posits that pathogens enhance the genetic diversity and structure of host populations in natural ecosystems (Gilbert, 2002). Here we ask the impor-tant reciprocal question: Do increases in the diversity of plant hosts drive increases in the diversity of plant viruses (Rottstock et al., 2014)? Our data suggests that this might not be the case for at least one of the three sampling surveys. Specifically, we found at the South African site that the diversity (Shannon– Wiener index) of virus families represented at individual sampling locations was not significantly associated with the diversity of host genera at these locations (Table 2). Further, at the French site, the diversity of virus families was actually greater in cultivated areas (which have lower host diversity) than it was in uncultivated areas in both the 2010 and 2012 sampling surveys (Table 2).
It must, however, be emphasised that the family-level partitioning of virus populations within these analyses limited their power to resolve differences in virus diversity between cultivated and uncultivated areas. Further, it is possible that the proportion of identifiable viruses from uncultivated plant species was lower than that from cultivated species due to biases within GenBank. Our inability to identify highly divergent plant viruses may have been particularly pronounced for the large numbers of indigenous plant species sampled at the South African site since, to our knowledge, prior to our study only a single virus species infecting any of
Table 2 Ave rage Shan non –Wiener index based estimates of diversi ty of fam ily-level PLA Vs (for plant-associa ted vi rus sequ ences) and genus-level plant samples and ave rage p rev alence of PLA Vs, plan t viru ses an d mycovi ruses calc ulated from the 10 0 samp ling point s scored eith er as unc ultivated (72 in France in 20 10, 74 in France in 201 0 and 34 in South Afri ca) or cult ivated (2 8 in France in 2010 , 2 6 in F rance in 2010 and 66 in South Afri ca) Sur vey PLAV s Shan non –Wiene r Index Plants Shannon –Wie ner Ind ex PLAV s prevale nce Plan t virus pr evalenc e Myco virus pr evalenc e Uncult. average Cult. average Z -score Uncu lt. avera ge Cul t. avera ge Z -score Uncult. average Cult. average Z -score Un cult. av erage Cult. average Z -score Un cult. avera ge Cult. avera ge Z -score C201 0 0.2 7 0.2 8 − 0.2 1866 (p = 0.8258 8) 1.31 0.72 − 5.7568 (p o 0.01) 0.2 2 0.2 6 0.1471 (p = 0.8807 6) 0.0 7 0.1 6 1.2602 9 (p = 0.2 0766) 0.16 0.13 1.2801 7 (p = 0.200 54) C201 2 0.5 2 0.6 2 0.5304 3 (p = 0.5961 2) 1.15 0.95 − 2.0352 9 (p = 0.041 36) 0.3 0 0.3 6 1.1944 6 (p = 0.2340 4) 0.1 5 0.2 7 2.5264 4 (p = 0.0 114) 0.20 0.18 1.1119 5 (p = 0.267 ) F20 10 0.5 4 0.9 0 − 2.7 1775 (p o 0.01) 1.67 1.03 5.9 3029 (p o 0.01) 0.1 9 0.5 3 − 5.6 9745 (p o 0.01) 0.0 8 0.1 9 − 3.0 5974 (p o 0.01) 0.16 0.47 5.2936 (p o 0.0 1) Bold text indicates a statistically significant d ifference with a P -value less than 0.05. 8
these plants had ever been characterised. Consistent with this possibility, we detected no viruses at the South African site within indigenous plant species in the families Ebenaceae, Proteaceae and Rhamna-ceae. Similar difficulties with the identification of virus-related sequencing reads either from the environment or from uncultivated plant species have been reported elsewhere (Rosario and Breitbart, 2011; Brum et al., 2016). For example, up to 70% of sequence reads generated during some environ-mental viral metagenomic studies have no detectable homology to sequences within public databases (Rosario and Breitbart, 2011). Here we found that 30.9% of single reads and contigs (Table 1) were not obviously related to any previously submitted GenBank sequences.
Finally, the most obvious bias in any viral metagenomics study is that viral nucleic acids cannot all be isolated with the same efficiency from all environments or hosts. Extreme anatomical and physiological variations between different plant species can strongly impact the ease with which viral nucleic acids can be isolated from different hosts which could in turn bias apparent viral prevalence estimates in favour of the hosts from which nucleic acids are easiest to isolate. Similarly, using isolation procedures that we have employed, the genomic sequences of viruses with more labile capsids should have been more difficult to isolate than those of viruses with stable capsids.
These current limitations of viral metagenomics studies emphasise the possibility that inherent sampling biases, both during the isolation of virus
genomic sequences, and within the databases that are used to identify virus-related sequence reads, are likely to result in the underestimation of viral prevalence and diversity.
Particular virus families significantly associated with agriculture
We investigated the relationships between virus distribution and environmental variables (land use and inter-year effects) in France and South Africa. These analyses indicated that, despite some varia-bility over time, the members of several virus families tended to be found significantly more frequently in cultivated areas than in uncultivated areas (Figure 3). In France, viruses similar to endornaviruses, luteoviruses, virgaviruses, amalga-viruses, tombusviruses and totiviruses were most prevalent in cultivated areas (Figure 3), with the tendency being evident for the first three groups in both sampling years (2010, 2012; Supplementary Figure S2). In South Africa, luteoviruses, tombus-viruses and totitombus-viruses were likewise most prevalent in cultivated areas along with bromoviruses, parti-viruses, chrysoviruses and unclassified ssDNA viruses.
Agriculturally important viruses also infect uncultivated plant species
The prevalence of endornavirus-, luteovirus- and virgavirus-like viruses in cultivated areas at the French site suggest that Poaceae crops (rice and wheat) there were experiencing recurrent infection with these virus families, including with viruses such as Barley yellow dwarf virus (BYDV) and Barley stripe mosaic virus (BSMV). Were agricultural pathogens like these persisting between crop cycles within nearby uncultivated plants, and/or spilling over from crops into uncultivated (non-crop) hosts? We found OTUs closely related to 18 known crop pathogens in 37 uncultivated plant hosts (59.5% of which were located in uncultivated areas) at the French site and 10 (20% in uncultivated areas) at the South African site (Supplementary Table S3). These uncultivated plants might act as crop pathogen reservoirs (Cooper and Jones, 2006), or alternatively, these crop-derived infections may detrimentally impact the uncultivated hosts (Jones, 2009, Alexander et al., 2014; Jones and Coutts, 2015). For example, in the Mediterranean-climate regions of Australia, the introduction of the potyvirus, Bean yellow mosaic virus, has seriously impacted the indigenous legume, Kennedia prostata (Webster et al., 2007).
Interestingly, 7 out of 10 uncultivated plant samples from the South African site that contained OTUs closely related to known plant virus species were from exotic plants (Supplementary Table S3). Likewise, exotic plants in South Africa had a greater prevalence of PLAVs than did indigenous plants
FRANCE S.AFRICA Alphaflexiviridae - ssRNA(+) Amalgaviridae - dsRNA * Benyvirus - ssRNA(+) . Bunyaviridae - ssRNA(-) . Caulimoviridae - dsDNA Closteroviridae - ssRNA(+) . Emaravirus - ssRNA(-) Geminiviridae - ssDNA Higrevirus - ssRNA(+) * Nanoviridae - ssDNA . Potyviridae - ssRNA(+) Reoviridae - dsRNA Rhabdoviridae - ssRNA(-) Secoviridae - ssRNA(+)
Unclass. RNA viruses - RNA .
Betaflexiviridae - ssRNA(+) * Bromoviridae - ssRNA(+) * Chrysoviridae - dsRNA * . Endornaviridae - dsRNA . * Luteoviridae - ssRNA(+) ** * Partitiviridae - dsRNA * . Sobemovirus - ssRNA(+) . . Tombusviridae - ssRNA(+) * * Totiviridae - dsRNA * * Tymoviridae - ssRNA(+) . . Virgaviridae - ssRNA(+) . *
Unclass. DNA viruses - ssDNA ** .
0.5 0.4 0.3 0.2 0.1 0 Association with land use
0.1 0.2 0.3 0.4 0.5
Fallow and old fields Intensive crop
Intact native Woodlots and pasture
Degraded native
Figure 3 Spatial associations of virus family communities with degrees of land usage. Association of virus communities with land use. The colour gradient represents the Pearson correlation coefficient in the fourth-corner analyses (testing virus vs environ-ment relationships). Significance is indicated by: p-valueo0.1, *p-valueo0.05 and **p-valueo0.01.
(Z-Score = 7.466, p-value =o0.01; Supplementary Figure S3). This difference may be important because in other Mediterranean-climate ecosystem (California, Australia), there has been notable con-cern about virus exchange between exotic species and indigenous uncultivated plants (Malmstrom et al., 2005a; Webster et al., 2007). In addition, the success of exotic plant species invading new ecosystems can be influenced by their capacity to increase the pathogen loads of the indigenous species with which they compete (Malmstrom et al., 2005b; Borer et al., 2007). On the other hand, plant virus accumulation may, over time, cause declines in the density and distribution of exotic plants and facilitate the recovery of native species (Flory and Clay, 2013).
Identification of novel viruses
We adopted an approach based on pairwise sequence similarity (BlastN or BlastX) and phyloge-netic analyses to assign related groups of virus-like sequences (OTUs) to known plant virus families (Supplementary Figure S4). Collectively, across all three sampling surveys, 120 plant virus OTUs were identified from 255 of the 1725 analysed plant samples (Supplementary Table S3 and Supplementary Material). Ninety-four of these 120 OTUs share 27–75% identity (median = 49%) with known plant virus species and might represent novel species within 19 of the 22 plant virus families currently recognized by the ICTV (Roossinck, 2011, King et al., 2012) or 4 of the 12 recognised but unassigned virus genera (Supplementary Table S3). Furthermore, of the OTUs representing putative novel species, nearly half (45 out of 94) could plausibly represent novel genera within 16 different families (inferred aa sequence identity o50% with any known members of those families). Whereas, 40 out of 45 of these OTUs were found within uncultivated species at the French and South African sites, five were obtained from cultivated species at the French site (Supplementary Table S3).
Novel plant virus OTUs were mostly from native plants in uncultivated communities
Are viruses found in uncultivated hosts likely to be more dissimilar to known viruses than are viruses detected in cultivated hosts (Roossinck, 2011, 2012)? Whereas 80.9% (76/94) of OTUs representing poten-tial new species were found within uncultivated plants, only 8.6%, (8 out of 94) were found within cultivated plants (Supplementary Table S3). This finding supports the hypothesis that the known plant-infecting virus species are but a tiny fraction of the total occurring in terrestrial environments. It also suggests that our present view of plant-infecting virus diversity is heavily biased in favour of viruses causing recognisable diseases in domesticated plant species (Wren et al., 2006; Roossinck et al., 2015).
Although OTUs recovered from uncultivated plants were on average less closely related to known viruses than those recovered from cultivated plants (respec-tively displaying median identities to a most closely related known virus of 54.8% and 66.8%), this difference was not significant (median identity = ; p-value = 0.1187; Mann Whitney U-test). This sug-gests that even in well-studied cultivated host species, there likely remain large numbers of undiscovered plant viruses.
Conclusion
Our findings reveal the breadth and abundance of plant-infecting viruses in agro-ecological landscapes, where infection is found throughout cultivated and uncultivated plant communities alike. In matched surveys in French and South African sites, we found more than 120 plant virus OTUs representing 19 of the 22 currently recognised plant-infecting virus families. Ninety-four of these OTUs likely represent novel virus species or genera, with potential, when fully characterized, to enlarge the list of known plant virus species by as much as 7.2%. Besides confirm-ing that currently known plant-infectconfirm-ing virus species are likely a tiny fraction of the total occurring in terrestrial environments, our spatially-informed metagenomics-based approach has provided the most convincing evidence yet of the impact of agriculture on the distribution, prevalence and diversity of plant viruses in the environment. It remains to be determined whether preferential associations of specific virus groups with ecologi-cally disturbed areas, or increased plant virus prevalence within such areas, increase the probabil-ity of pathogen emergence.
Conflict of Interest
The authors declare no conflict of interest.
Acknowledgements
We thank Mr Paul Loubscher and colleagues from Buffelsfontein Game and Nature Reserve and to La Tour du Valat. DPM, AV and GWH are supported by the National Research Foundation of South Africa. PR is supported by EU grant FP7-PEOPLE-2013-IOF (No. PIOF-GA-2013-622571). CMM was supported by MSU AgBio-Research and NSF DEB-08343140. This work was supported by Direction Générale de l‘Armement, MEM INRA Metaprogram, the Fondation pour la Recherche.
References
Agrawal AA, Lau JA, Hamback PA. (2006). Community heterogeneity and the evolution of interactions between plants and insect herbivores. Q Rev Biol 81: 349–376.
Alexander HM, Mauck KE, Whitfield AE, Garrett KA, Malmstrom CM. (2014). Plant-virus interactions and the agro-ecological interface. Eur J Plant Pathol 138: 529–547.
Allan BF, Keesing F, Ostfeld RS. (2003). Effect of forest fragmentation on Lyme disease risk. Conserv Biol 17: 267–272.
Altschul SF, Gish W, Miller W, Myers EW, Lipman DJ. (1990). Basic local alignment search tool. J Mol Biol 215: 403–410.
Anderson PK, Cunningham AA, Patel NG, Morales FJ, Epstein PR, Daszak P. (2004). Emerging infectious diseases of plants: pathogen pollution, climate change and agrotechnology drivers. Trends Ecol Evol 19: 535–544.
Benjamini Y, Hochberg Y. (1995). Controlling the false discovery rate - a practical and powerful approach to multiple testing. J R Stat Soc Ser B-Methodol 57: 289–300.
Bernardo P, Golden M, Akram M, Naimuddin, Nadarajan N, Fernandez E et al. (2013). Identification and character-isation of a highly divergent geminivirus: evolutionary and taxonomic implications. Virus Res 177: 35–45. Borer ET, Hosseini PR, Seabloom EW, Dobson AP. (2007).
Pathogen-induced reversal of native dominance in a grassland community. Proc Natl Acad Sci USA 104: 5473–5478.
Brum JR, Ignacio-Espinoza JC, Kim EH, Trubl G, Jones RM, Roux S et al. (2016). Illuminating structural proteins in viral 'dark matter' with metaproteomics. Proc Natl Acad Sci USA 113: 2436–2441.
Burdon JJ, Thrall PH, Ericson AL. (2006). The current and future dynamics of disease in plant communities. Annu Rev Phytopathol 44: 19–39.
Cooper I, Jones RA. (2006). Wild plants and viruses: under-investigated ecosystems. AdvVirus Res 67: 1–47. Department of Economic and Social Affairs, PD, United
Nations. (2015). World Population prospects: The 2015 Revision, Key Findings and Advance Tables. United Nations: New York.
Dixon P. (2003). Vegan, a package of R functions for community ecology. J Veg Sci 14: 927–930.
Doledec S, Chessel D, Terbraak CJF, Champely S. (1996). Matching species traits to environmental variables: a new three-table ordination method. Environ Ecol Stat 3: 143–166.
Dray S, Legendre P. (2008). Testing the species traits-environment relationships: the Fourth-Corner problem revisited. Ecology 89: 3400–3412.
Edgar RC. (2004). Muscle: a multiple sequence alignment method with reduced time and space complexity. BMC Bioinf 5: 113.
Flory SL, Clay K. (2013). Pathogen accumulation and long-term dynamics of plant invasions. J Ecol 101: 607–613. Gilbert GS. (2002). Evolutionary ecology of plant diseases in natural ecosystems. Annu Rev Phytopathol 40: 13–43.
Hill MO, Smith AJE. (1976). Principal component analysis of taxonomic data with multistate discrete characters. Taxon 25: 249–255.
Huang XQ, Madan A. (1999). CAP3: a DNA sequence assembly program. Genome Res 9: 868–877.
Jones RAC. (2009). Plant virus emergence and evolution: origins, new encounter scenarios, factors driving emergence, effects of changing world conditions, and prospects for control. Virus Res 141: 113–130.
Jones RAC, Coutts BA. (2015). Spread of introduced viruses to new plants in natural ecosystems and the threat this poses to plant biodiversity. Mol Plant Pathol 16: 541–545.
Keesing F, Belden LK, Daszak P, Dobson A, Harvell CD, Holt RD et al. (2010). Impacts of biodiversity on the emergence and transmission of infectious diseases. Nature 468: 647–652.
King AMQ, Adams MJ, Carstens EB, Lefkowitz EJ. (2012). Virus Taxonomy. In: King AMQ, Adams MJ, Carstens EB, Lefkowitz EJ (eds). Classification and Nomenclature of Viruses, Ninth Report of the International Committee on Taxonomy of Viruses. Elsevier: Amsterdam, Boston, Heidelberg, London, New York, Oxford, Paris, San Diego, San Francisco, Singapore, Sydney, Tokyo. Lacroix C, Jolles A, Seabloom EW, Power AG, Mitchell CE,
Borer ET. (2014). Non-random biodiversity loss under-lies predictable increases in viral disease prevalence. J R Soc Interface 11: 20130947.
Legendre P, Legendre L. (2012). Numerical Ecology. Else-vier Science BV: Amsterdam.
Malmstrom CM, Hughes CC, Newton LA, Stoner CJ. (2005a). Virus infection in remnant native bunch-grasses from invaded California grasslands. New Phytol 168: 217–230.
Malmstrom CM, Mccullough AJ, Johnson HA, Newton LA, Borer ET. (2005b). Invasive annual grasses indirectly increase virus incidence in California native perennial bunchgrasses. Oecologia 145: 153–164.
Martin M. (2011). Cutadapt removes adapter sequences from high-throughput sequencing reads. EMBnet 17(1): 10.
Mitchell CE, Tilman D, Groth JV. (2002). Effects of grassland plant species diversity, abundance, and composition on foliar fungal disease. Ecology 83: 1713–1726.
Muthukumar V, Melcher U, Pierce M, Wiley GB, Roe BA, Palmer MW et al. (2009). Non-cultivated plants of the Tallgrass Prairie Preserve of northeastern Oklahoma frequently contain virus-like sequences in particulate fractions. Virus Res 141: 169–173.
Muthukumar V, Wiley GB, Pierce ML, Roe BA, Melcher U. (2007). Metagenomics for identification of novel plant viruses. Phytopathology 97: S81–S82.
Myers N, Mittermeier RA, Mittermeier CG, DA Fonseca GA, Kent J. (2000). Biodiversity hotspots for conservation priorities. Nature 403: 853–858.
Nibert ML, Ghabrial SA, Maiss E, Lesker T, Vainio EJ, Jiang D et al. (2014). Taxonomic reorganization of family Partitiviridae and other recent progress in partitivirus research. Virus Res 188: 128–141.
Pagan I, Gonzalez-Jara P, Moreno-Letelier A, Rodelo-Urrego M, Fraile A, Pinero D et al. (2012). Effect of biodiversity changes in disease risk: exploring disease emergence in a plant-virus system. PLoS Pathog 8: e1002796. Palanga E, Filloux D, Martin DP, Fernandes E, Gargani D,
Ferdinand R et al. (2016). Metagenomic-based screen-ing And molecular characterization of cowpea-infecting viruses in Burkina Faso. PLoS One 11: e0165188.
Roossinck MJ. (2011). The big unknown: plant virus biodiversity. Curr Opin Virol 1: 63–67.
Roossinck MJ. (2012). Plant virus metagenomics: biodiver-sity and ecology. Annu Rev Genet 46: 359–369. Roossinck MJ, Garcia-Arenal F. (2015). Ecosystem
simpli-fication, biodiversity loss and plant virus emergence. Curr Opin Virol 10C: 56–62.
Roossinck MJ, Martin DP, Roumagnac P. (2015). Plant virus metagenomics: advances in virus discovery. Phyto-pathology 105: 716–727.
Roossinck MJ, Saha P, Wiley G, Quan J, White J, Lai H et al. (2010). Ecogenomics: using massively parallel pyrose-quencing to understand virus ecology. Mol Ecol 19: 81–88.
Rosario K, Breitbart M. (2011). Exploring the viral world through metagenomics. Curr Opin Virol 1: 1–9. Rottstock T, Joshi J, Kummer V, Fischer M. (2014). Higher
plant diversity promotes higher diversity of fungal pathogens, while it decreases pathogen infection per plant. Ecology 95: 1907–1917.
Scherr SJ, Mcneely JA. (2008). Biodiversity conservation and agricultural sustainability: towards a new para-digm of 'ecoagriculture' landscapes. Philos Trans R Soc Lond B Biol Sci 363: 477–494.
Tamura K, Stecher G, Peterson D, Filipski A, Kumar S. (2013). MEGA6: molecular evolutionary genetics ana-lysis version 6.0. Mol Biol Evolut 30: 2725–2729. Thresh JM. (1981). Pests, Pathogens, and Vegetation.
Pitman Books Limited: London.
van Wilgen BW. (2009). The evolution of fire and invasive alien plant management practices in fynbos. S Afr J Sci 105: 335–342.
Varsani A, Shepherd DN, Monjane AL, Owor BE, Erdmann JB, Rybicki EP et al. (2008). Recom-bination, decreased host specificity and increased
mobility may have driven the emergence of maize streak virus as an agricultural pathogen. J Gen Virol 89: 2063–2074.
Webster CG, Coutts BA, Jones RAC, Jones MGK, Wylie SJ. (2007). Virus impact at the interface of an ancient ecosystem and a recent agroecosystem: studies on three legume-infecting potyviruses in the southwest Australian floristic region. Plant Pathol 56: 729–742. Wren JD, Roossinck MJ, Nelson RS, Scheets K, Palmer MW,
Melcher U. (2006). Plant virus biodiversity and ecology. PLoS Biol 4: e80.
Wu S, Manber U. (1992). Agrep–a fast approximate pattern-matching tool. Usenix Winter, 53–162.
This work is licensed under a Creative Commons Attribution 4.0 International License. The images or other third party material in this article are included in the article’s Creative Commons license, unless indicated otherwise in the credit line; if the material is not included under the Creative Commons license, users will need to obtain permission from the license holder to reproduce the material. To view a copy of this license, visit http:// creativecommons.org/licenses/by/4.0/
© The Author(s) 2017
Supplementary Information accompanies this paper on The ISME Journal website (http://www.nature.com/ismej)