HAL Id: hal-02646826
https://hal.inrae.fr/hal-02646826
Submitted on 29 May 2020
HAL is a multi-disciplinary open access
archive for the deposit and dissemination of
sci-entific research documents, whether they are
pub-lished or not. The documents may come from
teaching and research institutions in France or
abroad, or from public or private research centers.
L’archive ouverte pluridisciplinaire HAL, est
destinée au dépôt et à la diffusion de documents
scientifiques de niveau recherche, publiés ou non,
émanant des établissements d’enseignement et de
recherche français ou étrangers, des laboratoires
publics ou privés.
analyses of density-dependent behavioural plasticity in
the Australian plague locust
Marie Pierre Chapuis, Donya Tohidi-Esfahani, Tim Todgson, Laurence
Blondin, Fleur Ponton, Darron Cullen, Stephen J. Simpson, Gregory A. Sword
To cite this version:
Marie Pierre Chapuis, Donya Tohidi-Esfahani, Tim Todgson, Laurence Blondin, Fleur Ponton, et al..
Assessment and validation of a suite of reverse transcription-quantitative PCR reference genes for
analyses of density-dependent behavioural plasticity in the Australian plague locust. BMC Molecular
Biology, BioMed Central, 2011, 12 (7), pp.1 - 11. �10.1186/1471-2199-12-7�. �hal-02646826�
R E S E A R C H A R T I C L E
Open Access
Assessment and validation of a suite of reverse
transcription-quantitative PCR reference genes for
analyses of density-dependent behavioural
plasticity in the Australian plague locust
Marie-Pierre Chapuis
1,2,3*, Donya Tohidi-Esfahani
1, Tim Dodgson
1, Laurence Blondin
2, Fleur Ponton
1,
Darron Cullen
1, Stephen J Simpson
1, Gregory A Sword
1,4Abstract
Background: The Australian plague locust, Chortoicetes terminifera, is among the most promising species to unravel the suites of genes underling the density-dependent shift from shy and cryptic solitarious behaviour to the highly active and aggregating gregarious behaviour that is characteristic of locusts. This is because it lacks many of the major phenotypic changes in colour and morphology that accompany phase change in other locust species. Reverse transcription-quantitative polymerase chain reaction (RT-qPCR) is the most sensitive method available for determining changes in gene expression. However, to accurately monitor the expression of target genes, it is essential to select an appropriate normalization strategy to control for non-specific variation between samples. Here we identify eight potential reference genes and examine their expression stability at different rearing density treatments in neural tissue of the Australian plague locust.
Results: Taking advantage of the new orthologous DNA sequences available in locusts, we developed primers for genes encoding 18SrRNA, ribosomal protein L32 (RpL32), armadillo (Arm), actin 5C (Actin), succinate dehydrogenase (SDHa), glyceraldehyde-3P-dehydrogenase (GAPDH), elongation factor 1 alpha (EF1a) and annexin IX (AnnIX). The relative
transcription levels of these eight genes were then analyzed in three treatment groups differing in rearing density (isolated, short- and long-term crowded), each made up of five pools of four neural tissue samples from 5thinstar nymphs. SDHa and GAPDH, which are both involved in metabolic pathways, were identified as the least stable in expression levels, challenging their usefulness in normalization. Based on calculations performed with the geNorm and NormFinder programs, the best combination of two genes for normalization of gene expression data following crowding in the Australian plague locust was EF1a and Arm. We applied their use to studying a target gene that encodes a Ca2+binding glycoprotein, SPARC, which was previously found to be up-regulated in brains of gregarious desert locusts, Schistocerca gregaria. Interestingly, expression of this gene did not vary with rearing density in the same way in brains of the two locust species. Unlike S. gregaria, there was no effect of any crowding treatment in the Australian plague locust.
Conclusion: Arm and EF1a is the most stably expressed combination of two reference genes of the eight examined for reliable normalization of RT-qPCR assays studying density-dependent behavioural change in the Australian plague locust. Such normalization allowed us to show that C. terminifera crowding did not change the neuronal expression of the SPARC gene, a gregarious phase-specific gene identified in brains of the desert locust, S. gregaria. Such comparative results on density-dependent gene regulation provide insights into the evolution of gregarious behaviour and mass migration of locusts. The eight identified genes we evaluated are also candidates as normalization genes for use in experiments involving other Oedipodinae species, but the rank order of gene stability must necessarily be determined on a case-by-case basis.
* Correspondence: marie-pierre.chapuis@cirad.fr
1
School of Biological Sciences, University of Sydney, Sydney, NSW 2006, Australia
Full list of author information is available at the end of the article
© 2011 Chapuis et al; licensee BioMed Central Ltd. This is an Open Access article distributed under the terms of the Creative Commons Attribution License (http://creativecommons.org/licenses/by/2.0), which permits unrestricted use, distribution, and reproduction in any medium, provided the original work is properly cited.
Background
Locusts are an excellent model organism for analyses of phenotypic plasticity in behaviour and other traits [1]. Plastic phenotypic responses to crowding are expressed to varying degrees among insects in the orders Coleop-tera, LepidopColeop-tera, HemipColeop-tera, and Orthoptera [2]. The expression of phase polyphenism, in which individuals can undergo extreme density-dependent changes in behaviour, physiology, colour and morphology, is a defining feature of locusts (Orthoptera: Acrididae) [3]. Among this complex suite of traits, behaviour is the first to respond to changes in local population density and lies at the heart of swarm formation and migration [1]. Locusts reared under low population density conditions develop into the shy and cryptic solitarious phase, whereas rearing at high population density results in the highly active and aggregating gregarious phase. As local population size increases, patchy resource distributions in a habitat tend to concentrate solitarious phase locusts. Cues associated with contact among individuals on these resources mediate the process of phase change, referred to as gregarization, and cause initially solitar-ious phase locusts to become attracted rather than repelled by others [4]. A positive feedback loop is then established that can drive an initially solitarious popula-tion into the swarming gregarious phase [1].
Along with major advances in our understanding of locust behaviour and ecology, substantial progress has been made toward understanding the neurophysiological mechanisms underlying the process of behavioural phase change [3]. However, unravelling the molecular genetic basis of the shift from solitarious to gregarious behaviours remains the“final frontier” in locust research [3]. In recent years, insight into the putative functions of specific candidate genes involved in phase polyphen-ism has been obtained through gene expression profiling analyses under different density conditions [5-7]. More-over, Rahman et al. [8] applied the differential display PCR method [9] for locust brain tissue, the findings of which were confirmed by semi-quantitative reverse tran-scription PCR. The differential display PCR method sys-tematically detects changes in mRNA profiles without the need for any prior knowledge of genomic informa-tion of the study organism. Funcinforma-tional genomics resources have also been developed for key locust spe-cies that will further foster the exploration of non-hypothesis driven high-throughput gene expression data resulting from microarrays [10-12]. Therefore, it is rea-sonable to expect gene expression studies to become increasingly prominent in analyses of locust phase poly-phenism. These techniques will likely be extended to other non-model taxa provided they bear sufficient genetic similarity.
Although at least 23 grasshopper species show ele-ments of density-dependent phase polyphenism, our understanding of locust behaviour is primarily based on studies of the desert locust, Schistocerca gregaria, and to a lesser extent, the migratory locust, Locusta migratoria [3]. The Australian plague locust, Chortoicetes termini-fera, is one of Australia’s most significant agricultural pests and has recently emerged as a new model of con-siderable interest for studying the transition between the two behavioural phases. Despite the lack of striking changes in colour and morphology, which are seen so prominently in L. migratoria and S. gregaria, C. termini-fera was recently shown to exhibit full density-depen-dent behavioural gregarization within days of crowding [13,14]. Therefore, the quantification of density-depen-dent transcriptional responses in C. terminifera might be particularly suited to identify the suite of genes underlying locust behaviour plasticity, as it may avoid confounding transcriptional changes associated with the expression of additional density-dependent traits seen notably in other locust species [13]. Furthermore, because the ability to change phase from solitarious to gregarious in response to increased population density has evolved multiple times within the grasshopper family Acrididae and resulted in a phylogenetically het-erogeneous group of‘locusts’ [15-17], comparison of dif-ferential gene transcription across C. terminifera, L. migratoria and S. gregaria may provide insights into the evolution of gregarious behaviour and mass migration [13].
Reverse transcription-quantitative Polymerase Chain Reaction (RT-qPCR) is the most reproducible and sensi-tive method available to measure mRNA transcription levels for individual genes, and is often used to confirm results from high-throughput systems like microarrays. However, the quality of results is directly related to data normalization that eliminates template heterogeneity due to variations in initial sample amount, mRNA recovery and integrity, and reverse transcription effi-ciency [18,19]. The most common normalization techni-que uses internal standards, mainly housekeeping genes, so called because their transcription occurs in all nucleated cell types since they are necessary for cell sur-vival [20]. The expression of housekeeping genes is often presumed to be stable across experimental proce-dures and cell types. Despite this assumption, numerous studies have shown that such housekeeping genes can be differentially expressed, thereby compromising their use as stable internal standards (e.g. [21]).
To avoid bias from normalization, the stable expres-sion of candidate reference genes should be validated under specific experimental conditions. The use of a suite of multiple stably-expressed reference genes is
currently the gold standard [19,20,22]. To this aim, sta-tistical approaches have been developed to determine the best-suited genes for normalization from a panel of candidate genes in a given set of biological samples [e.g. [23,24]]. Accordingly, studies of the transcriptional sta-bility of reference genes are becoming more common. Yet, to our knowledge, the only insects for which suites of reference genes have been validated and published are those of a few model organisms, namely Apis melli-fera [25,26], Tribolium castaneaum [27] and Bombyx mori [28], as well as those of Bombus terrestris and lucorum [29], Liposcelis bostrychophila [30], and S. gre-garia [31].
The study of Van Hiel et al. [31] in the desert locust, S. gregaria, provides an initial set of reference genes to be evaluated for rearing density-controlled experiments in locusts. The authors validated seven reference genes for their stability during development in brains, which are of critical importance to the neuronal and neuro-endocrine processes involved in behaviour. However, the stable expression of these genes across the different rearing density treatments that must be imposed for analyses of density-dependent phase polyphenism in locusts has not yet been examined. In the present study, we used the S. gregaria mRNA sequences from Van Hiel et al. [31], supplemented with data on L. migratoria [11], which is a member of the same subfamily as C. ter-minifera (Oedipodinae), to identify partial sequences for 8 orthologs of putative housekeeping genes in C. termi-nifera. We evaluated the stability of these genes in neural tissue as candidates for normalization in RT-qPCR assays to study transcriptional-changes involved in the initiation and maintenance of density-dependent behavioural phase change in the Australian plague locust. We then applied our RT-qPCR normalization in studying the variation in expression across treatment groups of the gregarious phase-specific gene identified by Rahman et al. [8] in brains of S. gregaria. This gene which was found to be dominantly expressed in crowded gregarious phase locusts [8], shares high homology with the gene that encodes the Ca2+binding glycoprotein SPARC (Secreted Protein Acidic and Rich in Cysteine). It modulates cell adhesion, is essential to mesoderm development and affects mobility [32-34]. The final overall goal in this study was to develop an accurate and comprehensive method of RT-qPCR for use in studies of locust phase polyphenism that complies with MIQE recommendations for essential quality infor-mation [19].
Results
Sample purity and concentration
RNA integrity was confirmed using denaturing gel elec-trophoresis and visualisation of intact rRNA subunits of
28S and 18S. The rRNA bands from C. terminifera sam-ples were ~1.8 and 2.3 kb, the former showing greater intensity. The 28S rRNA (4-5 kb) of most invertebrates dissociates into two subunits under denaturing condi-tions due to the breaking of a phosphodiester bond in the primary structure, referred to as the ‘hidden break’ by Ishikawa [35]. It is likely that the site of the hidden break in the 28S molecule is determined by the size of the 18S rRNA (1.8 kb) [35]. At least one of the 28S frag-ments resulting from the hidden break is expected to have the same or similar electrophoretic mobility to 18S rRNA. Our gel banding pattern suggests that the intense 1.8 kb band contains the 18S rRNA and a smaller frag-ment of the 28S rRNA while the larger fragfrag-ment of the 28S molecule is 2.3 kb. Formaldehyde (denaturing) agar-ose gels of the 15 C. terminifera total RNA samples can be seen in Additional file 1.
RNA quantities were assessed with a Nanodrop ND-1000 spectrophotometer (Nanodrop Technologies) and ranged between 153 and 368 ng μL-1 of total RNA. Interestingly, pooled brains and thoracic ganglia from long-term crowded samples yielded 40% more total RNA than those from either the isolated or 24 h-crowded groups (t-tests, P = 0.03). This could possibly result from larger brain sizes of 5thinstar nymphs reared under long-term crowded condition as recently shown by Ott and Rogers [36] in the desert locust. All samples were assumed adequately free from protein contamina-tion and (organic) salts since they showed 260/280 and 260/230 nm ratios higher than 1.9 and 1.7 respectively. Additional file 2 provides further details about total RNA sample purity and concentration.
Expression level and PCR efficiency
Six out of the 360 PCR reactions led to unexpected melt temperatures and were discarded. Figure 1 shows that all candidate reference genes except 18SrRNA were moderately abundant, with Cq values averaging from 20 for EF1a to 30 for RpL32. Expression of 18SrRNA was high in the tested samples, with Cq values averaging 9.5. The maximal standard deviation of Cq values for the three replicates was 0.42 over all biological samples and primer pairs (i.e. coefficient of variation of 1.4%). Table 1 shows the efficiency of RT-qPCR amplification for each primer pair. All but one slope of standard curves were -3.9 to -3.3, which translates in PCR effi-ciencies to 1.8- 2 fold increases per cycle. The exception was Actin with a slope of -4.5, i.e. PCR efficiency of 1.66 fold increase per cycle. The mean square errors of regression were between 0.01 and 0.08, below the recommended threshold of 0.2. The standard deviations of the estimated PCR efficiencies are reported in Table 1 from duplicated standard curves. All but one standard deviations were below 0.05 (i.e. coefficient of
variation of 2.5%). Standard deviation reached 0.10 for SDHa (i.e. coefficient of variation of 5% ).
Potential for gDNA amplification
Table 2 shows that primer pairs for Arm, Actin, SDHa, and AnnIX to be used in RT-qPCR runs failed to amplify genomic DNA. This is most likely because the primers flank an intron (e.g. see Actin in Additional file 3) which is too large for the 20s extension time in the PCR protocol (see Methods). An amplicon of 500 bp requires at least 20s extension time (LightCycler 480 SYBR Green I Master manual, version Feb 2008), so any target exceeding this length would fail to amplify.
Any potential genomic DNA amplification of EF1a and GAPDH genes can be detected through the melt tem-peratures, which markedly differed from that of cDNA amplicons. In addition, gDNA Cq values for both genes were≥ 10 cycles larger than the highest observed Cq value from our diluted cDNA samples (see Figure 1 for ranges of Cq values in our assay). The PCR inefficiency and different amplicon identity may result from partial and non-specific annealing although one primer spans exon-exon boundaries for both genes (see Additional file 3 for alignment data). In contrast, 18SrRNA and RpL32 primers amplified gDNA and cDNA fragments of similar size and melt temperature. gDNA Cq values were similar to those from our diluted cDNA samples, which makes these two genes susceptible to potential gDNA contami-nation in RT-qPCR. Nevertheless, none of the noRT samples were found to amplify these two genes in the present study. This is perhaps because the gDNA con-centration was too low to result in a detectable product and thus all the samples were considered as non-contaminated.
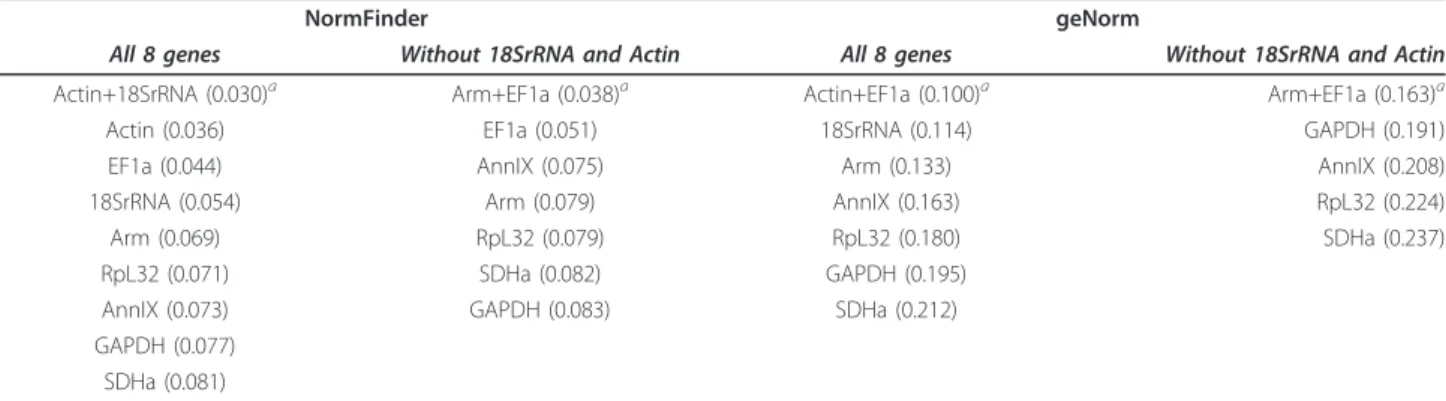
Expression stability
Table 3 shows that geNorm and NormFinder softwares ranked the eight candidate reference genes similarly. The four most stable genes were found to be Actin, EF1a, 18SrRNA, and Arm by both programs. Actin and EF1a was found to be the most stably expressed pair of genes in geNorm. Levels of pairwise variation between two sequential normalization factors were all below the cut-off value of 0.15 (see Additional file 4). In addition, the threshold for an unstable gene in geNorm is an aver-age expression stability measure of 1.5, far above our
I C24h CLT
Cq
Figure 1 Mean Cq values in RT-qPCR study. Boxes and error bars represent the mean ± standard deviation over biological samples and technical replicates of Cq values computed from the second derivative method. Groups are isolated (I), 24 h-crowded (C24 h), and
long-term crowded (CLT).
Table 1 Primer sequences, amplicon lengths and reaction efficiencies in RT-qPCR study
Symbol Primer sequence (5’-3’) size (bp) Tm (°C) Primer E (error) SD(E) 18SrRNA F: CTGAGAAACGGCTACCACATC R: ACCAGACTTGCCCTCCAAT 171 84.9 0.25 1.91 (0.02) 0.02 Arm F: ACTTCTTATGAGAGCATTCCAGGAT R: CCTTCAACAATTTCTTCCATGC 114 83.2 0.3 1.81 (0.03) 0.01 EF1a F: AGCCCAGGAGATGGGTAAAG R: CTCTGTGGCCTGGAGCATC 155 81.4 0.3 1.99 (0.08) 0.04 RpL32 F: ACTGGAAGTCTTGATGATGCAG R: CTGAGCCCGTTCTACAATAGC 97 78.6 0.25 1.97 (0.05) 0.04 GAPDH F: AATTGCCTGGCACCATTG R: CGCCACAACTTTCCAGATG 128 80.7 0.3 1.95 (0.06) 0.00 Actin F: TTGTGTTGGATTCTGGTGATG R: GAAGCTGTAGCCCCTCTCAG 149 83.5 0.5 1.66 (0.01) 0.02 SDHa F: CCACTGAAACTGATCCAAGAGAG R: TCCTGCTCCATTAACTAAGCAAC 98 76.2 0.3 1.90 (0.05) 0.10 AnnIX F: GGAACTGATGAGGAAGCCATT R: TGGCCTGAAGTGTCTCCTTT 134 77.2 0.5 1.91 (0.04) 0.05
size: size of the cDNA amplicon; Tm: melt temperature of the PCR amplicon averaged over the 15 biological samples and 3 technical replicates; Primer: primer concentration inμM; E: in-run PCR reaction efficiency (fold increase per cycle) computed from the standard curve of a serial dilution included in the same plate as for samples S1 to S15 and using the formulae 10-(1/-slope of the standard curve)
; error: the mean square error of the standard curve; SD(E): standard deviation of the PCR efficiencies estimated from duplicated standard curves (different RT-qPCR runs and cDNA templates).
maximal observed value of 0.212 for the least stable gene, SDHa. Thus, geNorm examination suggests that all eight candidate genes are stable enough to be used for normal-ization, and the addition of a third gene to the normaliza-tion is not imperative. The most stably expressed gene selected by NormFinder was Actin followed by EF1a then 18SrRNA. The best stability measure for a pairwise com-bination with Actin was provided by 18SrRNA (0.030) followed closely by EF1a (0.031). When comparing the long-term crowded and isolated groups only, Actin and EF1a remained the two reference genes of choice by using both programs (results not shown). EF1a and Actin also remained as the most stable genes when compared between 24 h crowded and isolated locusts (results not shown). Because the use of rRNA (as opposed to mRNA transcript) for normalization is debated due to its great abundance (see Discussion) and Actin primer pair effi-ciency was restrained (i.e. Effieffi-ciency = 1.66, see Table 1), we performed the geNorm and NormFinder analyses
without 18SrRNA and Actin (see Table 3). The most stable combination of two genes selected was EF1a and Arm.
Gene expression of a target gene
In order to apply the selected set of reliable reference genes, we analyzed the relative expression of a target gene in the nymphal brains of C. terminifera under dif-ferent crowding conditions. We designed forward and reverse primers (F-TCTGGAAATGGTGTGACTTGG and R-ATAAGTGGAGCACGGATTG) for RT-qPCR using primer sequences conserved within the SPARC orthologs for L. migratoria (LMC_004100 in LocustDB; [11]) and S. gregaria (AY751536; [8]). Size (85 bp) and singularity of PCR product was confirmed with gel elec-trophoresis and sequencing. PCR reaction efficiency with SPARC RT-qPCR primers at 0.5 μM was 1.80 (fold increase per cycle). No change in SPARC gene expres-sion could be detected when comparing long-term or 24 hour crowded insects to solitary insects (P = 0.801 and 0.631). These results were obtained by using EF1a and Arm as reference genes and in-run PCR efficiency estimates. Using Actin and EF1a for normalization gave similar p-values and expression ratios.
Discussion
Knowledge of mRNA transcription levels in response to crowding is central to understanding the molecular mechanisms and evolution of density-dependent phase polyphenism in locusts. Now that high-throughput sys-tems are becoming more widely available, gene expres-sion studies and in particular the use of RT-qPCR will become even more important for molecular genetics and evolutionary research in locusts. However, success-ful RT-qPCR experiments require multiple, caresuccess-fully validated, reference genes to allow for reliable data nor-malization and determination of differentially expressed genes.
Table 2 Details of PCR amplification of a genomic DNA template Symbol size (bp) Tm (°C) Cq (cycles) 18SrRNA ~170 84.3 14.8
Arm no amplification no amplification no amplification EF1a# light smear 3 peaks: 76.6; 79.8; 83.7 35.8
RpL32 ~100 78.4 28.8
GAPDH# light smear 79.8 34.9
Actin ~650 no amplification no amplification SDHa no amplification no amplification no amplification AnnIX light smear no amplification no amplification
Genomic DNA amplicons were sized on an agarose gel following 30 cycles of PCR amplification using a Taq polymerase from Qiagen, a melting
temperature of 58°C, and 50 ng of template. The melting temperatures (Tm) and Cq values were determined by quantitative PCR on a LightCycler 480 Instrument (Roche) as detailed in the main text and on 5 ng of genomic DNA.
#
means that primers span an exon-exon boundary. Alignments of
complementary and genomic DNA sequences can be found for Actin, GAPDH, and EF1a in Additional file 3.
Table 3 Ranking and values for expression stability of potential reference genes in locust neural tissues
NormFinder geNorm
All 8 genes Without 18SrRNA and Actin All 8 genes Without 18SrRNA and Actin Actin+18SrRNA (0.030)a Arm+EF1a (0.038)a Actin+EF1a (0.100)a Arm+EF1a (0.163)a
Actin (0.036) EF1a (0.051) 18SrRNA (0.114) GAPDH (0.191)
EF1a (0.044) AnnIX (0.075) Arm (0.133) AnnIX (0.208)
18SrRNA (0.054) Arm (0.079) AnnIX (0.163) RpL32 (0.224)
Arm (0.069) RpL32 (0.079) RpL32 (0.180) SDHa (0.237)
RpL32 (0.071) SDHa (0.082) GAPDH (0.195) AnnIX (0.073) GAPDH (0.083) SDHa (0.212) GAPDH (0.077)
SDHa (0.081)
Rankings are based on individual values and average values by stepwise exclusion for NormFinder and geNorm, respectively.a
The best combination of two reference genes in terms of a paired stability value. In NormFinder, the best paired stability value is determined from the gene with the best individual stability value in combination with another gene. In geNorm, the best paired stability value is reached after stepwise exclusion of the least stable genes. Increasing values indicate decreasing stability.
In this study, we identified eight appropriate reference genes that show invariant expression in neural tissue of the Australian plague locust, whether reared in a solitary state or exposed to different durations of crowding. All of the genes we evaluated were classified as stably expressed as each presented with geNorm stability indexes well below the cut-off of 1.5 [23]. In this study, we provide a comprehensive assessment of these refer-ence genes for use in subsequent RT-qPCR assays.
Amongst the eight candidate housekeeping genes eval-uated, Actin and EF1a were selected as the most stable pair by both geNorm and NormFinder. Although Van-desompele et al. [23] recommend the use of at least three reference genes for reliable normalization, the pairwise variation analysis in geNorm indicated that there is no need to include more than two genes. If we assume that stability is likely to be consistent across locust species, our results may serve as a posteriori vali-dation of the use of Actin as a reference gene in pre-vious studies of rearing density effect on locust gene expression patterns [5,6,8]. When comparing our results to the study of reference genes in brains of the desert locust, S. gregaria [31], we see that EF1a was also vali-dated as stable with age in brains of fifth- instar nymphs and adults of the desert locust, S. gregaria. In contrast, Actin was excluded for normalization of transcriptional studies in brains of ageing adults. Interestingly, despite being amongst the most abundant proteins in all eukar-yotic cells, with key roles in cell motility and cytoskele-ton maintenance, Actins have been shown to vary in transcript levels with growth and ageing, at least in mammals [21]. The different ranking of the Actin gene across studies underlines the necessity for validation of the candidate reference genes prior to an experiment utilizing different treatments.
The 18S ribosomal subunit was classified as the third most stable gene in our study (Table 3). However, cau-tion should be exercised when using 18SrRNA as a reference control. First, as ribosomal subunits are not polyadenylated they cannot be exploited in purified mRNA samples, i.e. in Reverse-Transcriptase reactions primed with oligo-dT. This was addressed in this experi-ment by using random hexamer primers only. Second, the high abundance of rRNA molecules compared with target mRNA transcripts, as revealed here by relatively low Cq values for 18SrRNA, makes it difficult to sub-tract the baseline value in fluorescence data analysis [23]. In the present study, accurate fluorescence treat-ment was only possible by a large dilution of the RT-qPCR template (i.e. 100-fold, equivalent of 0.25 ng total RNA). Furthermore, because 18SrRNA is so abundant, representing up to 80% of cellular RNA, it is expected that variations from sample-to-sample in initial sample amount, mRNA recovery and integrity, and reverse
transcription efficiency, will be more difficult to detect. Furthermore, 18SrRNA is likely to experience RT-qPCR kinetics that are different to those of less abundantly expressed genes [37]. As a consequence of these factors, 18S rRNA can reduce the sensitivity to detect variation in relative levels of expression [38]. Because it is more likely to be expressed at a comparable order of magni-tude as the investigated targets, we suggest that Arm will be a best suitable third normalizer in gene expres-sion studies of locust neural tissues that address either the initiation or the maintenance of phase differences.
In our study, the two least stable genes were GAPDH and SDHa that code for the metabolic pathways enzymes, glycolysis and citrate cycle, respectively. Kristensen et al. [39] showed in Drosophila melanogaster that genes involved in metabolic processes are differen-tially expressed in response to heat stress. In particular, both glyceraldehyde 3 phosphate and succinate dehydro-genases were down-regulated at 36°C versus 25°C. This indicates that housekeeping metabolism is a dynamic process that can be regulated under different physiologi-cal states, thus challenging the usefulness of genes involved in metabolic processes in normalization. Crowded conditions themselves might be predicted to impose physiological stresses that can affect gene tran-scription. Accordingly, heat shock proteins, which are synthesized in response to stress in insects and act as molecular chaperones to mediate numerous cellular functions, have been shown to be up-regulated in heads of crowded gregarious phase migratory locusts [7].
RT-qPCR reactions showed a linear concentration-dilution relationship and were highly efficient, as every cycle of reaction amplification increased the amount of DNA template by 1.90-2 fold. The two exceptions were Armadillo and Actin primer pairs which respectively showed a moderate and low 1.81 and 1.66 fold increase per cycle. An exponential amplification of 2 (±10%), as retrieved for most of primer pairs, is needed when using the delta-delta-Cq quantification model as originally described by Livak and Schmittgen [40]. However, the most common efficiency-corrected methods currently in use for relative quantification [41] do not assume that all targets amplify with the same optimal PCR efficiency. Instead, efficiencies must be calculated prior to quantifi-cation, be reproducible and preferably be validated in each target gene RT-qPCR run. Our reaction efficiencies were shown to be reproducible, and therefore should be the same between standards and all of the samples in each of the future qPCR assays. However, we suggest to adopt the more conservative approach of avoiding low efficiency primer pairs (i.e. Actin), which would suggest EF1a and Arm as the best combination of two reference genes. These reference genes do not present any risk of misleading gDNA amplification.
We applied the use of EF1a and Arm for accurate normalization in gene expression studies of locust neural tissue by studying the target gene SPARC shown to be up-regulated in gregarious brains of desert locusts. We showed that 24 hours of crowding did not change the expression of SPARC in brains and thoracic ganglia of the Australian plague locust. Similarly, no expression change was detected with longer crowding. Similar results were found when using Actin as sole normalizer following Rahman et al. [8]. The discrepancy in SPARC expression between this and earlier studies may have arisen from other differences in experimental proce-dures; in particular, neural tissues were dissected from 4-5 day old adults in Rahman et al. [8], as opposed to 2-day old 5th-instar nymphs in our study, and SPARC expression is known to be developmentally regulated (reviewed in [42]). We might also expect S. gregaria and C. terminifera to differ in the density-dependence regu-lation of the glycoprotein, as their high density gregar-ious phase express different suites of behavioural [13,14] and morphological traits [43]. However, since the role of the SPARC protein with respect to density-dependent changes in behaviour or any other trait remain unknown, this alternative cannot be examined further as part of this study.
The reference genes we selected for gene expression normalization will provide a promising starting point for further studies of density-dependent transcriptional changes in the Australian plague locust. Now that appropriate primers had been identified for a range of potential reference genes, validation tests for other gene expression studies involving experimental treatments other than rearing density can also be performed in a relatively straightforward manner. Our findings should also facilitate the selection and use of suitable reference genes in the related migratory locust, L. migratoria, as the primers we used target the cDNA sequences of this species too. The possibility also remains that the primer sequences presented in this study are conserved across other members of the Oedipodinae which includes at least seven other species that show elements of density-dependent phase polyphenism [3].
Conclusion
We propose that EF1a and Arm primer pairs evaluated here be used for accurate and reliable normalization of RT-qPCR results in gene expression studies in neural tissues of the Australian plague locust under different rearing density conditions.
Methods
Locust culture and experimental samples
A C. terminifera rearing colony was established in 2006 with approximately 25,000 locusts from north central
Victoria (35°55’S, 144°25’E) and southwestern Western Australia (30°40’S, 116°15’E). The culture has since been maintained under crowded conditions with thousands of egg-pods establishing each generation. As a result, genetic variation among the individuals was recently shown to be substantial at neutral microsatellite loci, with 83% of the alleles and 97% of the gene diversity found in the field being retained in the lab [44]. In this study, we generated expression profiles of the reference gene transcripts from solitarious and gregarious phase locusts that had been reared long term under either iso-lated or crowded conditions, respectively, as well as soli-tarious phase individuals that had been subjected to short-term crowding for 24 hours as described below.
Crowd-reared juveniles were reared from hatching in 30 cm3 steel mesh cages at densities of 200 - 300 locusts comparable to those of outbreaking field populations of C. terminifera [45,46]. First-instar nymphs were collected from the gregarious culture from different cages, each initiated with a minimum of 30 egg-pods, to establish iso-lated-reared cohorts in a separate constant temperature room with the same temperature (32°C) and photoperiod (14:10 L:D) as crowded-reared locusts (see Gray et al. [13] for further details on crowd- and isolated- rearing condi-tions). Behavioural phase change in the Australian plague locust does not accumulate across generations as known to occur in other locust species, but shifts completely within days in response to a change in immediate rearing density [13]. Therefore, we considered 5thinstar isolated nymphs to be fully solitarious, and their comparison to the long-term crowded locusts of similar age can potentially identify genes involved in the maintenance of behavioural differences between the phases. Given that behavioural phase change in C. terminifera begins to occur within just 6 hours of crowding [14], we also included a treatment group of solitarious 5th instar nymphs that had been removed from their individual rearing cages 24 h post-ecdysis and been crowded as described above for only 24 hours to examine the stability of putative reference genes between relatively short versus long-term gregarious phase insects. The three rearing density treatment groups are hereafter referred as to isolated, long-term crowded and 24 h-crowded.
All locusts from each of the three different treatments were removed from their rearing cages the day of their 5thecdysis and marked on the pronotum with correc-tion fluid (Office Max) and coloured ink (Staedtler per-manent Lumocolor) depending on their treatment. All locust neural tissues were dissected the second day of the 5thlarval stage. The brain, optic lobes and the three thoracic ganglia of each insect were dissected with RNAse-free instruments under a binocular microscope and immediately immersed in RNAlater (Ambion). Tis-sue samples from each individual were kept in RNAlater
overnight at 4°C and then stored at -80°C until RNA extraction, which was performed on pooled tissues of 2 males and 2 females. Five replicates of such pooled sam-ples were analyzed for each of the three groups (long-term crowded, isolated, and 24 h-crowded).
Candidate reference genes and primer design
Details on the candidate reference genes examined are given in Table 4. Because no genome or full transcrip-tome sequence data is currently available for C. termini-fera, a first set of primers was developed based on orthologous sequences from different insects, including L. migratoria (EST database LocustDB; [11]) and S. gre-garia [31]. Accession numbers for orthologs and primer sequences are available in Additional file 5. For all study genes except 18SrRNA, PCR products varying in size from 305 to 937 bp were generated from C. terminifera cDNA templates. PCR products obtained from C. termi-nifera gDNA for EF1a, GAPDH, and Actin, were also sequenced to determine exon-intron boundaries (see Additional file 3). We were unable to amplify the other genes of interest, i.e. Arm, RpL32, SDHa, and AnnIX from gDNA, suggesting the presence of large introns. Products for EF1a, GAPDH, and Actin were cloned before sequencing to rule out the presence of multiple loci such has already been reported in some fish and crustaceans [47-49].
RT-qPCR primers were designed from C. terminifera cDNA sequences using Primer3Plus [50] with the ampli-fied fragment length kept between 90 and 175 base pairs (see Table 1 for further details on primer pairs). Para-meters for primer and dimer complementarities were set by default. In order to optimize PCR efficiency, we checked amplicons for secondary structures at the site of primer binding [51] with UNAFold using the DINA-Melt web server [52,53]. Additionally, we avoided stable helix formations both within primer DNA sequences
and internal to the amplicon. Primers were verified for specificity in silico using the L. migratoria transcriptome available at LocustDB [11] and MFEPrimer [54] at default settings. Size and singularity of PCR products was confirmed with gel electrophoresis.
RNA isolation, reverse transcription and qPCR
For the preparation of each total RNA sample, pooled neural tissue (≤ 20 mg) was disrupted and homogenized in 1 ml Trizol (Ambion) using a Tissue Lyser (Qiagen) oper-ating at 25 Hz for 40 s with 7 mm stainless steel beads. The homogenized samples were incubated for 15 minutes at room temperature and then centrifuged at 12,000 g for 10 minutes at 4°C. We decanted off 0.8 ml which was then vigorously mixed with 0.2 ml of chloroform. The RNA-containing upper aqueous phase was recovered after spin-ning at 12,000 g for 20 minutes at 4°C and 0.350 ml was transferred to a Qiagen genomic DNA eliminator spin col-umn. The remaining steps were carried out according to Qiagen’s RNeasy®Plus Mini Kit instructions (i.e. from step 4 in the version from Oct 2005). Eluted total RNA samples were further subjected to a RNase-free DNAse I treatment (Ambion). A combination of on-column and in-solution DNase treatment was used to minimize genomic DNA contamination [51].
First strand cDNA was synthesized from 500 ng total RNA using the Superscript III VILO cDNA Synthesis kit (Invitrogen) with random hexamer primers according to the manufacturer’s protocol. All samples were reverse transcribed together in a single run. We pooled together 5 μl of each cDNA sample to determine reaction effi-ciency of each of the qPCR assays by means of a stan-dard curve consisting of ten-fold diluted samples (equivalent to a range of 0.005 to 5 ng total RNA). Remaining cDNA samples were diluted 20- (for SDHa only) or 100-fold with PCR-grade water (equivalent of 1.25 and 0.25 ng total RNA, respectively).
Table 4 Name, function and GenBank Accession numbers of potential reference genes forC. terminifera
Symbol Name Molecular function GenBank
n°
18SrRNA 18SrRNA Structural constituent of ribosome na
Arm Armadillo Alpha-catenin binding; Cytoskeletal protein binding; Protein binding; Transcription (co)activator activity
HQ388818
EF1a Elongation factor 1 alpha Translation elongation factor activity; GTPase activity; GTP binding HQ388819 RpL32 Ribosomal protein L32 Structural constituent of ribosome HQ388820 GAPDH Glyceraldehyde-3-phosphate
dehydrogenase
Glyceraldehyde-3-phosphate dehydrogenase (phosphorylating) activity; NADH binding
HQ388821
Actin Actin 5C Structural constituent of cytoskeleton; ATP binding; Protein binding HQ388822 SDHa Succinate dehydrogenase Succinate dehydrogenase activity; Succinate-coA ligase activity; FAD binding;
electron carrier activity
HQ388823
AnnIX Annexin IX Actin binding; Calcium ion binding; Calcium-dependent phospholipid binding; Phospholipid binding
HQ388824
Name and Gene Ontology are that of Drosophila melanogaster orthologue (see accession no in Flybase column of the Additional file 5) following http://www. geneontology.org.
Reverse transcription-quantitative PCR was performed in a 384-well block using a LightCycler 480 Instrument (Roche Diagnostics). Every PCR assay contained a final volume of 5μl, including 2.5 μl 2 × SYBR-Green I Master Mix (Roche Diagnostics), 1μl diluted cDNA template, 0.25 to 0.5μl (250 to 500 nM final concentration; see Table 1) of each primer, and nuclease free water. PCR was carried out with an initial 10 min hot start activation of the poly-merase at 95°C followed by 45 cycles of 10 sec denaturation at 95°C, 10 sec annealing at 60°C, and 20 sec extension at 72°C. Melt curve analysis was performed after completion of the thermal PCR program, 55-90°C with increments ris-ing by 0.5°C each step and a 5s hold at each degree. This ensured the resulting fluorescence of PCR products origi-nated from the single PCR product of interest rather than primer dimers or non-specific PCR products. Samples were run in triplicate and standard curves were included in each PCR run. In addition, a no-template control (NTC) was included for each primer pair. We used a Biomek NXP Span-8 Laboratory Automation Workstation (Beckman Coulter) to limit technical errors in pipetting.
Prior to the quantitative PCR assay, PCR cycling was performed on control reactions without reverse transcrip-tase (noRTs) for all cDNA samples and primer pairs. Finally, a gDNA template was also run for each primer pair to determine their sensitivity to gDNA contamination. We used an intentionally large amount of gDNA template (5 ng), equal to that of the least diluted sample of the stan-dard curve (in equivalent of total RNA).
Statistical treatment
The fluorescence data were processed using LightCycler 480 software version 1.5.0 (Roche Diagnostics) with two different methods, namely the absolute quantification fit point and second derivative methods. Because it was highly accurate and reproducible, we hereafter present results from the second derivative method only (details on the fit point method and results can be found in Additional file 6). Quantitative cycles (Cq) are deter-mined from the amplification curve’s second derivative maximum, which corresponds to the point where the acceleration of the fluorescence signal is at its maximum [55]. This method assumes that the curve shape is more predictive of starting concentration than is the cence level of the curve [56]. The background fluores-cence was computed as the arithmetic mean of cycles 2 to 6 and subtracted from the fluorescence values. The mean, standard deviation, and coefficient of variation of the raw triplicate Cq values were determined. For each primer pair, biological samples whose coefficient of var-iation was greater than 1.5% were inspected; a replicate reaction was considered an outlier if it deviated more than one standard deviation from the mean and was excluded from analysis [57].
To identify the optimal normalization genes among our set of candidates, we used software programs, geNorm [23] and NormFinder [24]. Both programs rank the can-didate reference genes according to their expression sta-bility in a given sample set where an increase in the program-designated value correlates with a decrease in gene expression stability. geNorm measures the expres-sion stability of a reference gene as the average pairwise variation for that gene with all other tested reference genes. The program geNorm also calculates the pairwise variation between two sequential normalization factors to determine the optimal number of reference genes required for normalization. A pairwise variation value above 0.15 indicates that the added gene has a significant effect and should preferably be included in the normali-zation. Contrary to geNorm, NormFinder determines the stability of a reference gene based on the experimental design, with top-ranked genes having the least variation accumulated within and between groups (i.e. long-term crowded, isolated, and 24 h-crowded in this study). The gene with the smallest quality value is then selected and its value combined with each of the other genes to pro-duce a stability measure for the combination of two genes. Both tools require the transformation of Cq values to linear scale expression quantities. For each gene, mean Cq values of the 15 biological samples were converted into relative quantities by using the formula E-(Cq[control]
-Cq[sample])
, with E denoting the exponential amplification efficiency (E = 10-(1/-slope of the standard curve)) and the sam-ple with the lowest mean Cq value used as a control [58]. We evaluated the reproducibility of PCR amplification efficiency for all pairs of primers by using constant reac-tion condireac-tions but a different cDNA sample in a differ-ent run plate.
To estimate potential up or down regulation of the SPARC gene in response to our different rearing density treatments, we used the software REST 2009 [59] with 2,000 random pairings of untreated controls (i.e. isola-tion) and treatment samples (i.e. crowding) to calculate confidence intervals and estimate the statistical signifi-cance of calculated expression ratios. The software cal-culates an efficiency-corrected relative quantity for each randomization pair by using the formula E-(Cq[control] -Cq
[sample])
. The expression ratio is then normalized using the geometric average of the relative quantity values for the two most stably-expressed reference genes selected by geNorm and NormFinder.
Additional material
Additional file 1: Formaldehyde agarose gels of the 15 C. terminifera total RNA samples. The sizes of the molecular weight markers are indicated in kilobases (kb). The gel shows two discrete and intense rRNA bands without a leading smear. S1 to S15 refer to the
fifteen samples and Additional file 2 provides details on their purity and concentration.
Additional file 2: Concentration and purity of the 15 C. terminifera total RNA samples.
Additional file 3: Aligned DNA sequences from genomic (CtA23) and total RNA (Ct3A) templates for GAPDH, Actin, and EF1a. The primer sequences for RT-qPCR are also provided. Amongst the 10 cloned PCR products, sequence variants that differed by a single nucleotide change were considered to result from artificial substitutions due to mis-incorporation during the PCR process. Indeed, by considering an error rate for the Pfu polymerase of 2 × 10⁻⁶per bp per duplication [60-62],
the maximum expected numbers of bp changes per independent PCR was 0.08 for 35 cycles of PCR amplification (i.e. assuming a length of 1151 bp, which is that of the Actin gDNA sequence). Based on this error rate, we should expect no more than one mutation due to PCR mis-incorporation among 10 cloned sequences.
Additional file 4: Determination of the optimal number of reference genes required for normalization using geNorm. The program calculates the pairwise variation (V) between two sequential normalization factors (in x-axis). V2/3 indicates the variation in the normalization factor using two versus three genes. A large pairwise variation V indicates that the added gene has a significant effect and should preferably be included in the normalization. Vandesompele et al. [23] suggest that the cut-off value for such significance should be 0.15. Additional file 5: Primer sequences and accession numbers of orthologs used for generation of amplicons. LocustDB no are unigene sequences from L. migratoria. All C. terminifera cDNA sequences from reference genes are deposited in GenBank (see Table 4). Additional file 6: Results using the fit point method for estimating quantitative cycles.
Acknowledgements
A Marie-Curie Outgoing Fellowship within the Sixth European Community Framework Programme supported MPC and funded this work. GAS and SJS were supported by an ARC Discovery Project grant. We are very grateful to Angela Ho for help in using the automated pipetting station and advice on RT-qPCR assays.
Author details
1School of Biological Sciences, University of Sydney, Sydney, NSW 2006,
Australia.2Centre de coopération internationale en recherche agronomique pour le développement Acridologie, TA A-50/D, F-34398, Montpellier, France.
3
Centre de Biologie et de Gestion des Populations, INRA, Campus International de Baillarguet CS 30016, 34988 Montferrier/Lez, France.
4
Department of Entomology, Texas A&M University, College Station, TX 77842-2475 USA.
Authors’ contributions
The study was conceived and coordinated by GAS, MPC and SJS. MPC, DTE and GAS designed the experimental protocol. TD reared the locusts with the help of MPC. DTE performed the dissections. MPC selected the reference genes and, designed and tested the primers used for gene sequencing and for RT-qPCR assays. DC participated in the design of primers used for sequencing. LB cloned and sequenced PCR products of Actin, EF1a, and GAPDH. MPC performed the RT-qPCRs and carried out the statistical analyses. FP gave valuable expertise in RT-qPCR analyses. MPC wrote the manuscript with help from GAS. DTE, FP and SJS made significant comments on the manuscript. All authors read and approved the final manuscript.
Received: 13 October 2010 Accepted: 16 February 2011 Published: 16 February 2011
References
1. Simpson SJ, Sword GA: Phase polyphenism in locusts: Mechanisms, population consequences, adaptive significance and evolution. In
Phenotypic Plasticity of Insects: Mechanisms and Consequences. Edited by: Whitman D, Ananthakrishnan T. Science Publishers, Inc., Plymouth; 2009:147-190.
2. Applebaum SW, Heifetz Y: Density-dependent physiological phase in insects. Annual Review of Entomology 1999, 44:317-341.
3. Pener MP, Simpson SJ: Locust Phase Polyphenism: An Update. Advances in Insect Physiology 2009, 36:1-272.
4. Collett M, Despland E, Simpson SJ, Krakauer DC: The spatial scales of locust gregarisation. Proceedings of the National Academy of Sciences, USA 1998, 95:13052-13055.
5. Simonet G, Claeys I, Breugelmans B, Van Soest S, De Loof A, Vanden Broeck J: Transcript profiling of pacifastin-like peptide precursors in crowd- and isolated-reared desert locusts. Biochemical and Biophysical Research Communications 2004, 317(2):565-569.
6. Sas F, Begum M, Vandersmissen T, Geens M, Claeys I, Van Soest S, Huybrechts J, Huybrechts R, De Loof A: Development of a real-time PCR assay for measurement of yellow protein mRNA transcription in the desert locust Schistocerca gregaria: A basis for isolation of a peptidergic regulatory factor. Peptides 2007, 28(1):38-43.
7. Wang HS, Wang XH, Zhou CS, Huang LH, Zhang SF, Guo W, Kang L: cDNA cloning of heat shock proteins and their expression in the two phases of the migratory locust. Insect Molecular Biology 2007, 16(2):207-219. 8. Rahman MM, Vandingenen A, Begum M, Breuer M, De Loof A,
Huybrechts R: Search for phase specific genes in the brain of desert locust, Schistocerca gregaria (Orthoptera: Acrididae) by differential display polymerase chain reaction. Comparative Biochemistry and Physiology a-Molecular & Integrative Physiology 2003, 135(2):221-228. 9. Liang P, Pardee AB: Differential display of eukaryotic messenger RNA by
means of the polymerase chain reaction. Science 1992, 257(5072):967-971. 10. Kang L, Chen X, Zhou Y, Liu B, Zheng W, Li R, Wang J, Yu J: The analysis of
large-scale gene expresion correlated to the phase changes of the migratory locust. Proceedings of the National Academy of Sciences USA 2004, 101(51):17611-17615.
11. Ma Z, Yu J, Kang L: LocustDB: a relational database for the transcriptome and biology of the migratory locust (Locusta migratoria). BMC Genomics 2006, 7:11.
12. De Loof A, Claeys I, Simonet G, Verleyen P, Vandersmissen T, Sas P, Huybrechts J: Molecular markers of phase transition in locusts. Insect Science 2006, 13:3-12.
13. Gray LJ, Sword GA, Anstey ML, Clissold FJ, Simpson SJ: Behavioural phase polyphenism in the Australian plague locust (Chortoicetes terminifera). Biology Letters 2009, 5(3):306-309.
14. Cullen DA, Sword GA, Dodgson T, Simpson SJ: Behavioural phase change in the Australian plague locust, Chortoicetes terminifera, is triggered by tactile stimulation of the antennae. Journal of Insect Physiology 2010, 56(8):937-42.
15. Uvarov BP: In Grasshoppers and Locusts. Volume 1. Cambridge, Cambridge University Press; 1966.
16. Song H: On the origin of the desert locust Schistocerca gregaria (Forskäl) (Orthoptera: Acrididae: Cyrtacanthacridinae). Proc R Soc Lond B 2004, 271:1641-1648.
17. Lovejoy NR, Mullen SP, Sword GA, Chapman RF, Harrison RG: Ancient trans-Atlantic flight explains locust biogeography: molecular phylogenetics of Schistocerca. Proceedings of the Royal Society of London Serie B 2005, 273:767-774.
18. Dheda K, Huggett JF, Bustin SA, Johnson MA, Rook G, Zumla A: Validation of housekeeping genes for normalizing RNA expression in real-time PCR. Biotechniques 2004, 37(1):112.
19. Bustin SA, Benes V, Garson JA, Hellemans J, Huggett J, Kubista M, Mueller R, Nolan T, Pfaffl MW, Shipley GL, et al: The MIQE Guidelines: Minimum Information for Publication of Quantitative Real-Time PCR Experiments. Clinical Chemistry 2009, 55(4):611-622.
20. Thellin O, Zorzi W, Lakaye B, De Borman B, Coumans B, Hennen G, Grisar T, Igout A, Heinen E: Housekeeping genes as internal standards: use and limits. Journal of Biotechnology 1999, 75(2-3):291-295.
21. Ruan WJ, Lai MD: Actin, a reliable marker of internal control? Clinica Chimica Acta 2007, 385(1-2):1-5.
22. Nolan T, Hands RE, Bustin SA: Quantification of mRNA using real-time RT-PCR. Nature Protocols 2006, 1(3):1559-1582.
23. Vandesompele J, De Preter K, Pattyn F, Poppe B, Van Roy N, De Paepe A, Speleman F: Accurate normalization of real-time quantitative RT-PCR
data by geometric averaging of multiple internal control genes. Genome Biology 2002, 3(7).
24. Andersen CL, Jensen JL, Orntoft TF: Normalization of real-time quantitative reverse transcription-PCR data: A model-based variance estimation approach to identify genes suited for normalization, applied to bladder and colon cancer data sets. Cancer Research 2004,
64(15):5245-5250.
25. Lourenco AP, Mackert A, Cristino AD, Simoes ZLP: Validation of reference genes for gene expression studies in the honey bee, Apis mellifera, by quantitative real-time RT-PCR. Apidologie 2008, 39(3):372-U333. 26. Scharlaken B, de Graaf DC, Goossens K, Brunain M, Peelman LJ, Jacobs FJ:
Reference gene selection for insect expression studies using quantitative real-time PCR: The head of the honeybee, Apis mellifera, after a bacterial challenge. Journal of Insect Science 2008, 8.
27. Lord JC, Hartzer K, Toutges M, Oppert B: Evaluation of quantitative PCR reference genes for gene expression studies in Tribolium castaneum after fungal challenge. Journal of Microbiological Methods 2010, 80(2):219-221.
28. Wang G, Xia Q, Cheng D, Duan J, Zhao P, Chen J, Zhu L: Reference genes identified in the silkworm Bombyx mori during metamorphism based on oligonucleotide microarray and confirmed by qRT-PCR. Insect Science 2008, 15(5):405-413.
29. Hornakova D, Matouskova P, Kindl J, Valterova I, Pichova I: Selection of reference genes for real-time polymerase chain reaction analysis in tissues from Bombus terrestris and Bombus lucorum of different ages. Analytical Biochemistry 2010, 397(1):118-120.
30. Jiang H, Liu Y, Tang P, Zhou A, Wang J: Validation of endogenous reference genes for insecticide-induced and developmental expression profiling of Liposcelis bostrychophila (Psocoptera: Liposcelididae). Molecular Biology Reports 2010, 37(2):1019-1029.
31. Van Hiel MB, Van Wielendaele P, Temmerman L, Van Soest S, Vuerinckx K, Huybrechts R, Broeck JV, Simonet G: Identification and validation of housekeeping genes in brains of the desert locust Schistocerca gregaria under different developmental conditions. Bmc Molecular Biology 2009, 10. 32. Schwarzbauer JE, Spencer CS: The caenorhabditis elegans homolog of the
extracellular calcium-binding protein SPARC/osteonectin affects nematode body morphology and mobility. Molecular Biology of the Cell 1993, 4(9):941-952.
33. Hynes RO, Zhao Q: The evolution of cell adhesion. Journal of Cell Biology 2000, 150(2):F89-F95.
34. Furlong EEM, Andersen EC, Null B, White KP, Scott MP: Patterns of gene expression during Drosophila mesoderm Development. Science 2001, 293(5535):1629-1633.
35. Ishikawa H: Evolution of ribosomal RNA. Comparative Biochemistry and Physiology B-Biochemistry & Molecular Biology 1977, 58(1):1-7. 36. Ott SR, Rogers SM: Gregarious desert locusts have substantially larger
brains with altered proportions compared with the solitarious phase. Proc R Soc Lond B 2010.
37. Bustin SA: Absolute quantification of mRNA using real-time reverse transcription polymerase chain reaction assays. Journal of Molecular Endocrinology 2000, 25(2):169-193.
38. Nicot N, Hausman JF, Hoffmann L, Evers D: Housekeeping gene selection for real-time RT-PCR normalization in potato during biotic and abiotic stress. Journal of Experimental Botany 2005, 56(421):2907-2914. 39. Kristensen TN, Sorensen P, Pedersen KS, Kruhoffer M, Loeschcke V:
Inbreeding by environmental interactions affect gene expression in Drosophila melanogaster. Genetics 2006, 173(3):1329-1336.
40. Livak KJ, Schmittgen TD: Analysis of relative gene expression data using real-time quantitative PCR and the 2(-Delta Delta C(T)) Method. Methods 2001, 25(4):402-408.
41. Pfaffl MW: A new mathematical model for relative quantification in real-time RT-PCR. Nucleic Acids Research 2001, 29(9).
42. Brekken RA, Sage EH: SPARC, a matricellular protein: at the crossroads of cell-matrix. Matrix Biology 2000, 19(7):569-580.
43. Uvarov BP: In Grasshoppers and Locusts. Volume 2. Centre for Overseas Pest Research, London, UK; 1977.
44. Berthier K, Chapuis MP, Simpson SJ, Ferenz HJ, Habib Kane CM, Kang L, Lange A, Ould Babah MA, Rodenburg KW, Rogers S, et al: Laboratory populations as a resource for understanding the relationship between genotypes and phenotypes: A global case study in locusts. Advances in Insect Physiology 2010, 39:1-37.
45. Clark LR: Behaviour of swarm hoppers of the Australian plague locust (Chortoicetes terminifera Walk.). CSIRO Bulletin 1949, 245:1-27.
46. Hunter DM: Advances in the control of locusts (Orthoptera: Acrididae) in eastern Australia: from crop protection to preventive control. Australian Journal of Entomology 2004, 43:293-303.
47. Olsvik PA, Lie KK, Jordal AEO, Nilsen TO, Hordvik I: Evaluation of potential reference genes in real-time RT-PCR studies of Atlantic salmon. Bmc Molecular Biology 2005, 6.
48. Goetze E: Elongation factor 1-alpha in marine copepods (Calanoida: Eucalanidae): Phylogenetic utility and unique intron structure. Molecular Phylogenetics and Evolution 2006, 40(3):880-886.
49. Infante C, Matsuoka MP, Asensio E, Canavate JP, Reith M, Manchado M: Selection of housekeeping genes for gene expression studies in larvae from flatfish using real-time PCR. Bmc Molecular Biology 2008, 9. 50. Rozen S, Skaletsky HJ: Primer3 on the www for general users and for
biologist programmers. In Bioinformatics Methods and Protocols: Methods in Molecular Biology. Edited by: Krawetz S, Misener S. Humana Press, Totowa, NJ; 365-386.
51. Peters IR, Helps CR, Hall EJ, Day MJ: Real-time RT-PCR: considerations for efficient and sensitive assay design. Journal of Immunological Methods 2004, 286(1-2):203-217.
52. Markham NR, Zuker M: DINAMelt web server for nucleic acid melting prediction. Nucleic Acids Research 2005, 33:W577-W581.
53. Markham NR, Zuker M: UNAFold: software for nucleic acid folding and hybriziation. Bioinformatics, Volume II. Structure, Function and Applications. In Methods in Molecular Biology. Volume 453. Edited by: Keith JM. Humana Press, Totowa, NJ; 2008:(chapter 1):3-31, ISBN 978-1-60327-428-9.
54. Qu WB, Shen ZY, Zhao DS, Yang Y, Zhang CG: MFEprimer: multiple factor evaluation of the specificity of PCR primers. Bioinformatics 2009, 25(2):276-278.
55. Rasmussen R: Quantification on the LightCycler.Edited by: Meuer S, Wittwer C, Nakagawara K. Rapid Cycle Real-time PCR, Methods and Applications SPringer Press, Heidelberg; 2001:21-34.
56. Durtschi JD, Stevenson J, Hymas W, Voelkerding KV: Evaluation of quantification methods for real-time PCR minor groove binding hybridization probe assays. Analytical Biochemistry 2007, 361(1):55-64. 57. Lee JM, Roche JR, Donaghy DJ, Thrush A, Sathish P: Validation of reference
genes for quantitative RT-PCR studies of gene expression in perennial ryegrass (Lolium perenne L.). Bmc Molecular Biology 2010, 11. 58. Hellemans J, Mortier G, De Paepe A, Speleman F, Vandesompele J: qBase
relative quantification framework and software for management and automated analysis of real-time quantitative PCR data. Genome Biology 2007, 8(2):R19.
59. Pfaffl MW, Horgan GW, Dempfle L: Relative expression software tool (REST (c)) for group-wise comparison and statistical analysis of relative expression results in real-time PCR. Nucleic Acids Research 2002, 30(9). 60. Lundberg KS, Shoemaker DD, Adams MWW, Short JM, Sorge JA, Mathur EJ:
High-fidelity amplification using a thermostable DNA-polymerase isolated from Pyrococcus furiosus. Gene 1991, 108(1):1-6.
61. Cline J, Braman JC, Hogrefe HH: PCR fidelity of Pfu DNA polymerase and other thermostable DNA polymerases. Nucleic Acids Research 1996, 24(18):3546-3551.
62. Flaman JM, Frebourg T, Moreau V, Charbonnier F, Martin C, Ishioka C, Friend SH, Iggo R: A rapid PCR fidelity assay. Nucleic Acids Research 1994, 22(15):3259-3260.
doi:10.1186/1471-2199-12-7
Cite this article as: Chapuis et al.: Assessment and validation of a suite of reverse transcription-quantitative PCR reference genes for analyses of density-dependent behavioural plasticity in the Australian plague locust. BMC Molecular Biology 2011 12:7.