Large-scale organization of carbon dioxide discharge in the Nepal Himalayas
Texte intégral
Figure


Documents relatifs
Sankrityayan (TMSV: 69) On 1 December 1934, during Sankrityayan’s visit to Kathmandu on his way back to India from his second visit to Tibet, Dharmaman Sahu introduced him to
Relationships between measured pCO 2 and surface water quality variables according to the different land uses sampled during the field campaigns: streams draining forests,
Annual dissolved fluxes from Central Nepal rivers: budget of chemical erosion in the Himalayas.. Christian France-Lanord, Matthew Evans, Jean-Emmanuel Hurtrez,
HAdV type detected in wastewater and surface water is enteric type HAdV41 which
It may thus be inferred that these clusters following the southern bound- ary of the Higher Himalayas of Nepal, mark the tip of the aseismic slip zone beneath the Higher Himalayas
After 150 simulations, to explore the influence of northern and southern flat geometry, the dip of the ramp, and the variation in friction ratio along the MHT, the final solutions
[ 40 ] This model offers a good representation of the self- potential data using values of the coupling parameters that have been determined independently. Nevertheless, the estimate
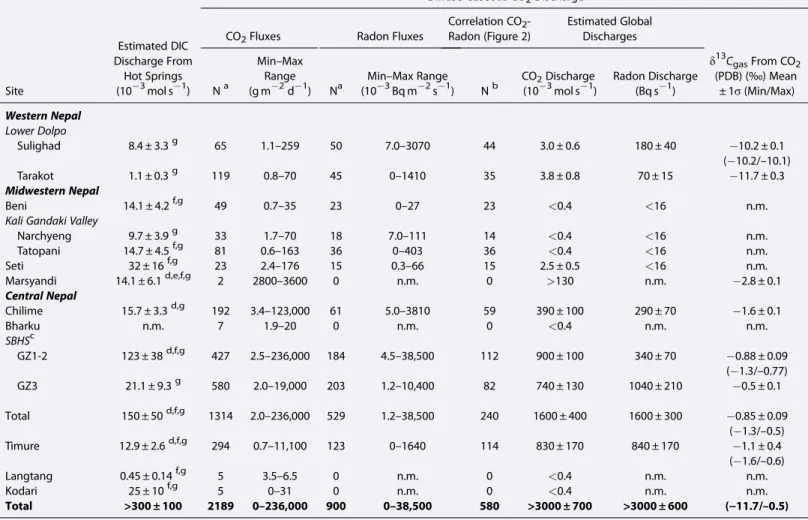
Total CO 2 and Radon Discharge in the SBHS Over the period 2007 – 2011, CO 2 fl ux, radon fl ux, radon concentration, SP, and carbon isotopic ratio measurements were found to
