HAL Id: cirad-03014054
http://hal.cirad.fr/cirad-03014054
Submitted on 19 Nov 2020
HAL is a multi-disciplinary open access
archive for the deposit and dissemination of
sci-entific research documents, whether they are
pub-lished or not. The documents may come from
teaching and research institutions in France or
abroad, or from public or private research centers.
L’archive ouverte pluridisciplinaire HAL, est
destinée au dépôt et à la diffusion de documents
scientifiques de niveau recherche, publiés ou non,
émanant des établissements d’enseignement et de
recherche français ou étrangers, des laboratoires
publics ou privés.
Ecosystem services and social equity: Who controls, who
benefits and who loses?
Vallet A., Locatelli B., Pramova E.
To cite this version:
Vallet A., Locatelli B., Pramova E.. Ecosystem services and social equity: Who controls, who benefits
and who loses?. 2020, �10.17528/cifor/007849�. �cirad-03014054�
Améline Vallet1,2, Bruno Locatelli3,4 and Emilia Pramova3
1 Ecologie Systématique Evolution, AgroParisTech, CNRS, Université Paris-Sud, Université Paris-Saclay
2 CIRED, AgroParisTech, CIRAD, CNRS, EHESS, Ecole des Ponts ParisTech, Université Paris-Saclay
3 CIFOR
4 CIRAD, Forests and Societies, University of Montpellier
Key messages
• Stakeholders have different roles in the co-production of ecosystem services, e.g. they can be direct or indirect managers or beneficiaries.
• There are mismatches between those who manage and those who depend on or benefit from ecosystem services. • Different forms of inequities are tied to these roles and can threaten the resilience of socio-ecological systems. • Power asymmetries influence stakeholders’ roles in relation to ecosystem services, including their participation in
ecosystem services governance.
• Insights into roles, power and inequities can be useful for designing participatory governance mechanisms.
Ecosystems of living organisms and abiotic components produce ecosystem services through a complex web of relationships. But there are also ‘management ecosystems’, which are networks of stakeholders involved in the production and delivery of ecosystem services benefits through both competition and cooperation. As in any ecosystem, each entity affects and is affected by the others in a constantly evolving relationship.
Different ecosystem services
stakeholders and their roles:
Exploring inequity
Healthy ecosystems such as forests, grasslands and estuaries help regulate storm water flows and drinking water supplies, support the pollination of crops, stabilize soil and provide timber, food and medicinal plants. Collectively, these benefits are known as ‘ecosystem services’ (ES).
Who controls, who benefits and who loses?
Taking into account ES is important for public policy making because ecosystems contribute significantly to human well-being. It is also essential to understand trade-offs among ES for landscape planning and management (Mastrángelo et al. 2019). A trade-off situation occurs if a gain in one quality, quantity or property implies a loss of other aspects. In simpler terms, for ES, it means that the increase of one service can happen at the cost (direct or indirect) of another service (Vallet et al. 2018). For example, in Peru, afforestation with exotic species such as pine or eucalyptus generates timber and income for rural dwellers, but decreases water resources (Bonnesoeur et al. 2019). This calls for integrated landscape management, taking into account multiple ES and their trade-offs.
Sustainable development pathways with economic, environmental and societal outcomes are both desirable and attractive in theory, but in practice, these win–win narratives are difficult to achieve because of the existence of trade-offs (Vallet 2018).
When decision-makers, planners and scientists do consider trade-offs, they usually focus on the biophysical dimensions of trade-offs, such as space (e.g. between upstream and downstream watershed communities) or provision of different ES (e.g. trade-offs between carbon sequestration and water regulation) (Vallet 2018; Martín-López et al. 2019).
No. 20
No. 307
November 2020
2
What about the trade-offs between the well-being of different stakeholders related to ES? For example, what about those between people managing ecosystems and people benefiting from ES, including marginalized and excluded groups, or between men and women? These are seldom explored, and nor are the different roles that people hold in relation to managing, regulating and benefiting from ES (Mathez-Stiefel et al. 2017). Trade-offs between different ES, and between the well-being of different stakeholder groups, do not only occur because of the natural processes related to ES production. They also occur because of the human interventions needed for co-producing the benefits that we derive from ES (Lavorel et al. 2020). Co-production means that, in most cases, nature does not automatically serve us these benefits. We need to administer technology, knowledge, financial capital or other forms of direct and indirect management to ecosystems in order to reap them (Bruley et al. 2020).
In this process, who controls, who manages and who benefits from ES? These are important questions to explore. The power to influence and manage ES is often poorly shared with the groups that depend on, or benefit from, ecosystems. Such inequities can create conflicts and threaten the resilience of both ecosystems and communities.
A framework to analyze the role of
stakeholders
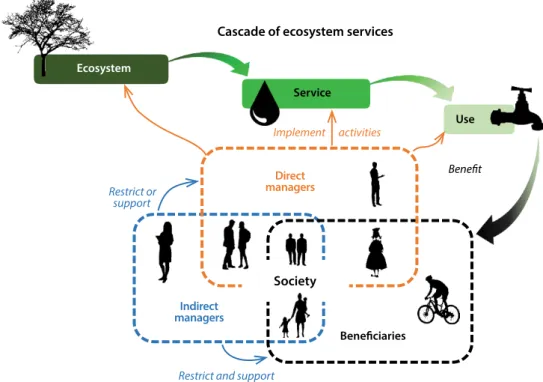
We developed a straightforward analytical framework to explore these questions (Figure 1) and applied it to a case study in the Mariño watershed of Peru. Our framework builds on the idea of the ES cascade and can be applied to real-life situations in different contexts. The ES cascade is similar to a value chain: it illustrates the pathway that goes from ecological structures and processes at one end to the well-being of people at the other (Fedele et al. 2017).
We considered two types of interactions within the cascade: (1) management activities that contribute to the flow of ES and related benefits, and (2) benefits received by stakeholders. We further classified management activities into indirect and direct ones. Direct human interventions such as planting trees, building infrastructure and collecting products are only one facet of ES management, which can also be influenced indirectly by stakeholders controlling, sanctioning or incentivizing certain actions. In other words, direct managers affect the functioning of ecosystems and the services provided to society, while indirect managers facilitate and restrict the activities of direct managers or control the use of (and thus the benefits derived from) ES.
Figure 1. Analytical framework with two forms of ecosystem services management (direct and indirect), which can occur at three steps of the ecosystem service cascade (ecosystem, service, use).
Implement activities
Benefit
Restrict or support
Restrict and support
Indirect managers Direct managers Society Beneficiaries
Cascade of ecosystem services
Ecosystem
Service
Case study and methods
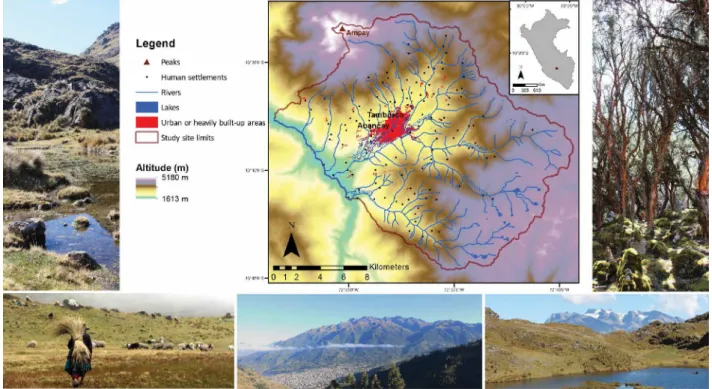
The Mariño watershed (Figure 2) stretches over 300 km2 along
the eastern slopes of the Southern Peruvian Andes, in the region of Apurimac – one of the poorest regions in the country. Approximately 70,000 people live in the watershed, mostly in two urban areas, Abancay and Tamburco. Agriculture at high and mid
elevations is subsistence oriented, whereas at low elevations both crop and livestock farming are commercially oriented and more intensive. There are also tourism activities in the Ampay Forest Sanctuary, which protects 3635 ha of land. Like other mountain social-ecological systems, the Mariño watershed provides
important but vulnerable ES that contribute substantially to human well-being in the lowlands and highlands (Locatelli et al. 2017).
Figure 2. Map and pictures of the case study area.
Photos and map: Améline Vallet
Figure 3. The eight ecosystem services prioritized by local stakeholders: two provisioning services (orange text), five regulating services (blue text) and one cultural service (purple text).
No. 20
No. 307
November 2020
4
We first organized several workshops with local stakeholders to identify the important ES and the key institutions and stakeholder groups in the area. Participants prioritized eight important ES (Figure 3). We then conducted semistructured interviews. We asked the representatives of 52 different institutions and stakeholder groups questions concerning their ES activities, how they benefit from them and how they directly or indirectly manage them (if at all). We used this information to map and analyze the different stakeholder roles along the ES cascade.
We also asked the interviewees to identify with which actors they interacted in relation to the eight ES. We used this information to construct the social networks and to gain a better understanding of the power asymmetries. We used tools commonly applied to SNA to compare stakeholder groups in the networks or to explain the formation of ties between stakeholders. The detailed methodology, the semistructured interview guide and the qualitative results for all eight ES can be found in the related open-access journal articles (Vallet et al. 2019, 2020).
Mismatches between those who
benefit and those who manage
We found that the groups that depended on or benefited from ES were not necessarily involved in their management. For example, beneficiaries of global climate regulation were rural and urban populations, local businesses (fish farms, tourism, agribusinesses) as well as several public institutions. However, those active in mitigating climate change were mainly the NGOs and public environmental institutions (through afforestation, reforestation and emission reduction programs). Direct managers were mostly local stakeholders, businesses and civil society, whereas indirect managers were often national-level organizations and other public sector groups (facilitating or restricting direct management and use). For example, direct managers of medicinal plants were rural dwellers who harvested, transported and sold medicinal plants in the city markets, or who cultivated plant species in their fields. On the other hand, indirect managers were the public institutions in charge of controlling and sanctioning activities related to wild flora or protected areas. For most ES, groups involved in direct ES management were likely to be beneficiaries as well. For example, farmers who directly managed agricultural production and thus co-produced these ES benefited from the agricultural products through trade and income generation.
Stakeholders involved in the first step of the cascade, i.e. the ecosystem level, had the most control over the benefits received at the last step, i.e. the benefit level. For example,
farmers managing agricultural production by planting and cultivating crops (ecosystem and service levels) influenced the quantity of food available to consumers. But this influence only related to the quantity or quality of the ES, and not to the distribution aspects (i.e. who could receive these benefits). Similarly, farmers and communities were powerful in influencing land management and the water supply (e.g. through
reforesting and protecting wetlands), but were powerless in deciding the allocation of water use among various users. On the contrary, the National Water Authority (ANA) was powerless in terms of land management, but powerful in controlling and authorizing water consumption.
Water ES were particularly tied to such equity and justice issues. In the Mariño watershed, water is predominantly channeled downstream to urban areas by EMUSAP, the local drinking water service provider licensed by ANA. In the river downstream from the Rontococcha dam (eastern part of the watershed), water extraction for the city resulted in water scarcity for other uses, for example, agriculture. This led to conflicts between upland and lowland farming communities around access to water. Downstream farmers were also troubled by water quality issues, as the little water that reached their fields was contaminated by the city.
These insights can serve as the basis for discussing more equitable ES management in a particular area. For example, they can be used in the discussions related to the proposed payment scheme for water ES in the watershed. The scheme can potentially offer opportunities for collective action, direct participation and coordination between diverse stakeholders. The different roles that stakeholders play in the ES cascade, and the associated inequities and power asymmetries can be explained by stakeholders’ differentiated rights and entitlements, access to resources and other capital, and constraints tied to location, institutions and social norms. Power asymmetries can also be explained by the formal or informal relationships among stakeholders.
Social network analysis to highlight
power asymmetries and related
conflicts
We conducted a social network analysis (SNA) to gain further insight into the power relationships among ES managers and beneficiaries. The main objectives of SNA are to map and measure the relationships (relational ties) that connect individuals or organizations (actors) into a network, and to identify key and isolated actors or groups (Di Gregorio et al. 2019). It examines and explains power based on actor positions in a particular network. For example, actors who are at the center of communication or knowledge-sharing networks
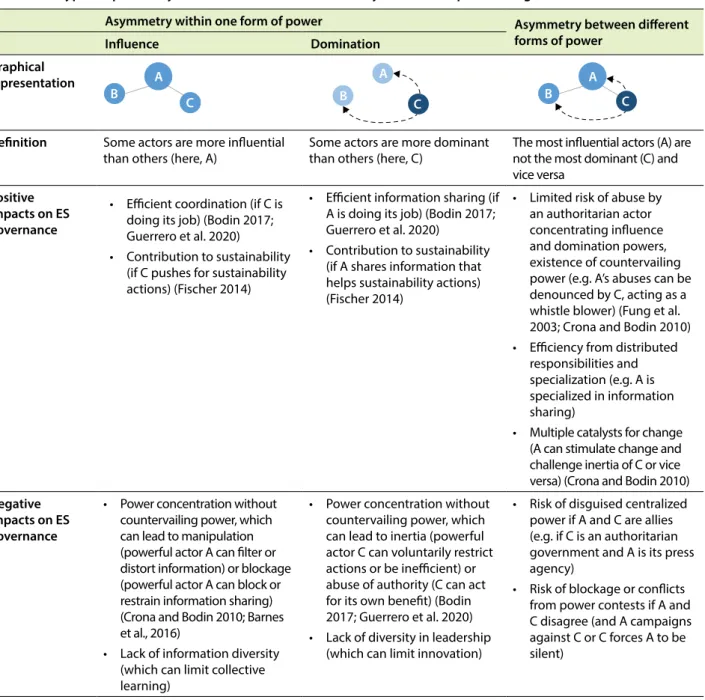
Table 1. Two types of power asymmetries considered in the study and their impact on ES governance.
Asymmetry within one form of power Asymmetry between different forms of power
Influence Domination Graphical
representation
Definition Some actors are more influential
than others (here, A) Some actors are more dominant than others (here, C) The most influential actors (A) are not the most dominant (C) and vice versa
Positive impacts on ES governance
• Efficient coordination (if C is doing its job) (Bodin 2017; Guerrero et al. 2020)
• Contribution to sustainability (if C pushes for sustainability actions) (Fischer 2014)
• Efficient information sharing (if A is doing its job) (Bodin 2017; Guerrero et al. 2020)
• Contribution to sustainability (if A shares information that helps sustainability actions) (Fischer 2014)
• Limited risk of abuse by an authoritarian actor concentrating influence and domination powers, existence of countervailing power (e.g. A’s abuses can be denounced by C, acting as a whistle blower) (Fung et al. 2003; Crona and Bodin 2010) • Efficiency from distributed
responsibilities and specialization (e.g. A is specialized in information sharing)
• Multiple catalysts for change (A can stimulate change and challenge inertia of C or vice versa) (Crona and Bodin 2010)
Negative impacts on ES governance
• Power concentration without countervailing power, which can lead to manipulation (powerful actor A can filter or distort information) or blockage (powerful actor A can block or restrain information sharing) (Crona and Bodin 2010; Barnes et al., 2016)
• Lack of information diversity (which can limit collective learning)
• Power concentration without countervailing power, which can lead to inertia (powerful actor C can voluntarily restrict actions or be inefficient) or abuse of authority (C can act for its own benefit) (Bodin 2017; Guerrero et al. 2020) • Lack of diversity in leadership
(which can limit innovation)
• Risk of disguised centralized power if A and C are allies (e.g. if C is an authoritarian government and A is its press agency)
• Risk of blockage or conflicts from power contests if A and C disagree (and A campaigns against C or C forces A to be silent) A C B A B C A B C
(i.e. with high centrality measures) are better positioned to influence others. There are different centrality measures that can be used to illustrate such power. Here we focus on degree centrality, which shows the number of relational ties held by an actor, telling us how many direct ‘one-hop’ connections this actor has to others in the network.
Following previous studies conducted by sociologists, we looked into two forms of relational power within our SNA: domination and influence. Domination is the capacity to offer or withhold benefit or harms through force, coercion or authority. Influence consists of providing information in order to change
an actor’s opinion, attitude or behavior. Power asymmetries correspond to the uneven distribution of these two dimensions of power among actors (Table 1).
In addition to identifying power asymmetries, we also aimed at understanding the different types of power handled by actors. We used a framework proposed by Knoke (1990), which distinguishes between four types of actors based on their levels of influence and domination (Figure 4): actors with coercive, authoritative, persuasive and egalitarian (i.e. weak) power. We were also specifically interested in who exerted power over whom in relation to ES governance and what were the consequences in terms of conflicts.
No. 20
No. 307
November 20206
Influence Domination 1. Advice (e.g. technical training) 2. Information sharing (e.g. sending data) 3. Supervision (e.g. reporting back) Cooperation 5. Common projects 6. Business (e.g. selling or buying products) 8. Irregular professional meetings 7. Regular professional meetings 4. Restriction (e.g. controlling behavior by enforcing a law)Figure 5. The eight types of relationships (text in small circles) representing influence, domination and cooperation (the diameters of the circles are not informative).
To build the SNA, we asked our interviewees who they interacted with according to eight types of relationships representing influence, domination and cooperation (Figure 5). At the end of the interview process, we also asked interviewees to indicate with which actors they had had troubled or tense relationships and to explain why.
We combined the influence relationships to form an influence network (1+2) and proceeded in a similar manner for the domination (3+4) and cooperation (5+6+7+8) networks (Figure 6). We considered domination to be a directional network (i.e. one actor is identified as the initiator of the relationship and the other as the receiver), but influence and cooperation to be nondirectional ones (i.e. both actors participate in the relationship equally). Considering power, we found that the two networks of influence and domination were poorly correlated, suggesting that influential actors are not necessarily dominant ones. The two networks also differed in terms of their core/periphery structure (Figure 7). In general, the dense and cohesive core of a network encompasses the central actors that have a disproportionate number of relational ties, whereas actors in the sparsely connected periphery maintain few relational ties.
The core–periphery structures correspond to the power distribution among the different stakeholder types. Actors from the business sector showed significantly lower centrality scores in the influence network, while actors from the public sector showed significantly higher centrality scores in the domination network. The type of power handled by actors also depended on their role. ES beneficiaries were more likely to be found in the weak actor
Figure 4. Actors exhibit four types of power depending on the extent of their influence and domination (according to Knoke 1990).
More domination
Coercive
power Authoritativepower
Egalitarian
“power” Persuasivepower
M or e influenc e Less influenc e Less domination
Figure 6. Influence (straight light gray ties) and domination (curved dark gray ties) networks. The thickness of the ties is proportional to the weight of the relationship (between 0 and 1).
Sector Business Civil society NGOs Public sector Scale Local Subnational National
group. On the contrary, direct managers were more likely to be persuasive, and indirect managers to have authoritative or coercive power. Similarly, actors from the public sector were more likely to form influence relationships while the opposite was true of business actors. Business and civil society actors were more likely to be the receivers of a domination relationship, most frequently initiated by public sector actors. The existence of a cooperation relationship also positively affected the formation of both influence and domination ties, i.e. two actors who cooperated were more likely to influence or dominate each other. The most central actors in the cooperation network were the most likely initiators of the domination relationships.
Our statistical analyses within the SNA showed that the existence of a domination relationship between two actors strongly increased the probability of conflict occurrence. Big differences in the domination centrality scores between two actors increased this probability even further, meaning that conflicts were more likely when really powerful and really powerless actors were involved. Conversely, conflicts were less likely between actors of the same sector.
Concluding remarks: Power, inequity
and ecosystem governance
Our results demonstrate that power asymmetries are associated with conflicts, which in turn can influence the resilience of socio-ecological systems, in our case the resilience of the Mariño watershed. Power asymmetries can also cause mistrust in the institutions responsible for different aspects of ES governance.
Power and related inequities can have different aspects. They can arise due to the different roles that stakeholders hold in relation to ES, the different rights, resources and locations of stakeholders, and the relationships that they form. These aspects are also interrelated; they influence each other and can be explored using our ES cascade framework, SNA and other methods.
The ES cascade framework highlights the different roles of stakeholders in the management of ecosystems and ES, and in the use of their benefits. It can also illustrate the inequities that are tied to these roles. Power asymmetries can then be explored further with SNA.
Understanding the social networks of ES governance can help us to make sense of both the enabling conditions and the obstacles to sustainable and equitable ecosystem management. Identifying key players, isolated actors and those who can foster new collaborations or relationships between groups can be useful for land use planning, conflict resolution and the design of participatory governance mechanisms.
Acknowledgements
The funding partners that have supported this research include the European Union’s H2020 research and innovation program (SINCERE project), the International Climate Initiative (IKI) of the German Federal Ministry for the Environment, Nature Conservation, Building and Nuclear Safety (BMUB), the Norwegian Agency for Development Cooperation, the French Ministry for the Ecological and Inclusive Transition, and the CGIAR Research Program on Forests, Trees and Agroforestry (CRP-FTA) with financial support from the CGIAR Fund. The authors are grateful to Helvetas, Bosques Andinos, CEDES, and IDMA for logistical support and help organizing the workshops and interviews. The authors thank all interviewees for their time and useful information.
References
Bruley E., Locatelli B., Lavorel S., 2020. Nature’s contributions to people: Co-producing quality of life from multifunctional landscapes. Ecology and Society.
Figure 7. Types of actors most frequently found in the core and in the periphery of the influence and domination networks.
Domination network
More in the core: Public sector
More in the periphery: NGOs
Other national and international actors
Influence network
More in the core: Civil society Public sector Regional actors More in the periphery: Business
No. 20
No. 307
November 2020
8
Bonnesoeur V., Locatelli B., et al., 2019. Impacts of forests and forestation on hydrological services in the Andes: A systematic review. Forest Ecology and Management 433: 569-584. http://doi. org/10.1016/j.foreco.2018.11.033
Di Gregorio M., Fatorelli L., et al., 2019. Multi-level governance and power in climate change policy networks. Global Environmental Change 54: 64-77. http://doi.org/10.1016/j.gloenvcha.2018.10.003 Fedele G., Locatelli B., Djoudi H., 2017. Mechanisms mediating
the contribution of ecosystem services to human well-being and resilience. Ecosystem Services 28A: 43-54. http://doi.org/10.1016/j. ecoser.2017.09.011
Knoke D., 1990. Political networks: the structural perspective. Cambridge University Press.
Lavorel S., Locatelli B., et al., 2020. Co-producing ecosystem services for adapting to climate change. Philosophical Transactions of the Royal Society B 375: 20190119. http://doi.org/10.1098/ rstb.2019.0119
Locatelli B., Lavorel S., et al.., 2017. Characteristic trajectories of ecosystem services in mountains. Frontiers in Ecology and the Environment 15(3): 150-159. http://doi.org/10.1002/fee.1470 Martín-López B., Felipe-Lucia M.R., et al., 2019. A novel telecoupling
framework to assess social relations across spatial scales for ecosystem services research. Journal of Environmental
Management 241: 251-263. http://doi.org/10.1016/j. jenvman.2019.04.029
Mastrángelo M.E., Perez-Harguindeguy N. et al., 2019. Key knowledge gaps to achieve global sustainability goals. Nature Sustainability 2: 1115–1121. http://doi.org/10.1038/s41893-019-0412-1 Mathez-Stiefel S.L., Peralvo M., et al., 2017. Research priorities for
the conservation and sustainable governance of Andean forest landscapes. Mountain Research and Development 37(3): 323-339. http://doi.org/10.1659/MRD-JOURNAL-D-16-00093.1
Vallet A., 2018. Tradeoffs between ecosystem services: From landscapes to stakeholders. PhD Thesis, Paris-Saclay University, AgroParisTech, Paris, France.
Vallet A., Locatelli B., et al., 2018. Relationships between ecosystem services: Comparing methods for assessing tradeoffs and synergies. Ecological Economics 150: 96-106. http://doi.org/10.1016/j. ecolecon.2018.04.002
Vallet A., Locatelli B., et al., 2019. Linking equity, power and stakeholders’ roles in relation to ecosystem services. Ecology and Society 24 (2):14. http://doi.org/10.5751/ES-10904-240214 Vallet A., Locatelli B., et al., 2020. Power asymmetries in social
networks of ecosystem services governance. Environmental Science and Policy 114: 329-340. http://doi.org/10.1016/j. envsci.2020.08.020
cifor.org
forestsnews.cifor.org
Center for International Forestry Research (CIFOR)
CIFOR advances human well-being, equity and environmental integrity by conducting innovative research, developing partners’ capacity, and actively engaging in dialogue with all stakeholders to inform policies and practices that affect forests and people. CIFOR is a CGIAR Research Center, and leads the CGIAR Research Program on Forests, Trees and Agroforestry (FTA). Our headquarters are in Bogor, Indonesia, with offices in Nairobi, Kenya; Yaounde, Cameroon; Lima, Peru and Bonn, Germany.
This research was carried out by CIFOR-ICRAF as part of the CGIAR Research Program on Forests, Trees and Agroforestry (FTA). FTA is the world’s largest research for development program to enhance the role of forests, trees and agroforestry in sustainable development and food security and to address climate change. CIFOR leads FTA in partnership with Bioversity International, CATIE, CIRAD, INBAR, ICRAF and TBI.