HAL Id: hal-03192043
https://hal.archives-ouvertes.fr/hal-03192043
Submitted on 19 Apr 2021
HAL is a multi-disciplinary open access
archive for the deposit and dissemination of
sci-entific research documents, whether they are
pub-lished or not. The documents may come from
teaching and research institutions in France or
abroad, or from public or private research centers.
L’archive ouverte pluridisciplinaire HAL, est
destinée au dépôt et à la diffusion de documents
scientifiques de niveau recherche, publiés ou non,
émanant des établissements d’enseignement et de
recherche français ou étrangers, des laboratoires
publics ou privés.
Non-English languages enrich scientific knowledge: The
example of economic costs of biological invasions
Elena Angulo, Christophe Diagne, Liliana Ballesteros-Mejia, Tasnime Adamjy,
Danish A Ahmed, Evgeny Akulov, Achyut K Banerjee, César Capinha,
Cheikh a K M Dia, Gauthier Dobigny, et al.
To cite this version:
Elena Angulo, Christophe Diagne, Liliana Ballesteros-Mejia, Tasnime Adamjy, Danish A Ahmed,
et al..
Non-English languages enrich scientific knowledge:
The example of economic costs
of biological invasions.
Science of the Total Environment, Elsevier, 2021, 775, pp.144441.
Non-English languages enrich scienti
fic knowledge: The example of
economic costs of biological invasions
Elena Angulo
a,⁎
, Christophe Diagne
a, Liliana Ballesteros-Mejia
a, Tasnime Adamjy
b, Danish A. Ahmed
c,
Evgeny Akulov
d, Achyut K. Banerjee
e, César Capinha
f, Cheikh A.K.M. Dia
g, Gauthier Dobigny
b,
Virginia G. Duboscq-Carra
h, Marina Golivets
i, Phillip J. Haubrock
j,k, Gustavo Heringer
l, Natalia Kirichenko
m,n,
Melina Kourantidou
o,p,q, Chunlong Liu
r,s,t, Martin A. Nuñez
h, David Renault
u,v, David Roiz
w, Ahmed Taheri
x,
Laura N.H. Verbrugge
y,z, Yuya Watari
aa, Wen Xiong
ab, Franck Courchamp
aaUniversité Paris-Saclay, CNRS, AgroParisTech, Ecologie Systématique Evolution, 91405 Orsay, France b
Institut de Recherche pour le Développement, Centre de Biologie pour la Gestion des Populations, UMR IRD-INRAE-CIRAD-Institut Agro, Montferrier-sur-Lez 34988, France
c
Centre for Applied Mathematics and Bioinformatics, Department of Mathematics and Natural Sciences, Gulf University for Science and Technology, Hawally 32093, Kuwait
d
Russian Plant Quarantine Center, Krasnoyarsk Branch, Krasnoyarsk 660075, Russia
e
School of Life Sciences, Sun Yat-sen University, Guangzhou, Guangdong 510275, China
fCentro de Estudos Geográficos, Instituto de Geografia e Ordenamento do Território – IGOT, Universidade de Lisboa, Rua Branca Edmée Marques, 1600-276 Lisboa, Portugal gDepartment of Animal Biology, Sciences and Technics Faculty, Cheikh Anta DIOP University, B.P. Dakar 5005, Senegal
hGrupo de Ecología de Invasiones, INIBIOMA, CONICET/Universidad Nacional del Comahue, Av. de los Pioneros 2350, Bariloche 8400, Argentina i
Department of Community Ecology, Helmholtz-Centre for Environmental Research– UFZ, Halle (Saale) 06120, Germany
j
Senckenberg Research Institute and Natural History Museum Frankfurt, Department of River Ecology and Conservation, Gelnhausen 63571, Germany
k
University of South Bohemia inČeské Budějovice, Faculty of Fisheries and Protection of Waters, South Bohemian Research Center of Aquaculture and Biodiversity of Hydrocenoses, Vodňany 389 25, Czech Republic
lPrograma de Pós-Graduação em Ecologia Aplicada, Departamento de Ecologia e Conservação, Instituto de Ciências Naturais, Universidade Federal de Lavras– UFLA, Lavras, Minas Gerais
37200-900, Brazil
m
Sukachev Institute of Forest, Siberian Branch of Russian Academy of Sciences, Federal Research Center «Krasnoyarsk Science Center SB RAS», Krasnoyarsk 660036, Russia
n
Siberian Federal University, Krasnoyarsk 660041, Russia
o
Woods Hole Oceanographic Institution, Marine Policy Center, Woods Hole, MA 02543, United States
p
University of Southern Denmark, Department of Sociology, Environmental and Business Economics, Esbjerg Ø 6705, Denmark
q
Institute of Marine Biological Resources and Inland Waters, Hellenic Center for Marine Research, Athens 16452, Greece
rInstitute of Biology, Freie Universität Berlin, Berlin 14195, Germany
sLeibniz Institute of Freshwater Ecology and Inland Fisheries (IGB), Berlin 12587, Germany t
Berlin-Brandenburg Institute of Advanced Biodiversity Research (BBIB), Berlin 14195, Germany
u
Université de Rennes, CNRS, EcoBio (Ecosystèmes, biodiversité, évolution) - UMR 6553, 35000 Rennes, France
v
Institut Universitaire de France, 75231 Paris Cedex 05, France
w
MIVEGEC, IRD, CNRS, Université Montpellier, Montpellier 34394, France
x
Département de Biologie, Faculté des Sciences, Université Chouaïb Doukkali, El Jadida 24000, Morocco
yUniversity of Helsinki, Faculty of Agriculture and Forestry, Department of Forest Sciences, Helsinki 00014, Finland z
Aalto University, Department of Built Environment, Water & Development Research Group, Aalto FI-00076, Finland
aa
Forestry and Forest Products Research Institute, Tsukuba, Ibaraki 305-8687, Japan
ab
College of Fisheries, Guangdong Ocean University, Zhanjiang 524088, China
Science of the Total Environment 775 (2021) 144441
⁎ Corresponding author.
E-mail address:elenaanguloaguado@gmail.com(E. Angulo).
https://doi.org/10.1016/j.scitotenv.2020.144441
0048-9697/© 2021 The Authors. Published by Elsevier B.V. This is an open access article under the CC BY license (http://creativecommons.org/licenses/by/4.0/).
Contents lists available atScienceDirect
Science of the Total Environment
H I G H L I G H T S
• We compiled global economic cost data of invasive species from non-English sources.
• A large number of costs was added for new invasive species and new countries. • As a result, global cost estimates of inva-sions increased by 16.6% (US$ 214 bil-lion).
• Multi-language collaborations are nec-essary to enrich scientific knowledge. • The use of non-English sources
en-hances data completeness and reduces knowledge gaps. G R A P H I C A L A B S T R A C T
a b s t r a c t
a r t i c l e i n f o
Article history: Received 8 October 2020Received in revised form 8 December 2020 Accepted 8 December 2020
Available online 10 March 2021 Editor: Jay Gan
Keywords: Ecological bias Management Knowledge gaps InvaCost Native languages Stakeholders
We contend that the exclusive focus on the English language in scientific research might hinder effective commu-nication between scientists and practitioners or policy makers whose mother tongue is non-English. This barrier in scientific knowledge and data transfer likely leads to significant knowledge gaps and may create biases when providing global patterns in manyfields of science. To demonstrate this, we compiled data on the global eco-nomic costs of invasive alien species reported in 15 non-English languages. We compared it with equivalent data from English documents (i.e., the InvaCost database, the most up-to-date repository of invasion costs glob-ally). The comparison of both databases (~7500 entries in total) revealed that non-English sources: (i) capture a greater amount of data than English sources alone (2500 vs. 2396 cost entries respectively); (ii) add 249 invasive species and 15 countries to those reported by English literature, and (iii) increase the global cost estimate of invasions by 16.6% (i.e., US$ 214 billion added to 1.288 trillion estimated from the English database). Additionally, 2712 cost entries— not directly comparable to the English database — were directly obtained from practitioners, revealing the value of communication between scientists and practitioners. Moreover, we demonstrated how gaps caused by overlooking non-English data resulted in significant biases in the distribution of costs across space, taxonomic groups, types of cost, and impacted sectors. Specifically, costs from Europe, at the local scale, and particularly pertaining to management, were largely under-represented in the English database. Thus, combining scientific data from English and non-English sources proves fundamental and enhances data completeness. Considering non-English sources helps alleviate biases in understanding invasion costs at a global scale. Finally, it also holds strong potential for improving management performance, coordination among experts (scientists and practitioners), and collaborative actions across countries. Note: non-English versions of the abstract andfigures are provided in Appendix S5 in 12 languages.
© 2021 The Authors. Published by Elsevier B.V. This is an open access article under the CC BY license (http://creativecommons.org/licenses/by/4.0/).
1. Introduction
English is the language that dominates scientific publications in peer-reviewed journals in all researchfields (O'Neil, 2018). However, in recent years there has been an increasing recognition of the impor-tance of non-English literature forfilling knowledge gaps, expanding the scientific knowledge base and successfully complete global pictures in multiple facets of science (Salager-Meyer, 2008;Amano et al., 2016;
Hartling et al., 2017). Despite its importance, non-English literature re-mains largely underutilized by most researchers due to the language barrier that impedes understanding of the published materials, in addi-tion to the lower accessibility to these sources (Ito and Wiesel, 2006;
Lazarev and Nazarovets, 2018;Tao et al., 2018).
Knowledge gaps due to neglecting non-English literature are partic-ularly severe for studies covering topics in ecology and biodiversity. In-deed, many geographic regions still remain highly underrepresented in the English ecological literature, simply because they lie in areas where mother tongues are not English (Di Marco et al., 2017;Hickisch et al., 2019;Nuñez et al., 2019). For example, it is known that directionality in transboundary research is extremely unbalanced, with English-speaking countries (e.g., USA, UK, Australia) dominating over non-English speaking regions, such as francophone Africa or Latin America
(Verde Arregoitia and González-Suárez, 2019). Additionally, non-English knowledge from countries where non-English is not an official lan-guage is largely under-utilized, since it is not always accessible to the international scientific community, which undervalues the relevance of local expertise (Fazey et al., 2005;Zenni et al., 2017). Thus, re-searchers are geographically biased, which limits our understanding of global ecological patterns (Amano et al., 2016;Bellard and Jeschke, 2016). Researchers that are non-native English speakers might prefer to publish part of their work in their native language or in local journals
(Verde Arregoitia and González-Suárez, 2019; but see Nuñez and
Pauchard, 2010). While this maximizes local or national impact, it re-stricts the scope of their results to the scientific community and popular press globally, and thereby decreases opportunities for sharing experi-ences, novel ideas, observations or methodological advances (Nuñez et al., 2019). The value of accounting for data and results beyond just those made available in English has also been recently recognized for global meta-analyses (Konno et al., 2020).
In applied sciences, such as conservation biology or applied ecology, language is an essential factor for the transfer of knowledge and prac-tices at different spatial scales, from global to local and vice versa. Lan-guage barriers are among the top obstacles to the use of science in policy, also negatively affecting the interaction between scientists and
practitioners (Rose et al., 2018). On the one hand, scientific information is not always correctly transferred to practitioners, local managers, and policy makers, and this may be exacerbated if the relevant English pub-lications cannot be accessed or if their formats are unusable (Rose et al., 2018). As an example, the prevalence of English as a primary publica-tion language limited the use of scientific information by directors of protected areas in Spain (Amano et al., 2016). On the other hand, knowledge produced locally, beyond academic institutions, is not fully transferred to the international scientific community. For example,
Verde Arregoitia and González-Suárez (2019)showed that one quarter of presenters from non-academic institutions (i.e., government entities, private foundations, NGOs, or civilian groups) at the 25th International Congress of Conservation Biology, published their work slower and less often than presenters from academia. Even if in that case presenters interacted in English, the knowledge produced outside academia adds to the language gap. This observation is reinforced by the low priority of non-academic stakeholders in having theirfindings published in the scientific literature. While English literature is characterized by a higher number of citations (Di Bitetti and Ferreras, 2017), a significant amount of data is compiled in reports that are not further published. For instance, local authorities may collect and report biodiversity re-lated information in order to meet their environment and biodiversity management targets. As the information is intended for local stake-holders, most often non-researchers, the country's language is often used in these reports. These issues highlight the need tofind ways that foster increased communication and collaboration among stake-holders and across regions, in order to favor the extrapolation of applied management strategies from one region to others (Nuñez et al., 2019). In invasion biology, a global synthesis in thefield has acknowledged the gaps of using only English literature (Lowry et al., 2013). Moreover, it is well-known that there is a strong geographical bias, partially caused by omitting non-English literature (Nuñez and Pauchard, 2010;Bellard and Jeschke, 2016). There is a misleading view of how non-English speaking countries are currently dealing with invasions: Zenni et al., (2017) showed how non-English literature reporting world leading ef-forts was internationally largely ignored, most likely due to well established expert scientific communities of biological invasions pertaining to English speaking countries. Hence, our objective here was to assess the potential gaps and biases in data compiled exclusively from sources written in English. To this end, we used InvaCost, a re-cently published database that synthesizes the reported economic costs of biological invasions worldwide (N = 2419 cost entries;
Diagne et al., 2020a).Diagne et al. (in press)explored the distribution of these costs across space, taxa, and types of expenditure over time, and found that invasions cost a minimum of US$1.288 trillion (2017 US dollars) from 1970 to 2017 globally. Beyond these results, the au-thors also found large geographical data gaps, with few data outside North America, Europe, and Australia/New Zealand, and the majority of source documents being scientific peer-reviewed articles. In this sense, InvaCost (hereafter English database) for now consists of English sources exclusively. It is very likely that the studies on economic costs are not as rare as usually admitted, and that this preconception comes from a focus on English sources. In addition, not considering non-English sources can bias economic assessments, and hinder analyses that inform prioritization and expenditure on the management of inva-sive species.
We performed a data search in non-English languages, to compare it with the English database. We focused mainly on the most widely spo-ken languages, or the ones where we assumed that reports of economic costs of biological invasions could be found, such as Bengali, Chinese, French, or Spanish. By comparing the non-English and English data, we aimed: (i) to show how much more cost data we were able to cap-ture when considering non-English languages (i.e., the gaps of consider-ing only English documents), and (ii) to detect the magnitude and type of costs that were missing from the English literature (i.e., the bias pro-duced when only considering English documents).
2. Methods
2.1. Data searching methods
We searched costs associated with biological invasions in 15 non-English languages by native speakers (Table 1). Following the method-ology used to compile the English database (Diagne et al., 2020a), we used two complementary approaches for collating cost information. First, we performed a standardized literature search using three online bibliographic sources successively: ISI Web of Science platform (WoS hereafter;https://webofknowledge.com/), Google Scholar database (https://scholar.google.com/) and the Google search engine (https://
www.google.com/). In the WoS, we used the same search string as
those used for the English database, and used the“language” option to retrieve results for each non-English language (Appendix S1). This stan-dardized search method was the only one that was exactly comparable to the methodology used in the English database (Diagne et al., 2020a). Search strings used in Google and Google Scholar were unavoidably slightly different in each language, which was due to inherent linguistic differences and methodological constraints in Google engines (Haddaway et al., 2015; Appendix S1). Second, similar to the English da-tabase, albeit more targeted, an opportunistic search was carried out in each language (Appendix S1). This included (i) searching web pages of national institutions, NGOs, and other organizations, (ii) seeking specific literature databases of the countries/languages considered, and (iii) contacting official national managers or researchers that could provide cost data.
Data were retrieved until May 2020 (Angulo et al., 2020; doi:https:// doi.org/10.6084/m9.figshare.12928136). All data were compiled using the same structure as the English database (Diagne et al., 2020a; Appen-dix S2). Briefly, the database consisted of about 40 columns with four types of information: raw and standardized cost estimates; characteris-tics of data source documents (e.g., type of document, authorship, title, year); taxonomic classification of the invasive alien species for which costs were given; and cost characteristics (e.g., impacted sector, type of cost, spatial and temporal coverage, type of environment in which the cost occurred). We followed the procedures described inDiagne et al. (2020a)to screen for duplicates within the non-English database entries and against the English entries, as costs reported in non-English could have been the source of costs reported in non-English; in which case, exact cost entries were removed. Whenever possible and to ensure validity, each document was checked independently by two co-authors (i.e., all languages except Ukrainian and Greek). Cost stan-dardization to 2017 US Dollars ($) also followedDiagne et al. (2020a). 2.2. The non-English database and comparability to the English database
Given that the non-English search was performed more recently than the English one (data for the English database - original version
Table 1
Number of cost entries (Entries) and documents (Docs) for each language in the non-English database. The four Indian languages are Hindi, Tamil, Telugu and Bengali.
Languages Entries Docs
Arabic 0 0 Chinese 117 33 French 1148 55 German 47 5 Greek 10 6 Indian languages (4) 0 0 Japanese 328 22 Portuguese 34 21 Russian 89 4 Spanish 3289 97 Dutch 50 15 Ukrainian 100 98 Total 5212 356
E. Angulo, C. Diagne, L. Ballesteros-Mejia et al. Science of the Total Environment 775 (2021) 144441
of the InvaCost database;Diagne et al., 2020a- was retrieved up until December 2017) and the search methods were slightly different, we consider that the two databases could not be fully compared. Thus, we divided the non-English database into two datasets (Fig. 1): one con-taining exclusively costs gathered from documents published before 2018, which could be quantitatively compared with the English data-base (hereafter called“comparable dataset”); and another one contain-ing data from documents published after 2017 as well as unpublished data obtained from expert requests (i.e., that was not quantitatively comparable to the English database; hereafter called“non-comparable dataset”).
Although most documents from the English database were pub-lished before 2018, we also extracted an“English comparable dataset” in which the few cost entries from unpublished documents or materials published after 2017 were removed (Fig. 1).
2.3. The effect of the proportion of English speakers on the number of costs We analyzed the correlation between the numbers of cost entries of each non-English language per country and the proportion of English speakers per country. To do so, we used the complete non-English data-base. The number of entries was log10 transformed. We obtained data for the proportion of English speakers for 26 countries fromAmano
and Sutherland (2013) and Eberhard et al. (2020). Amano and
Sutherland (2013)obtained the total number of speakers of English as thefirst or second language from four different sources - including a previous version ofEberhard et al. (2020)-, related it to the national population, and used the maximum value obtained for each country. When no data was available inAmano and Sutherland (2013), we re-ferred toEberhard et al. (2020). We related the number of entries (log transformed) to the proportion of English speakers in each country. 2.4. Differences between non-English and English data in cost descriptors
Using only the comparable datasets of both non-English and English databases, we evaluated the differences between them in three ways. First, we tested whether the number of entries was different for each of the following cost descriptors: geographic region and type of envi-ronment where the cost occurred, spatial scale and impacted sector of the cost, as well as the type of cost. The original categories of the “Spatial_scale” column of the English database (Appendix S2) were
re-assigned to three categories as follows: ‘supranational’ costs (regrouping the original categories of global, intercontinental, continen-tal, and regional, i.e., costs estimated for more than one country), ‘coun-try-level’ costs (estimated for a whole country) and ‘local-level’ costs (regrouping the original categories of site and unit, i.e., costs estimated within a country). The original categories of the type of cost of the English database were re-grouped in three categories: cost related to ‘damage or loss’, cost related to ‘management’, and ‘mixed’ costs when both costs categories are reported together or when the type of cost was unspecified meaning that it could not be easily classified under one or the other category (Appendix S3). For the type of economic sector, we used the categories:‘authorities/stakeholders’, ‘agriculture’, ‘health’, ‘environment’, ‘forestry’, ‘public and social welfare’, ‘fishery’; and we merged mixed categories with‘diverse/unspecified’. To assess differences in the taxonomic composition of invasive species between English and non-English entries, we only used the most represented, broad categories: the kingdom Plantae for plants and the phyla Arthropoda, Chordata, and Mollusca for animals. For the purposes of this analysis, we excluded data assigned to more than one of these categories.
To perform all of these comparisons, wefitted generalized linear mixed models with a binomial distribution and a logit link (SAS Institute Inc., 2018). For this purpose, we added dummy variables for each category within each of the above cost descriptors, with‘0’ (when the cost entry was not assigned to a specific category) or ‘1’ (when the cost entry was assigned to a specific category). We con-sidered each dummy variable as the dependent variable, and whether they come from the non-English or the English datasets as the independent variable. Because there could be more than one cost estimate within a given document (e.g., reportingfive cost esti-mates for a given species in different years, or reporting costs for the control offive different aquatic species), entries coming from the same document were not statistically independent. Thus, we in-cluded the“Reference_ID” (the identification code for each docu-ment) as a random effect to explicitly model the covariance structure due to cost entries extracted from the same document (“repeated_subject” in Proc Genmod).
We also calculated, for each category of the cost descriptors, the per-centage that the monetary costs of the comparable non-English dataset represented to the total costs obtained once combining the English and non-English (comparable datasets) (in 2017 US dollars).
Fig. 1. Number of cost entries of invasive species in non-English languages and in English (InvaCost database), distinguishing comparable and non-comparable datasets. For each of the non-English datasets, the number of cost entries by language are represented in the bar diagrams. Languages shown: SP, Spanish; FR, French; JP, Japanese; UA, Ukranian; RU, Russian; CH, Chinese. For SP and FR, turquoise and magenta bars distinguish entries from Spain and France (turquoise) and entries from Spanish-speaking South American countries and franco-phone African countries (magenta).
2.5. Differences in invasive species recorded in both databases
First, we compared invasive species reported in the non-English and English databases, using both the comparable and the complete datasets. Specifically, we examined whether species with costs in the non-English datasets were already included in the English dataset (shared species), or whether they were only included in the non-English datasets; and similarly for species with costs in the non-English dataset. Since some cost entries were assigned to multiple species si-multaneously, we obtained the complete list of species having reported costs, as follows: we expanded all species contained in these cost entries (in the column“Species”), so that each species was individually consid-ered. In order to avoid over-estimations, we also removed subspecies or genus when the corresponding species was present in the same dataset (e.g., we removed Canis lupus dingo when C. lupus was already present; we removed Ludwigia sp. if any Ludwigia species, such as L. grandiflora, was present). When comparing both species lists (non-English and English), if a genus was present in a list (but the species name was missing) while in the other list there were one or more than one species, we considered that only one species was shared between the two databases (e.g., Rubus sp. appears in the English dataset, while both Rubus glaucus and R. constrictus do in the non-English dataset; so only one shared species was counted).
Second, we quantified the contribution of costs reported from spe-cies in the non-English relative to the English dataset, and graphically mapped the results. Using only the comparable datasets, we developed an index that reflects the difference between the number of species by country in the non-English and English datasets (that is, for each coun-try, we subtracted the number of species in the English dataset from the number of species in the non-English dataset). This index is positive when the number of species in the non-English dataset is higher than those in the English dataset for that particular country; or negative oth-erwise. In this analysis, species costs reported for Great Britain, England and Scotland were considered as belonging to a single country: the United Kingdom. Additionally, overseas territories are represented in their main country territory (e.g., Martinique or French Guiana are rep-resented in France).
3. Results
3.1. The relevance of non-English documents reporting costs
The non-English database includes 5212 cost entries from 356 documents, which covered 10 out of the 15 non-English languages examined in this study (Fig. 1, doi:https://doi.org/10.6084/m9. figshare.12928136). Despite our extensive search efforts, we could not find cost reports in five of the languages we considered. These languages are Arabic and four languages used in India: Hindi, Telugu, Tamil, and Bengali. Some documents obtained directly from Spanish official man-agers were written in two co-official languages: Catalan and Galician. From the 356 documents collected, 30 were unpublished materials (N = 1635 cost entries), and 149 documents were published after 2017 (N = 1850). This resulted in a total of 2500 entries that were com-parable to the English entries (i.e., the comcom-parable non-English dataset) and 2712 entries were not comparable (Fig. 1). In general, Spanish and French dominated over the other languages, and mostly Spanish from Spain (>85%) rather than from Latin American countries, and French from France (>80%) rather than from francophone African countries.
From the English database, the non-comparable dataset consisted of 15 cost entries from six unpublished documents (i.e., “Type_of_material” column: “Unpublished material”) and eight entries fromfive documents published in 2018. The English comparable dataset had therefore 2396 entries from 838 documents. In relation to the total economic cost, the non-English comparable dataset resulted in US$ 214 billion (sum of the annual estimated costs), and when including the non-comparable dataset, the
contribution from the non-English database resulted in US$ 234 billion. In comparison, a refined version of the English database led to about US $ 1.288 trillion, considering either the comparable English dataset or both comparable and non-comparable English datasets. Thus, consider-ing non-English data increased the English-based global cost estimates of invasions by 16.6% (only the comparable dataset) or by 18.1% (the full non-English database).
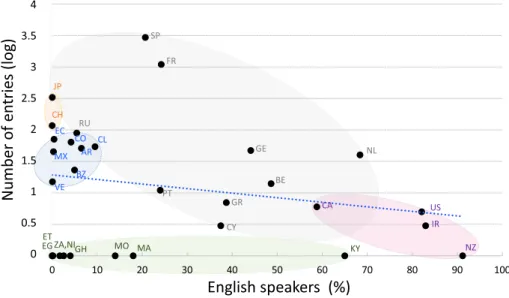
3.2. Relationship between the number of cost entries and the proportion of English speakers
We found a negative relationship between the number of cost en-tries (log transformed) and the proportion of English speakers per coun-try (correlation coefficient r = −0.216, N = 26;Fig. 2), suggesting that countries with a low proportion of English speakers published more in their native languages. This pattern is highly driven by the Spanish and French-speaking countries, from where many of our cost entries originated. European countries followed this trend, with countries with a higher proportion of English speakers, such as the Netherlands (68.3%), Germany (44.1%), and Belgium (48.6%) having fewer docu-ments published in their own language compared with countries with a lower proportion of English speakers, such as France (24.3%) or Spain (20.7%). The rest of the countries were grouped as follows: African countries with a variable range of English speakers, but very few non-English cost entries, South American countries with an average number of cost entries and low proportion of English speakers (<10%), and Asian countries (i.e., China and Japan) with a high number of entries and a low proportion of English speakers (<0.05%) (Fig. 2).
3.3. Differences in cost descriptors
Compared to the English dataset, the number of entries in the non-English dataset was significantly higher for European countries, and sig-nificantly lower for countries from Africa, North and Central America, and Oceania and Pacific Islands (Fig. 3a, Appendix S4). The number of entries in the non-English dataset was significantly higher at the local scale, but significantly lower at the country and global scales compared to the English dataset (Fig. 3b, Appendix S4). With respect to the envi-ronment where the cost occurred, the number of cost entries was not significantly different between the non-English and English datasets (Fig. 3c, Appendix S4). The number of entries in the non-English dataset was significantly higher for the authorities and stakeholders, but signif-icantly lower for agriculture, forestry, and public and social welfare sec-tors than in the English dataset (Fig. 3d, Appendix S4). The number of entries in the non-English dataset was significantly higher for manage-ment costs, but significantly lower for damage costs than in the English dataset (Fig. 3e, Appendix S4). Finally, we obtained a significantly higher number of entries for invasive alien plants in the non-English dataset while significantly lower entries for Chordata and Arthropoda, and no difference for Mollusca (Fig. 3f, Appendix S4).
Regarding the differences in the spatial scale of cost entries between non-English and English comparable datasets, we observed that only African countries had entries (in French) at the supranational scale (Fig. S1a). Those costs had a higher proportion than those in the English database (12% vs. 5.3% respectively). In the English database, the pro-portion of cost entries at the local scale or at the country level were very similar (48.5 and 46.2% respectively) (Fig. S1b). Besides African countries, there were many countries with most entries at the local scale (e.g., 100% for Spain, Ecuador, and Cuba; >90% for Ukraine, France, and Belgium); while few countries had costs mostly at the coun-try level (e.g., >85% for Russia, the Netherlands, and Colombia), or with a proportion of costs more equally distributed between the country and the local scale (e.g., Chile: 60 vs. 40%; Argentina: 72 vs. 28%; or Germany: 76 vs. 23% respectively) (Fig. S1a).
Concerning the costfigures, we observed that non-English economic costs were very important at the geographic level for South America,
E. Angulo, C. Diagne, L. Ballesteros-Mejia et al. Science of the Total Environment 775 (2021) 144441
and at the taxonomic level for invasive alien plants (Fig. 3). Costs for South America constituted 53.7% of the total non-English cost and 56% when comparable non-English and English costs were combined (Fig. 3g). Non-English costs were also relatively higher at the local scale (US$ 24 billion,Fig. 3h), for Chordata (US$ 28 billion,Fig. 3l), when occurring in semi-aquatic environments (US$ 1.5 billion,Fig. 3i), and when spent by authorities and stakeholders (US$ 11 billion,
Fig. 3j). Costs for invasive plants in non-English amounted to US$ 120 billion, which constituted 67.2% of the total non-English costs, and 31% when non-English and English costs were combined (Fig. 3l). 3.4. Differences in invasive alien species recorded in both databases
The comparable and non-comparable datasets of the English database had the same species lists. In the non-English database, the non-comparable dataset had a higher number of species than the comparable dataset, resulting overall in more species being listed in the non-English than in the English database. The species lists of the two comparable (English and non-English) datasets shared only 19% of species, and species brought up by the search in non-English languages represented 44% of the total (249 out of 569 species;
Fig. 4a). When considering the full non-English database (comparable and non-comparable datasets), the percentage of shared species remained 19%, but amounted to 54% for species reporting cost only in non-English languages (384 out of 705 species;Fig. 4b).
The difference in species per country between non-English and English datasets varied from−102 to 132 species. Positive values repre-sent more species in the non-English dataset, which was found in 18 countries, with the highest value in Spain (Fig. 4c). Negative values rep-resent more species in the English dataset, which was found in 5 coun-tries, with the highest (negative) value in the USA (Fig. 4c). Additionally, for countries with species in one dataset only, positive values were found in 15 countries (i.e., reporting costs for species only in non-English languages) and negative values occurred in 59 countries (i.e., reporting costs for species only in English). In both cases, the ex-treme values were lower: a total of 43 species was the maximum num-ber of species with reported costs only in the non-English dataset, and was found from Russia; and− 56 species was the minimum number of species with reported costs only in English and was found from Australia (Fig. 4c).
4. Discussion
The relevance of considering non-English languages was substanti-ated as non-English data: (i) increased the content of the published English database by more than 100% (2500 non-English vs. 2396 English entries), (ii) increased the global cost estimate of invasions by 16% (by ~US$ 214 billion), and (iii) provided costs for 249 new species and 15 new countries. In addition, 135 other species were found by considering 2712 cost entries from non-published sources, directly obtained from practitioners or managers and/or from documents produced after 2017. Moreover, these gaps resulted in an underrepresentation of cost entries (i) associated with European countries, (ii) measured at the local scale, (iii) impacting primarily authorities and stakeholders, (iv) corresponding to management, and/or (v) reported for plants. In sum-mary, relying on data exclusively published in English has some impor-tant implications, particularly when the concerned discipline has a strong applied component, for e.g., through informing policy on invasions.
4.1. Knowledge gaps when considering only English in the costs of invasive species
The large number of costs of invasive species reported exclusively in non-English languages highlights the importance of increasing efforts to capture all available literature beyond English only. This is in agreement with previousfindings that provide evidence for gaps in global assess-ment and ecological patterns, e.g., the assessassess-ments of IUCN population status of endangered taxa (Amano et al., 2016) or the use of interviews in conservation biology (Young et al., 2018). Here, we also demon-strated that relying on only English sources results in a distorted picture of lower invasion costs. For example, management expenses were under-represented in English versus non-English datasets. This could be explained by the fact that a third of the cost entries in the non-English database were obtained from local managers and/or practi-tioners. Also, it could depend on how local funds are distributed, with priority on management rather than on damage evaluation, which would require additional resources and scientific skills (and would likely be reported in English). The gaps reported are in line with those ofZenni et al. (2017), whose work supports the notion that invasion bi-ologists should work more intensively with managers and practitioners,
Fig. 2. Relationship between the number of entries of economic costs of invasive species in non-English languages and the percentage of English speakers in each country. Regression line is marked in blue. Countries are grouped according to their occupied convex hull area and encompassed with standard ellipses (considering confidence intervals = 95% of their respective data); European countries in grey, African countries in green, South American countries in blue, Asian countries in yellow, and English speaking countries in pink. Country abbreviations: AR, Argentina; BE, Belgium; BZ, Brazil; CA, Canada; CL, Chile; CH, China; CO, Colombia; CY, Cyprus; EC, Ecuador; EG, Egypt; ET, Ethiopia; FR, France; GE, Germany; GH, Ghana; GR, Greece; IR, Ireland; JP, Japan; KY, Kenya; MA, Madagascar; MX, Mexico; MO, Morocco; NL, Netherlands; NI, Nigeria; NZ, New Zealand; PT, Portugal; RU, Russia; SP, Spain; US, United States; VE, Venezuela; ZA, Zambia.
Fig. 3. Number of entries (a, b, c, d, e, f) and relative amount (g, h, i, j, k, l) of economic costs of invasive alien species in non-English languages and in English (from InvaCost database), by (a, g) geographic regions where the cost occurred, (b, h) spatial scale of the cost, (c, i) environment where the cost occurred, (d, j) impacted sector of the cost, (e, k) type of cost, and (f, l) main taxonomic groups. Significant differences in the number of entries between non-English and English are marked with asterisks and highlighted in blue.
E. Angulo, C. Diagne, L. Ballesteros-Mejia et al. Science of the Total Environment 775 (2021) 144441
and more broadly, with society as a whole. Similar gaps were also found in other applied ecological global databases, such as the Forest Global Earth Observatory (ForestGEO:https://forestgeo.si.edu/) and the Nutri-ent Network (Nutnet:http://www.nutnet.umn.edu/) (Nuñez et al., 2019).
We also found marked differences in the number of cost entries among languages. This uneven geographic distribution is similar to whatAmano et al. (2016)reported in the context of biodiversity and conservation, when comparing 16 major languages. These researchers found that 64.4% of the documents were published in English, followed by 12.6% in Spanish, 10.3% in Portuguese, 6% in Chinese, and 3% in French. In our case, and considering together the English and non-English databases, we obtained 43% of cost entries in Spanish, 31.7% in English, 15% in French, 4.3% in Japanese, and 1.5% in Chinese. We ob-served that Spanish and French represented a large proportion of the cost entries that were not reported in English. Not surprisingly, coun-tries with a high proportion of English speakers were more represented in the English database compared to the non-English database. In mul-tilingual countries, several of them located in Africa or Asia, publishing in the native tongue(s) may not be the most practical or efficient. In-deed, there may be several native tongues within a single country, mak-ing it complicated to opt for consensual non-English language(s) to report information. For example, while Kenya and the Netherlands have a similar proportion of English speakers, the non-English speakers in Kenya are linguistically more diverse, where about 70 languages are spoken, whereas for the Netherlands the remaining almost entirely speak Dutch (Eberhard et al., 2020). In addition, other implications, such as political or historical ones, may explain low reported costs in some languages/countries. For example, the long colonial history and a large middle class that isfluent in English in India could explain the predominant use of this language in publications (Fazey et al., 2005).
Some languages have been targeted to attempt increasing the visi-bility of papers written in that language. For example, Tao et al. (2018)claimed that 79 million papers have been published in Chinese since 1979, some of them describing important advances that remain unseen by Western researchers. Acknowledging these omissions, along with the fact that 1.39 billion people speak some dialects of Chinese, the journal Conservation Biology announced that their papers will include abstracts in Chinese from 2017 onwards (Conservation Biology, 2017). Other journals in thefield are following suit, such as Biological Invasions, or the Journal of Applied Ecology which translated the‘Guide to Getting Published’ in Chinese and is promoting abstracts in local languages (Nuñez et al., 2019).
4.2. Ignoring non-English data biases cost patterns for invasive species We identified the biases from considering exclusively English sources when reporting global trends in costs. First, we identified a geo-graphic bias, both in the number of entries and in the magnitude of costs, in agreement with a previous hypothesis (Zenni et al., 2017). The non-English search provided substantially more entries for Europe, especially Spain and France. Concerning the amount of money they represented, costs reported in non-English from South America and, to a lesser extent, from Africa, were highly relevant. This could be the result of the increasing development of national strategies and re-search budgets for the control of invasive alien species (Zenni et al., 2017). In fact, the recent release of InvaCost_3.0 (Diagne et al., 2020b), which included English as well as non-English data, permitted to show that for some continents and countries economic assessments of invasive species mostly rely on non-English data. For instance, in Central and South America over 40% of cost estimates have been published in non-English languages (Heringer et al., in press); among those, in
Fig. 4. Number of shared and unshared species between the non-English database and the English database (InvaCost), considering (a) only comparable data (N = 569 species) and (b) all data in non-English languages (N = 705 species). (c) The map shows the number of species that the non-English comparable dataset contributed minus the total number of species of the English comparable dataset by country (turquoise-magenta scale). Countries having only species in the non-English comparable dataset are marked with stripes and countries having only species in the English comparable dataset are marked with a grid. The borders illustrated in the map may not represent the current political reality.
Ecuador 51% of all costs have been published in Spanish ( Ballesteros-Mejia et al., in press). A similar situation is observed in Asia (reviewed inLiu et al., in press), where all cost estimates from Japan have been re-ported in Japanese (Watari et al., in press), and cost entries from Russia have predominantly originated from Russian-language documents (Kirichenko et al., in press).
Costs reported at larger spatial scales were more frequent in the English database, whilst the non-English search added significantly more cost entries at the local scale (~8% of the total money spent on combining English and non-English databases). This is likely due to local researchers and practitioners being more informed on a local level, but maybe not speaking English, or not being encouraged to pub-lish their data in traditional scientific outlets (Nuñez et al., 2019). Some journals have launched specific spaces for practitioners to publish their opinions and examples of best practice (Hulme, 2011). Improved con-nections with other scientists or practitioners can help promote good practices between localities with similar applied problems (Nuñez et al., 2019). In fact, we detected costs for similar concepts in different regions or sites, showing that although local discoveries of efficient trol interventions for invasive species can be relevant for successful con-trol elsewhere, the language barrier may have applied consequences. It is apparent that a stronger link is required between researchers and stakeholders to increase the international visibility of local knowledge (Sutherland et al., 2019). For example, BiodivERsA attempts to facilitate this by forming a network of funding organizations to support biodiver-sity research (Durham et al., 2014). The non-English database can con-stitute an essential tool for practitioners (e.g., searching for cost information associated with specific management types actions or spe-cific species), policy makers (e.g., searching for damage-related costs in order to motivate, guide and/or prioritize prevention or response ac-tions towards invasive species), and scientists (e.g., macroecological analyses, data syntheses, or meta-analyses).
Our results also show that an English-only search missed a large number of cost entries impacting authorities and stakeholders. Species invasions are context-dependent, with developing countries typically facing challenges different to those by more developed countries. There-fore, the way invasive species are perceived by local populations, stake-holders and leaders, as well as funders, including the nature of their costs, might differ between countries (Nuñez et al., 2019). For example, the predominant number of costs from Spain and France seem to be pri-marily related to management costs, whereas a higher amount of costs reported in Spanish corresponded to South America and seemed to be related to damage costs.Nuñez and Pauchard (2010)found that the scarcity of scientific reports on invasive species in developing countries was associated with low funding for ecological research in comparison to other disciplines closely related to medicine, water shortage and food supply. This may explain the high proportion of reported costs re-lated to agriculture in South American countries.
Finally, the number of cost entries coming from invasive plant spe-cies reported in non-English languages also contributed significantly, and amounted to ~30% of the total money associated with plants when considering both English and non-English datasets. Local knowl-edge on plants could be higher than for other taxa, as plants are re-sources for medicine, food, or animal breeding, and plant invasions dominate the English literature in invasion science (Lowry et al., 2013;
Carboneras et al., 2018). 5. Conclusions and perspectives
The aim of this study was not to exhaustively search for information on the economic costs of biological invasions in all possible languages. Rather, we aimed at showing that sources beyond English literature are available and rich in primary data. In fact, the amount of retrieved data was dependent on multiple factors such as country or language specificities; for example, some countries have policies to make data publicly available, or have specific budgets for invasive species, while
others do not. In some cases, we also observed a kind of domino effect, e.g., in France, experts increasingly sent us new cost data as they heard about the project. Also, our research was limited to the languages spo-ken by the authors, and many languages have not been searched at all and could provide much additional data. Non-English sources on inva-sive species that are often overlooked mostly include the grey literature and unpublished reports from practitioners, resource managers, and re-searchers. Therefore, we demonstrated the importance of multi-language collaborations in biological invasions, which are in essence an international issue. The non-English database now complements the original English database in an updated version of InvaCost (InvaCost_3.0,Diagne et al., 2020b), and we hope that this study will en-courage others that aim to bridge linguistic barriers. The benefits of these collaborations are clear: improving management efficiency, de-creasing research effort, and adequately guiding policy. In that way, we have provided the Appendix S5, with abstracts andfigure legends in several languages, as a proof of concept for promoting the overall message of this study. We hope that our results and our suggestions will encourage future proposals to alleviate language barriers as a means to enrich scientific knowledge, and in particular, lead to a reduc-tion of economic costs with improved management strategies of inva-sive alien species.
Supplementary data to this article can be found online athttps://doi. org/10.1016/j.scitotenv.2020.144441.
Funding
This work was supported by the French National Research Agency (ANR-14-CE02-0021) and the BNP-Paribas Foundation Climate Initiative for the InvaCost project that allowed the construction of the InvaCost database; the AXA Research Fund Chair of Invasion Biology of University Paris Saclay (EA and LBM contracts) and BiodivERsA and Belmont-Forum call 2018 on biodiversity scenarios– “Alien Scenarios” (the workshop where this work was initiated, and MG and CD contracts, BMBF/PT DLR 01LC1807C); Coordenação de Aperfeiçoamento de Pessoal de Nível Superior– Brasil (Capes) (Finance code 001, GH con-tract); Russian Foundation for Basic Research (grant number 19-04-01028-a); InEE-CNRS who supports the network GdR 3647‘Invasions Biologiques’, the French Polar Institute Paul-Emile Victor (Project IPEV 136‘Subanteco’), and the national nature reserve of the French southern lands (RN-TAF); Portuguese National Funds through Fundação para a Ciência e a Tecnologia (grant numbers CEECIND/02037/2017; UIDB/ 00295/2020 and UIDP/00295/2020); Kuwait Foundation for the Advancement of Sciences (KFAS) (grant number PR1914SM-01) and the Gulf University for Science and Technology (GUST) internal seed fund (grant number 187092).
Authors contributions
FC, CD and EA conceived the idea. CL and WX compiled the Chinese data; DRe, CAKM, LBM, GD and TA compiled the French data; EA, LBM, VGD, MN and DRo compiled the Spanish data; NK and EAk compiled the Russian data; GH and CC compiled the Portuguese data; PH and MG compiled the German data; LV compiled the Dutch data; MG com-piled the Ukrainian data; MK comcom-piled the Greek data; YW comcom-piled the Japanese data; AKB performed the Indian languages search; and AT performed the Arabic search. CD, LBM and EA refined and standard-ized the data. EA took the lead in writing the original draft of the article with inputs from all co-authors. All authors read and approved thefinal version of the manuscript.
CRediT authorship contribution statement
Elena Angulo: Conceptualization, Resources, Methodology, Writing– original draft, Writing– review & editing. Christophe Diagne: Conceptu-alization, Resources, Methodology, Writing– review & editing. Liliana
E. Angulo, C. Diagne, L. Ballesteros-Mejia et al. Science of the Total Environment 775 (2021) 144441
Ballesteros-Mejia: Resources, Methodology, Writing– review & editing. Tasnime Adamjy: Resources. Danish A. Ahmed: Resources, Writing– review & editing. Evgeny Akulov: Resources. Achyut K. Banerjee: Resources, Writing – review & editing. César Capinha: Resources, Writing– review & editing. Cheikh A.K.M. Dia: Resources, Writing – review & editing. Gauthier Dobigny: Resources, Writing– review & editing. Virginia G. Duboscq-Carra: Resources. Marina Golivets: Resources, Writing– review & editing. Phillip J. Haubrock: Resources, Writing– review & editing. Gustavo Heringer: Resources, Writing – review & editing. Natalia Kirichenko: Resources, Writing– review & editing. Melina Kourantidou: Resources, Writing– review & editing. Chunlong Liu: Resources, Writing– review & editing. Martin A. Nuñez: Resources, Writing – review & editing. David Renault: Resources, Writing– review & editing. David Roiz: Resources, Writing – review & editing. Ahmed Taheri: Resources, Writing– review & editing. Laura N.H. Verbrugge: Resources, Writing– review & editing. Yuya Watari: Resources, Writing– review & editing. Wen Xiong: Resources. Franck Courchamp: Conceptualization, Resources, Methodology, Writing – review & editing.
Declaration of competing interest
The authors declare that they have no known competingfinancial interests or personal relationships that could have appeared to in flu-ence the work reported in this paper.
Acknowledgements
We want to acknowledge all environmental managers, national of fi-cials, practitioners, and researchers who kindly answered our request for information about the costs of invasive species. DA would also like to thank Fawaz Azizieh from GUST for the translation of the abstract into Arabic. Covid-19 lockdown provided a test of our capacities of doing sci-ence while dealing with all the problems for managing children, home and telework; we would like to specially thank our children (Juan, Pol and Nuria Cerdá Angulo; Laurine and Cyrian Courchamp; Sorahya Van Geenen; Ilaria and Sophia Haubrock; Tamayo and Kiho Watari; Elaia, Antonin and Naellie Dobigny; Coline and Mathieu Renault; Margarida and Rodrigo Capinha; and Lana Lujayn Danish) for their patience with their parents.
References
Amano, T., Sutherland, W.J., 2013.Four barriers to the global understanding of biodiver-sity conservation: wealth, language, geographical location and security. Proc. R. Soc. B Biol. Sci. 280 (1756), 20122649.
Amano, T., González-Varo, J.P., Sutherland, W.J., 2016. Languages are still a major barrier to global science. PLoS Biol. 14 (12), e2000933.https://doi.org/10.1371/journal. pbio.2000933.
Angulo, E., Diagne, C., Ballesteros-Mejia, L., Adamjy, T., Ahmed, D., Akulov, E., Banerjee, A.K., Capinha, C., Dia, C.A.K.M., Dobigny, G., Duboscq-Carra, V.G., Golivets, M., Haubrock, P., Heringer, G., Kirichenko, N., Kourantidou, M., Liu, C., Nuñez, M., Renault, R., Roiz, D., Taheri, A., Verbrugge, L., Watari, Y., Xiong, W., Courchamp, F., 2020. Non-English database version of InvaCost. Figsharehttps://doi.org/10.6084/ m9.figshare.12928136Dataset.
Ballesteros-Mejia, L., Angulo, E., Cooke, B., Diagne, C., Nuñez, M., Duboscq-Carra, V., Courchamp, F., 2021.Economic costs of biological invasions in Ecuador: the impor-tance of the Galapagos Islands. NeoBiota (Special Issue“economic costs of invasive alien species worldwide” ) (in press).
Bellard, C., Jeschke, J.M., 2016.A spatial mismatch between invader impacts and research publications. Conserv. Biol. 30 (1), 230–232.
Carboneras, C., Genovesi, P., Vilà, M., Blackburn, T.M., Carrete, M., Clavero, M., D'hondt, B., Orueta, J.F., Gallardo, B., Geraldes, P., González-Moreno, P., Gregory, R.D., Nentwig, W., Paquet, J-Y., Pysek, P., Rabitsch, W., Ramírez, I., Scalera, R., Tella, J.L., Walton, P., Wynde, R., 2018.A prioritised list of invasive alien species to assist the effective im-plementation of EU legislation. J. Appl. Ecol. 55 (2), 539–547.
Conservation Biology, 2017.Publication of abstracts in Chinese. Conserv. Biol. 32, 5.
Di Bitetti, M.S., Ferreras, J.A., 2017. Publish (in English) or perish: the effect on citation rate of using languages other than English in scientific publications. Ambio 46 (1), 121–127.https://doi.org/10.1007/s13280-016-0820-7.
Di Marco, M., Chapman, S., Althor, G., Kearney, S., Besancon, C., Butt, N., Maina, J.M., Possingham, H.P., von Bieberstein, K.R., Venter, O., Watson, J.E., 2017.Changing trends and persisting biases in three decades of conservation science. Global Ecol. & Conserv. 10, 32–42.
Diagne, C., Leroy, B., Gozland, R.E., Vaissière, A.-C., Assailly, C., Nuninger, L., Roiz, D., Jourdain, F., Courchamp, Jarić I., F., 2020a.INVACOST, a public database of the eco-nomic costs of biological invasions worldwide. Scientific Data 7, 277.
Diagne, C., Leroy B., Gozland, R.E., Vaissière, A.-C., Assailly, C., Nuninger, L., Roiz, D., Jourdain F., Jarić I. Courchamp F. (2020b) Inva8Cost: references and description of economic cost estimates associated with biological invasions worldwide.figshare. Dataset. doi: doi:https://doi.org/10.6084/m9.figshare.12668570.
Diagne, C., Leroy, B., Vaissière, A.-C., Gozlan, R.E., Roiz, D., Jarić, I., Salles, J.-M., Bradshaw, C.J.A., Courchamp, F., 2021. High and rising economic costs of biological invasions worldwide. Nature.https://doi.org/10.1038/s41586-021-03405-6.
Durham, E., Baker, H., Smith, M., Moore, E., Morgan, V., 2014.The BiodivERsA Stakeholder Engagement Handbook. BiodivERsA, Paris (108 pp).
Eberhard, D.M., Simons, G.F., Fennig, C.D. (Eds.), 2020. Ethnologue: Languages of the World. Twenty-Third Edition. SIL International. Online version, Dallas, Texas http:// www.ethnologue.com.
Fazey, I., Fischer, J., Lindenmayer, D.B., 2005.Who does all the research in conservation bi-ology? Biodivers. Conserv. 14 (4), 917–934.
Haddaway, N.R., Collins, A.M., Coughlin, D., Kirk, S., 2015.The role of Google scholar in ev-idence reviews and its applicability to grey literature searching. PLoS One 10 (9), e0138237.
Hartling, L., Featherstone, R., Nuspl, M., Shave, K., Dryden, D.M., Vandermeer, B., 2017.
Grey literature in systematic reviews: a cross-sectional study of the contribution of non-English reports, unpublished studies and dissertations to the results of meta-analyses in child-relevant reviews. BMC Med. Res. Methodol. 17 (1), 64.
Heringer, G., Angulo, E., Ballesteros-Mejia, L., Capinha, C., Courchamp, F., Diagne, C., Duboscq-Carra, V., Nuñez, M., Zenni, R., 2021.The economic costs of biological inva-sions in Central and South America: afirst regional assessment. NeoBiota (Special Issue“economic costs of invasive alien species worldwide”. ) (in press).
Hickisch, R., Hodgetts, T., Johnson, P.J., Sillero-Zubiri, C., Tockner, K., Macdonald, D.W., 2019.
Effects of publication bias on conservation planning. Conserv. Biol. 33 (5), 1151–1163.
Hulme, P.E., 2011.Practitioner’s perspectives: introducing a different voice in applied ecology. J. Appl. Ecol. 48 (1), 1–2.
Ito, M., Wiesel, T., 2006.Cultural differences reduce Japanese researchers’ visibility on the web. Nature 444 (7121), 817.
Kirichenko, N., Haubrock, P., Cuthbert, R.N., Akulov, E., Karimova, E., Shneyder, Y., Liu, C., Angulo, E., Diagne, C., Courchamp, F., 2021.Economic costs of biological invasions in terrestrial ecosystems in Russia. NeoBiota (Special Issue“economic costs of inva-sive alien species worldwide” ) (in press).
Konno, K., Akasaka, M., Koshida, C., Katayama, N., Osada, N., Spake, R., Amano, T., 2020. Ig-noring non-English-language studies may bias ecological meta-analyses. Ecol. Evol. 10, 6373–6384.
Lazarev, V.S., Nazarovets, S.A., 2018.Don’t dismiss non-English citations. Nature 556 (7700), 174.
Liu, C., Diagne, C., Angulo, E., Barnerjee, A.K., Chen, Y., Cuthbert, R.N., Haubrock, P., Kirichenko, N., Pattison, Z., Watari, Y., Xiong, W., Courchamp, F., 2021.Economic costs of biological invasions in Asia. NeoBiota (Special Issue“economic costs of inva-sive alien species worldwide” ) (in press).
Lowry, E., Rollinson, E.J., Laybourn, A.J., Scott, T.E., Aiello-Lammens, M.E., Gray, S.M., Mickley, J., Gurevitch, J., 2013.Biological invasions: afield synopsis, systematic re-view, and database of the literature. Ecol. Evol. 3 (1), 182–196.
Nuñez, M.A., Pauchard, A., 2010.Biological invasions in developing and developed coun-tries: does one modelfit all? Biol. Invasions 12 (4), 707–714.
Nuñez, M.A., Barlow, J., Cadotte, M., Lucas, K., Newton, E., Pettorelli, N., Stephens, P.A., 2019.
Assessing the uneven global distribution of readership, submissions and publications in applied ecology: obvious problems without obvious solutions. J. Appl. Ecol. 56 (1), 4–9.
O'Neil, D., 2018.English as the lingua franca of international publishing. World Englishes 37 (2), 146–165.
Rose, D.C., Sutherland, W.J., Amano, T., González-Varo, J.P., Robertson, R.J., Simmons, B.I., Wauchope, H.S., Kovacs, E., Durán, A.M., Vadrot, A.B.M., Wu, E., Dias, M.P., Di Fonzo, M.M.I., Ivory, S., Norris, L., Nunes, M.H., Nyumba, T.O., Steiner, N., Vickery, J., Mukherjee, N., 2018.The major barriers to evidence-informed conservation policy and possible solutions. Conserv. Lett. 11 (5), e12564.
Salager-Meyer, F., 2008.Scientific publishing in developing countries: challenges for the future. J. Engl. Acad. Purp. 7 (2), 121–132.
SAS Institute Inc., 2018.SAS® Studio 3.8: User’s Guide. SAS Institute Inc, Cary, NC.
Sutherland, W.J., Taylor, N.G., MacFarlane, D., Amano, T., Christie, A.P., Dicks, L.V., Lemasson, A.J., Littlewood, N.A., Martin, P.A., Ockendon, N., Petrovan, S.O., Robertson, R.J., Rocha, R., Shackelford, G.E., Smith, R.K., Tyler, E.H.M., Wordley, C.F.R., 2019.Building a tool to overcome barriers in research-implementation spaces: the conservation evidence database. Biol. Conserv. 238, 108199.
Tao, J., Ding, C., Ho, Y.S., 2018.Publish translations of the best Chinese papers. Nature 557 (7706), 492–493.
Verde Arregoitia, L.D., González-Suárez, M., 2019.From conference abstract to publication in the conservation science literature. Conserv. Biol. 33 (5), 1164–1173.
Watari, Y., Komine, H., Angulo, E., Diagne, C., Ballesteros-Mejia, L., Courchamp, F., 2021.
First synthesis of the economic costs of biological invasions in Japan. NeoBiota (Spe-cial Issue“economic costs of invasive alien species worldwide” ) (in press).
Young, J.C., Rose, D.C., Mumby, H.S., Benitez-Capistros, F., Derrick, C.J., Finch, T., Garcia, C., Home, C., Marwaha, E., Morgans, C., Parkinson, S., Shah, J., Wilson, K.A., Mukherjee, N., 2018.A methodological guide to using and reporting on interviews in conservation science research. Methods Ecol. Evol. 9 (1), 10–19.
Zenni, R.D., Ziller, S.R., Pauchard, A., Rodriguez-Cabal, M., Nuñez, M.A., 2017.Invasion sci-ence in the developing world: a response to Ricciardi et al. Trends Ecol. Evol. 32 (11), 807–808.