HAL Id: hal-02568600
https://hal.inrae.fr/hal-02568600
Submitted on 9 May 2020HAL is a multi-disciplinary open access archive for the deposit and dissemination of sci-entific research documents, whether they are pub-lished or not. The documents may come from teaching and research institutions in France or abroad, or from public or private research centers.
L’archive ouverte pluridisciplinaire HAL, est destinée au dépôt et à la diffusion de documents scientifiques de niveau recherche, publiés ou non, émanant des établissements d’enseignement et de recherche français ou étrangers, des laboratoires publics ou privés.
Fate of a 15 N-labeled Urea Pulse in Heavily Fertilized
Banana Crops
Line Raphael, Sylvie Recous, Harry Ozier-Lafontaine, Jorge Sierra
To cite this version:
Line Raphael, Sylvie Recous, Harry Ozier-Lafontaine, Jorge Sierra. Fate of a 15 N-labeled Urea Pulse in Heavily Fertilized Banana Crops. Agronomy 2020, 2020, 10, �10.3390/agronomy10050666�. �hal-02568600�
Agronomy 2020, 10, 666; doi:10.3390/agronomy10050666 www.mdpi.com/journal/agronomy
Article
Fate of a
15N-labeled Urea Pulse in Heavily Fertilized
Banana Crops
Line Raphael 1,2, Sylvie Recous 3, Harry Ozier-Lafontaine 4 and Jorge Sierra 4,*
1 Cirad, Upr Geco, Le Lamentin, F-97285 Martinique, France; l.raphael@creilsudoise.fr 2 Agglomération Creil Sud Oise, F-60100 Creil, France
3 Université de Reims Champagne Ardenne, INRAE, FARE Laboratory, F-51100 Reims, France;
sylvie.recous@inrae.fr
4 INRAE, UR ASTRO, Petit-Bourg, F-97170 Guadeloupe, France; harry.ozier-lafontaine@inrae.fr
* Correspondence: jorge.sierra@inrae.fr
Received: 31 March 2020; Accepted: 21 April 2020; Published: 9 May 2020
Abstract: Banana crops in the Caribbean are characterized by the use of high rates of nitrogen (N)
fertilization which causes severe environmental damages. The aim of this study was to assess the fertilizer N use efficiency (NUE) of banana crops in the field. To do so, a field trial was carried out during the first (GS1) and the fourth (GS4) growing seasons of banana crops, and the fate of a 15 N-labeled pulse applied late in the growing season (flowering stage) was determined. At harvest, NUE (average 24% 15N applied) and the total recovery of fertilizer 15N in the soil–plant system (i.e., 40% in GS1 and 62% in GS4) were low. Low NUE resulted mainly from the dilution in a large soil mineral N pool derived from earlier applications of the labeled-N fertilizer applied at flowering, combined with leaching caused by numerous high-intensity rainfall events (>20 mm d−1). Crop residues from previous cycles present at time of fertilizer application in the fourth growing season, promoted fertilizer N immobilization, which in turn favored fertilizer N recovery by decreasing N leaching. The results suggest that N fertilization after the first season could be reduced by 30% (i.e., −90 kg N ha−1) corresponding to the suppression of two applications from flowering to harvest with the current fertilizer management, as available N derived from earlier applications is sufficient to meet plant requirements.
Keywords: Caribbean; N leaching; N recovery; N immobilization; NUE; tropical soil
1. Introduction
The management of export banana (Musa sp.) cropping systems in the humid tropics of the Caribbean and Latin America involves the use of large quantities of nitrogen (N) fertilizer (e.g., average 400 kg N ha−1 yr−1 [1,2]), which can cause severe and diffuse pollution of water resources [3]. Under Caribbean conditions, several authors have found that N leaching may account for as much as 50% of the added N fertilization because of high rainfall intensity in this region (2000–4000 mm yr−1) [4,5]. Despite these agronomic and environmental issues, banana production represents a key economic sector in these regions, which calls for cleaner banana systems through the more precise management of N inputs [6]. The framework of fertilization practices in banana systems is strongly dependent on factors such as plant structure, the system design, and climate, and as pointed out by Dorel et al. [5], it is difficult to match appropriate N availability and low N leaching in banana plantations.
Bananas crops are currently managed in semi-perennial plantations over 5–7 years. During the growing season, each plant (mother plant) produces suckers arising from lateral shoots (daughter plants), one of which is then selected and grown during the following season after the mother plant has been harvested [7]. A large quantity of crop residues is returned to the soil after harvesting the
mother plant, which may contribute to the nutrition of the daughter plant. In this sense, Raphael et al. [8] reported that plant uptake of N derived from residue decomposition accounts for 19% of N in bunches on the daughter plants and 18% of whole plant N at harvest. As N leaching may be very high in humid tropics, N fertilization is split between 8–12 applications during the growing season to achieve a total rate that ranges from 300 to 500 kg N ha−1 yr−1 [5]. These rates are two or three times greater than N uptake by the crop [4]. Moreover, because most root biomass lies in the upper 0.3 m soil layer and within 0.8 m of the banana stem [9,10], N fertilization is currently applied around the stem foot to enhance N uptake by the plant. However, this practice may dramatically increase N leaching because stemflow that is derived from rainfall interception by the banana canopy induces localized water input and drainage at the foot of the plant stem [11]. It can be hypothesized that N use efficiency (NUE) (i.e., the fraction of fertilizer N recovered in the crop) in current banana systems is quite low, depending on the impact of rainfall on N leaching.
Some studies have been carried out with the aim of reducing the N fertilization of banana crops and involved the use of intercropping with herbaceous legumes to incorporate N via biological fixation [12]; the contribution of the mother plant to the N nutrition of the daughter plant [13]; the effect of different fertigation systems on N uptake [14]; and tests of the timing, splitting, and placement of N fertilizer applications [15]. However, to our knowledge, no studies have yet addressed the question of the factors affecting NUE in heavily fertilized banana crops cultivated in the humid tropics. This is a crucial issue for export banana cropping systems in the small island states of the Caribbean because of the need to reduce pollution risks. Indeed, these risks are exacerbated under insular conditions because inhabited areas, coral reefs, and rainforests are all close to agricultural land.
The aim of this study was therefore to assess the NUE of banana crops and to identify the factors affecting it under field conditions. For this, we examined the fate of a single-pulse of 15N-labeled fertilizer applied late in the growing season within the plant and soil compartments of the cropping system. To assess the impact of crop residues on NUE, the field experiment was carried out during the first growing season, without crop residues, and during the fourth growing season, with banana crop residues returned each year during the three previous years. The 15N fertilizer was applied at flowering, while fertilization management throughout the growing seasons (application rates, timing, and placement) used by farmers was the same, which allowed us to evaluate NUE under real-life field conditions of soil N availability.
2. Materials and Methods
2.1. Experimental Site and Design of the Field Experiment
The field experiment was carried out at the Rivière Lézarde Experimental Station (14°37′ N, 60°58’ W, 30 m asl) of the International Center for Agronomic Research and Development (CIRAD) in Martinique (French Antilles in the Caribbean). At this site, the mean annual air temperature is 26 °C, and the mean annual rainfall is 2250 mm; about one-third of annual rainfall occurs within the period covered by the field experiment (October–January). The soil is a slightly acid, rust-brown halloysite Nitisol [16], developed on volcanic ash deposits. The soil is chemically and physically homogenous up to 0.5 m depth, which is due to the deep ploughing currently performed prior to banana planting. The trial included two 1 ha plots, 100 m apart, corresponding to two contrasted time-points in the pluriannual banana cycle (Musa spp., AAA group, cv. Cavendish Grande Naine): the first (GS1) and the fourth (GS4) growing seasons. Both plots presented very similar soil properties. The main characteristics of the 0–0.3 m soil layer were: clay 0.66 kg kg−1 for both plots, pH (water) 5.0 for GS1 and 5.1 for GS4, organic C 12.2 g kg−1 for GS1 and 12.4 g kg−1 for GS4, organic N 1.3 g kg−1 for GS1 and 1.2 g kg−1 for GS4, cation exchangeable capacity 15.9 cmol kg−1 for GS1 and 16.1 cmol kg−1 for GS4, and bulk density 0.9 Mg m−3 for both plots.
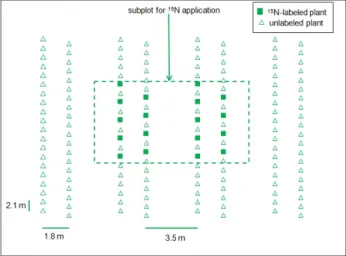
The distribution of plants within the plots was the same as that used by farmers in the Caribbean, which involves a double-row design (Figure 1) and a plant density of 1800 plants ha−1. The initially bare plot corresponding to the GS1 treatment was planted using healthy 6-week-old banana plants
grown in tissue culture. The plot corresponding to the GS4 treatment had been planted three years earlier in the same way as for GS1, and crop residues from the mother plants of the third growing season were present on the soil surface at the start of the trial. The fertilizer schedule before the field experiments was similar to that used by farmers, with a total N rate of 225 kg non-labeled N ha−1 split between five applications of 45 kg N ha−1 from planting (GS1) or cutting back the mother plants (GS4) (end of May 2004) to the beginning of the field trial at flowering (mid-October 2004). In these cases, non-labeled N was applied as solid urea around the stem foot. Phosphorus (90 kg P ha−1 as triple superphosphate) and potassium (140 kg K ha−1 as potassium sulphate) were applied at the time of the first N fertilizer application (i.e., planting in GS1 and cutting back in GS4).
Figure 1. Example of the experimental plot of banana crop including a subplot for 15N application.
The same design was applied to both the GS1 (first growing season) and GS4 (fourth growing season) treatments.
For the field experiment using 15N fertilizer, a 200 m2 subplot containing 36 banana plants was established for each treatment (Figure 1). The subplots were delimited by 60 cm high iron sheets inserted 0.5 m into the soil to prevent any 15N outflow from the subplots. In both treatments, the 15N fertilizer was applied at flowering on 10 October 2004. Applications of the labeled fertilizer (20 kg N ha−1 at 5.0 15N atom% excess) were made using an aqueous urea solution at a rate of 500 mL m−2, added directly to the soil in a circular band around the plant at 0.5 m from the stem in order to prevent plant contamination. In order to ensure uniform distribution of the labeled fertilizer in GS4, crop residues were removed carefully before application and returned to the site afterwards. The 15N fertilizer was applied to 18 plants of each treatment as indicated in Figure 1. Air temperature and rainfall during the experiments were recorded using a weather station located 50 m from the plots.
2.2. Plant and Soil Sampling
Plants were sampled at harvest (16 January 2005) using 8 plants selected at random from the 18 labeled plants of each treatment. Banana organs of each selected plant were sampled and treated separately (e.g., leaves, stem, fruit, roots, and the whole sucker). Therefore, there were 8 replicates for each plant organ within each treatment. Roots were extracted from the 0–0.4 m soil layer in a circular 0.5 m radius band around the stem using a fork. From the results reported in previous studies carried out on volcanic soils of French Antilles [10], our procedure of root sampling would allow to extract about 90% of the root biomass of banana plants. All the plant organs were washed, cut and weighed, and their dry matter was determined after oven-drying at 70 °C for 72 h. After this, an aliquot of the samples was ground at <0.2 mm for N and 15N analyses.
Soil from the subplots was sampled using an 8 cm diameter auger at 6, 17, 27, 42, and 98 (harvest) days after 15N application. Samples were taken at 0–0.1, 0.1–0.3, and 0.3–0.6 m depth at 0.5 m from the stem of 8 labeled plants selected at random within each treatment. At harvest, the soil was also sampled at a depth of 0.6–1.2 m. The soil was analyzed at each depth and replicate separately (i.e., 8
replicates for each soil layer within each treatment). At harvest, soil sampling was carried out just before plant sampling using the same labeled plants. Soil mineral N (NH4-N + NO3-N) was extracted from the soil by shaking for 4 h with 100 mL 0.5 M KCl, centrifuged, and then analyzed by continuous flow colorimetry [8]. Isotopic analysis of the mineral N in soil extracts was performed using the microdiffusion technique described by Fillery and Recous [17]. Nitrogen and 15N contents in soil organic matter (SOM) and plants were determined with a CHN elemental analyzer coupled to a mass spectrometer [18]. The inorganic 15N was completely removed from the moist soil by two successive KCl washings prior to the measurements of N and 15N contents in SOM. 15N concentrations were corrected for natural abundance using the reference values reported by Raphael et al. [8] for the soil and banana plants of a plot adjacent to those used for our study. We consider that the fraction of the labeled fertilizer N present in the organic soil N pool represents N immobilization of the added N (i.e., in microbial biomass and incorporated into SOM).
2.3. Calculations and Statistical Analysis
The fraction of the labeled fertilizer N recovered in the plant at harvest (NUE, in % labeled fertilizer N applied) was calculated as [19]:
NUE = [(15N atom%excess in plant × N in plant)/applied 15N] × 100 (1) where 15N atom%excess in plant refers to the measurements performed for each plant, N in plant (g N plant−1) is the N biomass of the plant, and applied 15N (g N plant−1) is the rate of 15N applied to each plant (i.e., 0.55 g 15N plant−1 in this study). Equation (1) was also applied to calculate the fertilizer N recovery in plant organs, knowing their N and 15N biomass, and in soil N fractions, knowing the N and 15N contents in the mineral and organic N fractions.
Differences between treatments, plant organs, and soil layers were assessed by ANOVA under a two-way design (treatment × plant or soil compartments) using the XLSTAT 2018.5 program. Each selected plant (or soil site) was considered as an individual taken at random from the population of 18 labeled plants of each treatment (i.e., 8 replicates were used for each plant and soil variable).
3. Results
3.1. Weather Conditions
Air temperature decreased gradually during the experiment from about 26.5 °C to 24.5 °C (Figure 2). Marked decreases in temperature were observed on days with high rainfall intensity (e.g., –1.9 °C between days 30 and 31 for 42 mm of rainfall). Rainfall did not display any particular trend over time but was rather characterized by high intensity events throughout the period of the experiment. The highest rainfall intensity was observed during the 27–42 day period, with an average value of 11 mm d−1 and 169 mm cumulated over the period. The other periods were slightly less wet (e.g., 6–7 mm d−1). The total rainfall during the trial was 768 mm (average 8 mm d−1), which represents 34% of the mean annual rainfall at the study site.
Figure 2. Rainfall and air temperature after the application of the 15N fertilizer at flowering (10 October
2004, Day 0). Arrows indicate the dates of soil sampling. The last soil sampling was carried out at harvest (16 January 2005, Day 98).
3.2. Dynamics of Soil N Fractions
The temporal pattern of soil mineral N content was similar under both the GS1 and GS4 treatments, with a gradual decrease in the 0–0.3 m layer during the experiments and a gradual increase in the 0.3–0.6 m layer (Figure 3). Thus, the proportion of soil mineral N present in the 0–0.3 m layer fell from 80% at Day 6 to about 40% at the end of the experiment (Day 98). Soil mineral N content in the 0–0.6 m layer was significantly higher for GS4 throughout the trial (i.e., average difference of +45 kg N ha−1), and differences between the treatments were greater for the 0–0.3 m layer (i.e., +30 kg N ha−1 in GS4) than for the 0.3–0.6 m layer (i.e., +15 kg N ha−1 in GS4) (p ≤ 0.05). The measurements performed at harvest in the 0.6–1.2 m layer indicated that the mineral N content was slightly higher in GS1 (25 kg N ha−1) than in GS4 (18 kg N ha−1) (p ≤ 0.05).
Figure 3. Temporal pattern of soil mineral N content in the (a) GS1 treatment (first growing season) and (b) GS4 treatment (fourth growing season). Vertical bars indicate the standard deviation (n = 8). For each sampling date, different lower-case letters indicate significant differences between soil layers within each treatment, and different capital letters indicate significant differences between treatments for each soil layer (p ≤ 0.05).
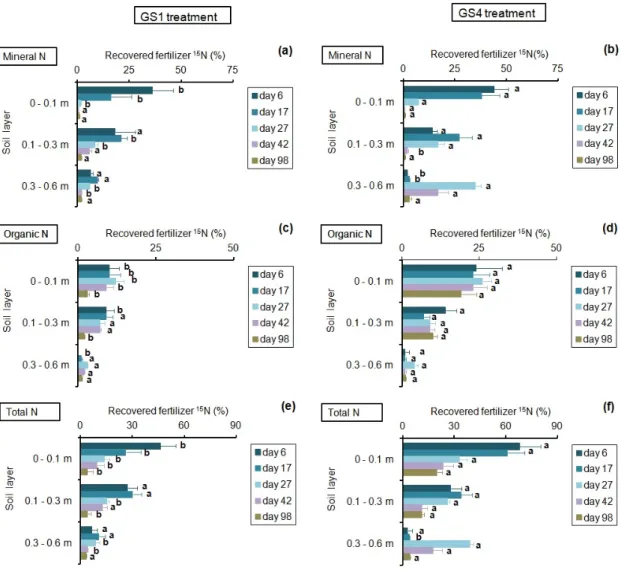
At the start of the experiment, fertilizer N applied at flowering was mostly recovered as mineral N in the topsoil (Figure 4). After Day 27, mineral N coming from the fertilizer was mainly observed below a depth of 0.1 m (Figure 4a,b). Considering the 0–0.6 m layer in both treatments, recovered mineral fertilizer N at Day 6 represented 62% of the added N, the level falling to 5% at Day 98. In that layer, recovered mineral fertilizer N was higher in GS4 from Day 17 to Day 42 (p ≤ 0.05). A significant fraction of the fertilizer N was recovered as organic N from the start of the experiment, mainly in the topsoil of the GS4 treatment (Figure 4c,d). For the 0–0.3 m layer, this fraction was significantly higher
for GS4 at all the sampling dates (p ≤ 0.05). The differences between the 0–0.1 m and 0.1–0.3 m layers were only significant for GS4 (p ≤ 0.05). Organic 15N was significantly lower in the 0.3–0.6 m layer (i.e., 1%–4% of the added fertilizer N) than in the topsoil, and no significant differences were observed between treatments for that layer (p ≤ 0.05). For the entire 0–0.6 m soil layer, the organic fraction averaged 35% in GS4 and 17% in GS1 (p ≤ 0.05), and was the main fertilizer N form found in the soil after Day 27 in GS1 and Day 42 in GS4 (Figure 4a–d). Total recovery of the fertilizer N in the 0–0.6 m layer (i.e., mineral N + organic N; Figure 4e,f) ranged from 98% at Day 6 to 35% at Day 98 in GS4, and from 80% at Day 6 to 11% at Day 98 in GS1. At harvest, 3% of the added 15N was recovered as mineral 15N in the 0.6–1.2 m layer under both treatments. No organic 15N was detected in that layer.
Figure 4. Fraction of the fertilizer 15N recovered as mineral, organic, and total N (mineral + organic)
in the different soil layers as a function of the time after fertilizer application. GS1 and GS4 refer to the first and the fourth growing seasons, respectively. Horizontal bars indicate the standard deviation (n = 8). For each sampling date and soil layer, different letters indicate significant differences between treatments (p ≤ 0.05).
3.3. Nitrogen Biomass and Fertilizer N Recovery in Plants at Harvest
The allocation of dry and N biomass in plant organs was very similar under both treatments, except for the fruit (Table 1). For this organ, dry mass (+41%) and biomass N (+58%) were higher for GS4 than for GS1 (p ≤ 0.05). Dry mass and N contents of the other plant organs were similar under both treatments (p ≤ 0.05). The recovery in plants of the labeled fertilizer N (NUE) was similar under both treatments (Table 2). NUE values were relatively low (i.e., average 24.5% for the whole plant), and the fruit accounted for 55% of that value under both treatments. The roots only accounted for 3% of recovered N in plants. The total recovery of fertilizer 15N at harvest in the soil–plant system (plant
+ 0–1.2 m soil depth) was about 40% for GS1 and 62% for GS4 (p ≤ 0.05). This difference in total 15N recovery was mainly due to difference in fertilizer 15N recovery in the topsoil (Table 2, Figure 4). At harvest, the recovery of fertilizer 15N in GS4 was higher in the soil than in plants, while the opposite was observed in GS1.
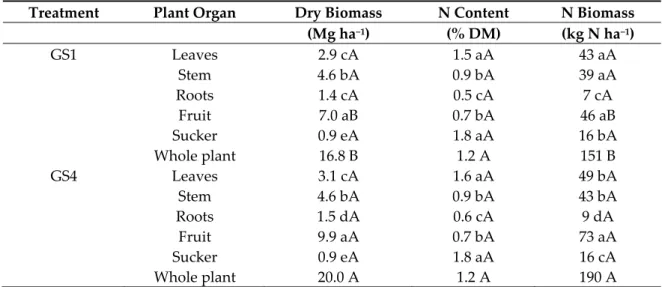
Table 1. Dry and N biomass allocation in plant organs at banana harvest. GS1 and GS4 refer to the first and the fourth growing seasons, respectively. Different lower-case letters indicate significant differences between plant organs within each treatment, and different capital letters indicate significant differences between treatments for each plant organ (p ≤ 0.05, n = 8).
Treatment Plant Organ Dry Biomass N Content N Biomass (Mg ha−1) (% DM) (kg N ha−1) GS1 Leaves 2.9 cA 1.5 aA 43 aA Stem 4.6 bA 0.9 bA 39 aA Roots 1.4 cA 0.5 cA 7 cA Fruit 7.0 aB 0.7 bA 46 aB Sucker 0.9 eA 1.8 aA 16 bA Whole plant 16.8 B 1.2 A 151 B GS4 Leaves 3.1 cA 1.6 aA 49 bA Stem 4.6 bA 0.9 bA 43 bA Roots 1.5 dA 0.6 cA 9 dA Fruit 9.9 aA 0.7 bA 73 aA Sucker 0.9 eA 1.8 aA 16 cA Whole plant 20.0 A 1.2 A 190 A
Table 2. Recovery of the fertilizer 15N in the plant–soil system at banana harvest. 15N was applied at
flowering. GS1 and GS4 refer to the first and the fourth growing seasons, respectively. Fertilizer 15N
recovery in the whole plant represents the N use efficiency (NUE, see Equation (1)). Different lower-case letters indicate significant differences between plant organs or soil layers within each treatment, and different capital letters indicate significant differences between treatments for each plant organ or soil layer (p ≤ 0.05, n = 8). Compartment Treatment GS1 GS4 Fertilizer 15N Recovery (%) Plant Leaves 4.6 bA 4.5 bA Stem 3.5 cA 3.2 cA Roots 0.8 eA 0.8 eA Fruit 14.2 aA 13.0 aA Sucker 2.5 dA 2.0 dA Total (NUE) 25.6 A 23.5 A Soil 0–0.3 m 8.0 aB 31.1 aA 0.3–1.2 m 6.2 aA 7.1 bA Total 14.2 B 38.2 A Plant + Soil 39.8 B 61.7 A 4. Discussion
4.1. Fate of Fertilizer N in Plants
Banana yield was higher in GS4 than in GS1, which is in line with the findings reported by Lassoudière [7] concerning the behavior of banana when it is managed as semi-perennial cropping
system. That author pointed out that when a plantation starts with plants grown by tissue culture, crop yields increase from the second growing season because of the rise in the number of fingers (single banana fruit) per hand (cluster of fingers) and the number of hands in the bunch. This is due to the fact that the sucker uses some of the resources (e.g., nutrients) and the vegetative structure of the mother plant (e.g., corm and root system), which favors the start of the daughter plant’s growth by reducing carbon (C) costs. Even if the higher soil N availability observed in the GS4 treatment could contribute to greater yield, it seems that this was a minor factor compared to the effect of the mother plant. Indeed, the soil mineral N content was relatively high in both treatments, even at harvest (i.e., 70 kg N ha−1 in GS1 and 117 kg N ha−1 in GS4), and it also appeared that yields were not limited by N availability. In fact, the available N content in the soil during the flowering–harvest period was always higher than the crop N uptake values reported by other authors for that period under the conditions of French Antilles (e.g., 40–60 kg N ha−1 [4,5]). In a study of banana crops at the same site as that used here, Raphael [4] observed that plant uptake from soil available N (i.e., including N from fertilizers and SOM mineralization) was twice lower in the fourth growing season than in the first season. In other words, the dependency of plant growth on the level of soil N availability diminishes throughout the plantation cycle because of the effect of the mother plant and the contribution of N released from the decomposition of crop residues [8].
The observed relative allocation of C and N among plant organs was similar to that reported by Castillo González et al. [13] for banana crops in the humid tropics of Mexico. The NUE values obtained at harvest indicated that the N-pulse applied at flowering was primarily allocated to the fruit. This agrees with the results reported by Ripoche et al. [15], who assumed in their modeling of banana growth that priority is given to the fruit regarding the allocation of N applied at flowering. The NUE values found for the whole plant were low but within the broad range of values reported in the literature. Relatively low NUE values have been reported for a great variety of cropping systems worldwide, e.g., 14%–20% for a maize crop in China [20], 22%–33% for maize intercropped with trees in the humid tropics [21], 23% for water yam in Ivory Coast [22]. Indeed, a comparison between these results and ours is difficult because of the many different pedoclimatic conditions and fertilizing practices (rate, timing, and placement) involved in each specific study.
4.2. Factors Affecting NUE and Fertilizer N Recovery
Two important results obtained during this study were the low values of NUE and of recovered fertilizer N. Low recovery of fertilizer N in field experiments (e.g., <50%) has previously been reported in the literature and was frequently attributed to N losses by leaching, denitrification, or volatilization [23,24]. From the results observed in our field trial, we consider that NUE and recovery of fertilizer N were strongly affected by the crop management through their effects on fertilizer N dilution in the soil, fertilizer-N leaching, and microbial immobilization.
4.2.1. Fertilizer N Dilution in the Soil
A first explanation for the low NUE of the N fertilizer applied at flowering is the dilution that occurred in soil after application due to the mixture of the applied N with a high content of non-labeled mineral N already present in the soil at the time of application. For example, at Day 6 only 10% of the total mineral N in the top 0.3 m soil layer of both treatments was derived from the labeled fertilizer (dilution 1/10) and decreased rapidly to 3% after Day 17 (dilution 1/33). These dilution values were even one third higher for the 0–0.6 m layer. Therefore, the low NUE observed in our experiment with late fertilizer application can be explained by the presence of available mineral N remaining from earlier applications (e.g., from planting to flowering in this study) in heavily fertilized banana systems. Indirectly, this also suggests that the late application of N fertilizer was unnecessary for plant nutrition.
4.2.2. N Leaching
During the present study, evidence of N leaching was highlighted by a lowering of the soil mineral N content in the topsoil, and its simultaneous rise in the 0.3–0.6 m layer throughout the experiments. In addition, the presence of mineral and as well as organic 15N in the 0.3–0.6 m layer at Days 6–17 indicated that fertilizer N was rapidly leached from the soil surface to a depth of 0.6 m at that time, which was probably caused by the high intensity rainfall that occurred on Day 4 (25 mm) and Day 16 (24 mm). Similarly, the significant rise in soil mineral N in the 0.3–0.6 m layer observed in both treatments between Days 17 and 27 was probably associated with the cumulated 44 mm of rain that fell between Days 18 and 20. The recovery of mineral 15N from the 0.6–1.2 m layer at harvest further indicated that N leaching concerned the entire soil profile. From these results, it appears that most of the unrecovered fertilizer N in the plant-soil system at harvest was linked to N leached below 1.2 m.
The low NUE observed at harvest could also be partially explained by N leaching since a fraction of fertilizer N was observed below the depth of root exploration, e.g., 0.7 m for volcanic soils of French Antilles [10]. It is well known that these soils are characterized by high water drainage [25], which may represent one third of annual rainfall [11]. Nitrogen leaching in these soils is exacerbated under banana crops because stemflow may increase water drainage around the stem up to six-fold compared to the inter-rows [11]. Several studies carried out on banana crops under the conditions of French Antilles have reported N losses by leaching equivalent to 40%–50% of the applied fertilizer N [5,11]. Nitrogen losses by ammonia volatilization could be discounted during our study because this process is negligible in volcanic acid soils of that region [26]. On the other hand, we think that N losses by denitrification were negligible because high hydraulic conductivity ensures a rapid oxygen supply to the soil profile after a rainfall event, which does not favor the development of anaerobic sites [27].
4.2.3. N Immobilization
Immobilization of the added N started soon after fertilizer application at flowering and concerned a large fraction of fertilizer N. Our results are in line with those reported by Clermont-Dauphin et al. [28], who observed a considerable increase in soil organic N in highly N fertilized banana monocropping systems (i.e., >20 yrs) in the French Antilles. Indeed, fertilizer N recovered as organic N in the GS4 treatment (i.e., an average of 35% in the 0–0.6 m layer) was much higher than the values reported for other crops, e.g., 15% N applied in the 0–0.4 m soil layer under winter wheat [18] and 9% under young citrus trees [29]. From our results, it appears that the high fertilizer N immobilization observed in the GS4 treatment would be linked to the high available C derived from decomposing crop residues. From the results reported by Raphael et al. [8] on banana residue decomposition, we assume that 15% of the initial crop residue biomass arising from the previous crop (i.e., 0.9 Mg DM ha−1) was still present on the soil surface at flowering in GS4. Differences in immobilized fertilizer N between GS1 and GS4 were also observed in the 0.1–0.3 m layer, which suggests that in GS4, soluble C derived from residue decomposition reached that layer and contributed to N immobilization. Therefore, we conclude that higher N immobilization in the 0–0.6 m layer of GS4 contributed to increase total fertilizer N recovery by reducing N leaching in this treatment.
4.3. Overview of Fertilizer N Dynamics in Banana Crops
The 15N approach used in this study revealed that the low NUE of the N fertilizer applied late in the growing season of banana crops (e.g., at flowering) was primarily caused by its considerable dilution in the soil mineral N derived from earlier N applications. Although a debate regarding the impact of fertilizer N dilution on NUE is generally lacking in the literature concerning NUE, because it is of minor importance in most cropping systems, this is a key factor in heavily fertilized banana crops in the humid tropics because of the high rate of N fertilization applied prior to flowering. The high fertilizer N dilution translates into a low plant uptake of the added N, which in turn increases
the risk of N leaching. Even if N immobilization of added N, enhanced by residue decomposition, might also affect NUE, this should be regarded as a transient soil process that reduces leaching during the growing season and increases the labile soil N pool in the topsoil that can then become available to daughter plants.
In terms of the current management of banana cropping systems, it appears that N fertilization applied late in the season could be substantially reduced because the remaining available N is sufficient to cover the requirements of plants between flowering and harvest, despite N losses. This reduction could reach at least −90 kg N ha−1 (e.g., suppression of two applications of 45 kg N ha−1 from flowering to harvest), corresponding to about 30% of the total N fertilization rate, which in turn would contribute to reducing risks of pollution. This fertilization scheme could mainly be applied after the first growing season when the presence of crop residues on the soil may play a key role in reducing N leaching by promoting N immobilization. To achieve this, further work is necessary to assess the effect of the immobilized N on crop nutrition in the following growing season.
Author Contributions: Conceptualization, L.R., S.R., H.O.-L and J.S.; methodology, L.R., S.R. and J.S.; project administration, H.O.-L.; formal analysis, L.R., S.R. and J.S.; writing—original draft preparation, L.R., S.R. and J.S. All authors have read and agreed to the published version of the manuscript.
Funding: This research was funded by the Territorial Community of Martinique and the International Center for Agronomic Research and Development (CIRAD, France).
Acknowledgments: We thank Victoria Hawken for reviewing the English manuscript.
Conflicts of Interest: The authors declare no conflict of interest. The funders had no role in the design of the study; in the collection, analyses, or interpretation of data; in the writing of the manuscript, or in the decision to publish the results.
References
1. Aryal, D.R.; Geissen, V.; Ponce-Mendoza, A.; Ramos-Reyes, R.R.; Becker, M. Water quality under intensive banana production and extensive pastureland in tropical Mexico. J. Plant Nutr. Soil Sci. 2012, 175, 553–559. 2. Agreste Guadeloupe La Culture de la Banane. Premiers Résultats de L’enquête Statistique Réalisée en 2016
Auprès de 128 Bananeraies en Guadeloupe. Available online: http://daaf.guadeloupe.agriculture.gouv.fr/IMG/pdf/Agreste_Banane_24052018_cle8fa1f4.pdf (accessed on 14 December 2019). (In French)
3. FAO Good Agricultural Practices for Bananas. World Banana Forum. Available online:
http://www.fao.org/3/a-i6917e.pdf (accessed 31 January 2020).
4. Raphael, L. Biodisponibilité de L’azote en Cultures Bananières sur Nitisol. Ph.D. Thesis, Université des Antilles, Guadeloupe, France, 2006. (In French)
5. Dorel, M.; Achard, R.; Tixier, P. SIMBA-N: Modeling nitrogen dynamics in banana populations in wet
tropical climate. Application to fertilization management in the Caribbean. Eur. J. Agron. 2008, 29, 38–45. 6. Chopin, P.; Tirolien, J.; Blazy, J.M. Ex-ante sustainability assessment of cleaner banana production systems.
J. Clean. Prod. 2016, 139, 15–24.
7. Lassoudière, A. Le Bananier et sa Culture; Editions Quæ: Versailles, France, 2007. (In French)
8. Raphael, L.; Sierra, J.; Recous, S.; Ozier-Lafontaine, H.; Desfontaines, L. Soil turnover of crop residues from the banana (Musa AAA cv. Petite-Naine) mother plant and simultaneous uptake by the daughter plant of released nitrogen. Eur. J. Agron. 2012, 38, 117–123.
9. Kashaija, I.N.; McIntyre, B.D.; Ssali, H.; Kizito, F. Spatial distribution of roots, nematode populations and root necrosis in highland banana in Uganda. Nematology 2004, 6, 7–12.
10. Dorel, M.; Lakhia, S.; Pététin, C.; Bouamer, S.; Risède, J.M. No-till banana planting on crop residue mulch: Effect on soil quality and crop functioning. Fruits 2010, 65, 55–68.
11. Sansoulet, J.; Cabidoche, Y.M.; Cattan, P. Adsorption and transport of nitrate and potassium in an Andosol under banana (Guadeloupe, French West Indies). Eur. J. Soil Sci. 2007, 58, 478–489.
12. Perin, A.; Guerra, J.G.M.; Espindola, J.A.A.; Teixeira, M.G.; Busquet, R.N.B. Banana plant performance intercropping with perennial herbaceous legumes. Cienc. Agrotecnologia 2009, 33, 1511–1517.
13. Castillo González, A.M.; Hernández Maruri, J.A.; Avitia García, E.; Pineda Pineda, J.; Valdéz Aguilar, L.A.; Corona Torres, T. Macronutrient extraction in banana “Dominico” (Musa spp.). Phyton 2011, 80, 65–72.
14. de Melo, A.S.; da Silva, C.D.; Fernandes, P.D.; Sobral, L.F.; Brito, M.E.B.; Dantas, J.D.M. Alteration of the physiologic characteristics in banana under fertirrigation conditions. Cienc. Rural. 2009, 39, 733–741. 15. Ripoche, A.; Achard, R.; Laurens, A.; Tixier, P. Modeling spatial partitioning of light and nitrogen resources
in banana cover-cropping systems. Eur. J. Agron. 2012, 41, 81–91.
16. FAO FAO/Unesco Soil Map of the World. World Soil Resources Report 60; FAO: Rome, Italy, 1988.
17. Fillery, I.R.P.; Recous, S. Use of enriched 15N sources to study soil N transformations. In Stable Isotope Techniques in the Study of Biological Processes and Functioning of Ecosystems; Unkovich, M., Pate, J., McNeill,
A., Gibbs, D.J., Eds.; Kluwer Acadmic Publisher: Dordrecht, The Netherlands, 2001; Volume 40, pp. 167– 194.
18. Recous, S.; Machet, J.M. Short term immobilization and crop uptake of fertilizer N applied to winter wheat: Effect of date of application in spring. Plant Soil 1999, 206, 137–149.
19. Peng, W.; Zeng, Y.; Shi, Q.; Huang, S. Responses of rice yield and the fate of fertilizer nitrogen to soil organic carbon. Plant Soil Environ. 2017, 63, 416–421.
20. Jiang, C.; Lu, D.; Zu, C.; Shen, J.; Wang, S.; Guo, Z.; Zhou, J.; Wang, H. One-time root-zone N fertilization increases maize yield, NUE and reduces soil N losses in lime concretion black soil. Sci. Rep. 2018, 8, 10258. doi:10.1038/s41598-018-28642-0.
21. Rowe, E.C.; Van Noordwijk, M.; Suprayogo, D.; Cadisch, G. Nitrogen use efficiency of monoculture and hedgerow intercropping in the humid tropics. Plant Soil 2005, 268, 61–74.
22. Hgaza, V.K.; Diby, L.N.; Oberson, A.; Tschannen, A.; Tié, B.T.; Sangakkara, U.R.; Aké, S.; Frossard, E. Nitrogen use by yam as affected by mineral fertilizer application. Agron. J. 2012, 104, 1558–1568.
23. McSwiney, C.P.; Snapp, S.S.; Gentry, L.E. Use of N immobilization to tighten the N cycle in conventional agroecosystems. Ecol. Appl. 2010, 20, 648–662.
24. Couto-Vázquez, A.; González-Prieto, S.J. Fate of 15N-fertilizers in the soil-plant system of a forage rotation
under conservation and plough tillage. Soil Till. Res. 2016, 161, 10–18.
25. Cabidoche, Y.M.; Achard, R.; Cattan, P.; Clermont-Dauphin, C.; Massat, F.; Sansoulet, J. Long-term pollution by chlordecone of tropical volcanic soils in the French West Indies: A simple leaching model accounts for current residue. Environ. Pollut. 2009, 157, 1697–1705.
26. Sierra, J.; Fontaine, S.; Desfontaines, L. Factors controlling N mineralization, nitrification, and nitrogen losses in an Oxisol amended with sewage sludge. Soil Res. 2001, 39, 519–534.
27. Sierra, J.; Renault, P. Temporal pattern of oxygen concentration in a hydromorphic soil. Soil Sci. Soc. Am. J. 1998, 62, 1398–1405.
28. Clermont-Dauphin, C.; Cabidoche, Y.M.; Meynard, J.M. Effects of intensive mono-cropping of bananas on properties of volcanic soils in the uplands of the French West Indies. Soil Use Manag. 2004, 20, 105–113. 29. Martínez-Alcántara, B.; Quiñones, A.; Legaz, F.; Primo-Millo, E. Nitrogen-use efficiency of young citrus
trees as influenced by the timing of fertilizer application. J. Plant Nutr. Soil Sci. 2012, 175, 282–292. © 2020 by the authors. Licensee MDPI, Basel, Switzerland. This article is an open access article distributed under the terms and conditions of the Creative Commons Attribution (CC BY) license (http://creativecommons.org/licenses/by/4.0/).

![[PDF] Cours MySQL pour debutant enjeux et pratique | Cours mysql](data:image/gif;base64,R0lGODlhAQABAIAAAP///wAAACH5BAEAAAAALAAAAAABAAEAAAICRAEAOw==)