HAL Id: hal-01567924
https://hal.archives-ouvertes.fr/hal-01567924
Submitted on 5 May 2018
HAL is a multi-disciplinary open access
archive for the deposit and dissemination of
sci-entific research documents, whether they are
pub-lished or not. The documents may come from
teaching and research institutions in France or
abroad, or from public or private research centers.
L’archive ouverte pluridisciplinaire HAL, est
destinée au dépôt et à la diffusion de documents
scientifiques de niveau recherche, publiés ou non,
émanant des établissements d’enseignement et de
recherche français ou étrangers, des laboratoires
publics ou privés.
How effectively can HIV phylogenies be used to measure
heritability?
George Shirreff, Samuel Alizon, Anne Cori, Huldrych F Guenthard, Oliver
Laeyendecker, Ard Sighem, Daniela Bezemer, Christophe Fraser
To cite this version:
George Shirreff, Samuel Alizon, Anne Cori, Huldrych F Guenthard, Oliver Laeyendecker, et al.. How
effectively can HIV phylogenies be used to measure heritability?. Evolution, Medicine, and Public
Health, Oxford : Oxford University Press, 2013, 2013 (1), pp.209-24. �10.1093/emph/eot019�.
�hal-01567924�
Evolution, Medicine, and Public Health [2013] pp. 209–224 doi:10.1093/emph/eot019
How effectively can HIV
phylogenies be used to
measure heritability?
George Shirreff*
1,2, Samuel Alizon
3, Anne Cori
1, Huldrych F. Gu
¨nthard
4,
Oliver Laeyendecker
5,6, Ard van Sighem
7, Daniela Bezemer
7and Christophe Fraser
1 1Medical Research Council Centre for Outbreak Analysis and Modelling, Department of Infectious Disease Epidemiology,Imperial College, London, UK;2Institute for Integrative Biology, ETH Zu¨rich, Zu¨rich, Switzerland;3Lab MIVEGEC UMR CNRS 5290, IRD 224, UM1, UM2, Montpellier, France;4Division of Infectious Diseases and Hospital Epidemiology, University Hospital of Zu¨rich, University of Zu¨rich, Zu¨rich, Switzerland;5National Institute of Allergy and Infectious Diseases, National Institutes of Health, Baltimore, MD, USA;6Department of Medicine, Johns Hopkins University School of Medicine, Baltimore, MD, USA; and7Stichting HIV Monitoring, Amsterdam, The Netherlands
*Correspondence address. Institute for Integrative Biology, ETH Zu¨rich, Universita¨tstrasse 16, 8092 Zu¨rich, Switzerland. Tel/Fax:+41(0)446320659; E-mail:george.shirreff@env.ethz.ch
Received 20 May 2013; revised version accepted 10 September 2013
A B S T R A C T
Background and objectives: The severity of HIV-1 infection, measured by set-point viral load (SPVL), is highly variable between individuals. Its heritability between infections quantifies the control the patho-gen patho-genotype has over disease severity. Heritability estimates vary widely between studies, but differ-ences in methods make comparison difficult. Phylogenetic comparative analysis offers measures of phylogenetic signal, but it is unclear how to interpret them in terms of the fraction of variance in SPVL controlled by the virus genotype.
Methodology: We present computational methods which link statistics summarizing phylogenetic
sig-nal to heritability, h2 in order to test for and quantify it. We re-analyse data from Switzerland and
Uganda, and apply it to new data from the Netherlands. We systematically compare established and new (e.g. phylogenetic pairs, PP) phylogenetic signal statistics.
Results: Heritability estimates varied by method and dataset. Several methods were consistently able to
detect simulated heritability above h2
! 0:4, but none below. Pagel’s ! was the most robust and sensitive. The PP method found no heritability in the Netherlands data, whereas Pagel’s ! found
sig-nificant heritability only in a narrow subdivision (P = 0.038). Heritability was estimated at h2= 0.52 (95%
confidence interval 0.00–0.63).
Conclusions and implications: This standardized measure, h2, allows comparability of heritability
between cohorts. We confirm high heritability in Swiss data, but neither in Ugandan data nor in the Netherlands, where it is barely significant or undetectable. Existing phylogenetic methods are ill-suited
for detecting heritability below h2! 0:4, which may nonetheless be biologically important.
K E Y W O R D S : HIV-1; heritability; phylogenetic comparative analysis; set-point viral load; phylogenetic signal; virulence
orig inal r e s e a r c h a r t i c l e
! The Author(s) 2013. Published by Oxford University Press on behalf of the Foundation for Evolution, Medicine, and Public Health. This is an Open Access article distributed under the terms of the Creative Commons Attribution License (http://creativecommons.org/licenses/by/3.0/), which permits unrestricted reuse, distribution, and reproduction in any medium, provided the original work is properly cited.
by guest on November 3, 2013 http://emph.oxfordjournals.org/ Downloaded from by guest on November 3, 2013 http://emph.oxfordjournals.org/ Downloaded from by guest on November 3, 2013 http://emph.oxfordjournals.org/ Downloaded from by guest on November 3, 2013 http://emph.oxfordjournals.org/ Downloaded from by guest on November 3, 2013 http://emph.oxfordjournals.org/ Downloaded from by guest on November 3, 2013 http://emph.oxfordjournals.org/ Downloaded from by guest on November 3, 2013 http://emph.oxfordjournals.org/ Downloaded from by guest on November 3, 2013 http://emph.oxfordjournals.org/ Downloaded from by guest on November 3, 2013 http://emph.oxfordjournals.org/ Downloaded from by guest on November 3, 2013 http://emph.oxfordjournals.org/ Downloaded from by guest on November 3, 2013 http://emph.oxfordjournals.org/ Downloaded from by guest on November 3, 2013 http://emph.oxfordjournals.org/ Downloaded from by guest on November 3, 2013 http://emph.oxfordjournals.org/ Downloaded from by guest on November 3, 2013 http://emph.oxfordjournals.org/ Downloaded from by guest on November 3, 2013 http://emph.oxfordjournals.org/ Downloaded from by guest on November 3, 2013 http://emph.oxfordjournals.org/ Downloaded from
BACKGROUND AND OBJECTIVES
HIV has a high mutation rate [1,2] and daily turnover [3,4] and therefore adapts rapidly under local select-ive pressure from the immune system [5,6,7] or antiretroviral drugs [8,9]. Increasingly there is inter-est in the transmission of escape [10,11] or drug resistance mutations [12], which may enable viral adaptation to the host population. The rate at which a trait evolves in response to natural selection is determined by its heritability.
Recent work has suggested that virulence may also evolve at the population level [13] by natural selection towards a level optimal for transmission [14,15]. Variation in virulence has a large impact on mortality and morbidity, so its evolutionary potential may present challenges or provide opportunities in public health interventions [16]. For example, vac-cines which reduce growth rate or toxicity are pre-dicted to reduce the costs of virulence, to the vaccinated host and the pathogen. This potentially raises the optimal virulence, resulting in poorer out-comes for the unvaccinated individuals [17].
Virulence in HIV is well approximated by set-point viral load (SPVL), which refers to the density of vir-ions in the blood during asymptomatic infection. SPVL is an early prognostic indicator for AIDS, as it varies by orders of magnitude between individuals, with high values having faster CD4 cell decline, pro-gressing more rapidly to AIDS and death [18,19,20]. However, it is relatively stable within the individual [21] meaning that it can be measured at a wide range of time points in an individuals’ infection [22].
Many host factors influence SPVL (Human Leukocyte Antigen (HLA) type (reviewed in [23])), sex [24], ethnicity [25], age [26], co-infections [27,
28]). Specific human genetic markers have been identified to which 13% of SPVL variation can be attributed, with a further 9% explained by age, sex and population structure [29]. Recently, several studies have indicated that viral factors play a sub-stantial role in SPVL variation by measuring its her-itability between infections (reviewed in [30]). Most of these quantify the similarity in SPVL within trans-mission pairs, which are sexual couples in which one has infected the other [31–34].
The phenotype of any organism is controlled partly by its genome, and partly by its environment. Throughout this work we define heritability, h2, in the broad sense as the proportion of total phenotypic variance ("2
P) ascribed to genetic variance ("2G)
[equation (1), [35]]. In the environmental component
of variance, "2
E, we conceptually include all host
gen-etic and non-gengen-etic effects, as well as interactions between host and virus genotype.
h2¼" 2 G "2 P : ð1Þ
Alizon et al. [36] used a phylogenetic comparative approach to identify phylogenetic signal as a meas-ure of heritability, without requiring behavioural data. Phylogenetic signal is the extent to which indi-viduals with similar traits can be observed to cluster together on the phylogeny. This approach has the advantage that any sample of well-characterized pa-tients could be analysed in this way. However, the authors did not account for cofactors such as age and co-infections, which influence the SPVL and may cluster together on the phylogeny. It is also uncertain exactly how the quantity measured by the two methods used (Pagel’s ! and Blomberg’s K) should be interpreted in the context of heritability. We herein propose a new approach which also uses only the phylogenetic relationships to determine genetic proximity of viruses, but additionally links the results to true heritability, and in some cases allows inclu-sion of the effect of cofactors on SPVL.
The aims of this study were to evaluate the phylo-genetic approach for estimating heritability, to com-pare the efficacy of the various statistics available for quantifying heritability on simulated and real data, to use these methods to confirm the presence of herit-ability in previously analysed data, and to measure heritability in a dataset from the Netherlands which has not been previously analysed for this purpose.
METHODOLOGY
Data
Data from Rakai, Uganda
The study population was enrolled in the Rakai Community Cohort Study in the rural Rakai District of south-western Uganda. The study methods for this cohort have been outlined elsewhere [34,37,
38]. We used those individuals who were sampled at a single time point in April 1995 (n = 332). Characteristics of the cohort are shown in
Supplementary Table S1. Serum samples were used
to measure SPVL, with most individuals providing a single measurement.
The phylogenetic analysis was conducted in RAxML [39] using the General Time Reversible
substitution model [40], the ! model of rate hetero-geneity with four distinct rate categories and a pro-portion of invariant sites [41] (GTR+!+I), which had the best score when the alignment was analysed with ModelTest [42]. The alignment was also analysed using the Recombination Analysis Tool (RAT [43]), which found no apparent recombination within the studied genes (data not shown).
A Simian Immunodeficiency Virus (SIV) outgroup was included (accession number: AB177846.1). The phylogeny was constructed from either the gp41 (env) or p24 (gag) sequences (Supplementary Figs S1andS2), which were analysed separately because they have different substitution rates [44]. We also performed the phylogenetic and heritability analysis on the subtype A and D sequences separately, due to apparent imbalance in the joint trees.
Data from Switzerland
The Swiss data were taken from the Swiss HIV Cohort Study and its integrated genotypic drug re-sistance database which has been described else-where [45,46], and the specific selection has been analysed in previous work [36,47, 48]. The phyl-ogeny, constructed from the reverse transcriptase and protease components of the pol gene
(Supplementary Fig. S3), had been inferred in this
previous work [36] using PhyML [49] from subtype B infected individuals for whom at least three viral load measurements were available after primary infection and before anti-retroviral therapy (n = 661). Characteristics of the cohort are shown in
Supplementary Table S2.
Note that PhyML was used for the Swiss data, compared with RAxML in the other two datasets. However, we expect the methods to produce very similar results as both use a hill-climbing algorithm, likelihood scores are well matched when using the same nucleotide substitution model, and there is no evidence for systematic differences in the results [50]. We analysed four subdivisions of the data as in previous work [36]. The entire dataset (‘All’) fit the Liberal definition for viral load variability, meaning that at least three consecutive viral load measure-ments within the asymptomatic window (6–36 months after first positive viral RNA) remained within a one-log band of one another. The ‘Strict’ subdivision included only those individuals for whom the measurements in the asymptomatic win-dow all sat within the one-log band. Excluding all but men who have sex with men (MSM) led to the further subdivisions, ‘MSM’ and ‘MSM Strict’.
Data from Netherlands
The study cohort was provided by the ATHENA na-tional observana-tional cohort (seroconverters from 1996 or onwards) and the Amsterdam Cohort Studies (seroconverters before 1996) [51]. We included only individuals infected with subtype B between 1985 and 2008, for whom appropriate gen-etic data and SPVL were available [52] (n = 416).
We define SPVL as the mean of all log10viral load
measurements taken 6–24 months after the mid-point between the last negative and the first positive diagnosis. The phylogeny was reconstructed using a sequence of length 2064 containing the same elem-ents of the pol gene as for the Swiss data.
We excluded codons strongly associated with drug resistance mutations (for details, see
Supplementary Fig. S4). Four subtype C individuals
from the same cohort were used as the outgroup. The phylogenetic analysis was performed using ModelTest [42], RAxML [39] and RAT [43] in the same way as the Rakai cohort, which also identified the same nucleotide substitution model as appropriate, and no recombination was detected (data not shown).
As with the Swiss data, individuals were categorized as ‘All’, ‘Strict’, ‘MSM’ and ‘MSM Strict’. Additionally, two further categories, ‘MSM NL’ and ‘MSM Strict NL’, were created from the ‘MSM’ groups, which excluded individuals not originating in the Netherlands in order to further reduce confounding factors.
Trees for simulations were read and manipulated using the ape package [53] in R [54], which was also used to plot the trees.
Methods for calculating heritability statistics
A phylogeny, reconstructed from genetic data, is an approximation of the transmission network. Phylogenetic signal is a measure of how well trait values at the tree tips match their relative positions on the phylogeny, and several established methods are available to quantify this signal in terms of a single statistic: the Mantel test [55]; Blomberg’s in-dependent contrasts, which give us the Blomberg’s K and PICv (variance of phylogenetic independent contrasts) statistics [56]; Pagel’s ! transformation [57]; and the Abouheif–Moran (AM) tests [58], of which there are five variants (‘oriAbouheif’, ‘sumDD’, ‘nNodes’, ‘patristic’, ‘Abouheif’, with the latter used by default). We also developed two new methods which allow control of cofactors, the
phylogenetic pairs (PP) method and the hierarchical clustering (HC) method, which are described briefly here.
The PP method identifies pairs of individuals on the tree which are each other’s closest neighbour, and these are assumed to be transmission pairs. Analysis of variance (ANOVA) identifies the degree to which the transmission partner explains an indi-vidual’s SPVL. Crucially, the ANOVA approach allows for the inclusion of cofactors. These are age, sex and genital ulcer disease in the Rakai dataset
(Supplementary Table S1); age, sex and risk group
in the Swiss dataset (Supplementary Table S2); and age, sex, risk group, region of origin and the type of assay used to measure viral load in the Netherlands dataset (Supplementary Table S3). This method also ignores individuals who are not part of a phylogen-etic pair.
The HC method is similar but considers larger clusters of individuals identified on the phylogeny by a threshold branch length, and examines the amount of variance in SPVL explained by the cluster. Because there is no intuitive ideal cluster size, pro-portion included or number of clusters to use, the method integrates over the range of clustering distances.
All established and new methods are described in detail in theSupplementary data.
Randomization test
The significance of a test statistic can be measured as in [56] by comparing the statistic derived from the data with its distribution under no heritability, which is the null hypothesis. Randomizing the tips of the tree by randomly reallocating the tips scrambles any heritability signal. This is performed 1000 times, and the analysis is repeated for each. The proportion of randomized datasets that give a statistic higher than the true value is the one-tailed P-value for presence of heritability. When the randomization test was per-formed for the PP and HC statistics the cofactors remained with their corresponding SPVL data.
Method of simulating SPVL data on a known phylogeny
This method uses a simple algorithm to simulate evolution of a continuous trait on a known phylogeny for a given heritability. This method is similar to that used in previous work [36] and is a variation on the Ornstein–Uhlenbeck process [59,60], which allows
Brownian motion to occur while constraining the distribution of the population.
During the simulation, each node on the tree is assigned a trait value in log10SPVL, beginning from
the root, which is assigned the mean of the true SPVL data. Each daughter node is given a SPVL value de-pending on that of its parent, and on the SPVL dis-tribution in the whole population. The higher the heritability, the more the value depends on the parent.
The SPVL at each subsequent daughter node,
VD [equation (2)], is derived from the parent
node, VP, the value h2, and the random variable
M which is normally distributed according to the mean and variance of the population log10 SPVL
(distribution 3). VD¼ h2VP+M ffiffiffiffiffiffiffiffiffiffiffiffiffiffiffiffiffiffi 1% ðh2Þ2 q , ð2Þ M & Nð "#,"2PÞ: ð3Þ
The value h2is therefore the regression slope be-tween the trait values at a parent node, VP, and a
daughter node, VD(or an index and secondary case).
This has been demonstrated to be equal to the broad sense heritability, h2as defined inequation (1)[61], and its further implications are discussed in the
Supplementary data. The result is a set of data at
the tips of the tree, simulated with known heritability h2, which is used for analysis. We have also explored an alternative method of simulation which allows for multiple transmission between nodes on the tree, which is also described in theSupplementary data.
Multiple hypothesis testing to estimating true heritability and confidence intervals
For each value of h2between 0 and 1, in increments of 0.01, 100 simulations are performed and the rele-vant phylogenetic comparative statistics is calculated. A hypothesis test for the particular h2is then performed with these 100 values. They are compared with the statistic calculated from the true data, and the proportion which is lower than the true statistic becomes the probability P that the data are consistent with that value of h2. The values of h2 which produce P-values closest to
0.025, 0.975 and 0.500 become the lower and upper 95% confidence bounds, and the median estimate of h2, respectively.
A visual distribution of h2 is estimated using approximate Bayesian computation (ABC), of which details are given in theSupplementary data.
Estimate power to detect an effect
To examine the ability of each statistic to detect non-null heritability, we simulated 100 datasets for each value of a range (0–1) of h2values in increments of
0.05. To visualize the relationship between h2and the statistic of interest, we calculated the mean and standard deviation of the phylogenetic comparative statistics calculated from these 100 simulations. In order to estimate the power of each statistic to detect a significant effect at each value of h2, we performed a randomization test on each simulated dataset, as described above (see ‘Randomization test’), but with 100 randomizations. For each simulated dataset, the proportion of randomization tests which find signifi-cant (P < 0:05) heritability represents the power to detect an effect at that value of h2.
All methods are available in R code on request from the corresponding author.
RESULTS
Testing significance in previously analysed data
The significance of heritability from the randomization test for the Rakai and Swiss data is shown inTables 1and2, respectively.
A consistent signal was not found in the Rakai data (Table 1), but in the Swiss data it was more
so (Table 2), and was higher for the smaller
subdiv-isions. We tested the possibility that high signifi-cance in the smallest group was an artefact of small tree size, but this was not the case
(Supplementary Table S5). We also tested the
ro-bustness of the results to phylogenetic uncertainty and found that small levels of perturbation (3%) have little effect on the results, but as the level of perturbation increases, the signal weakens accord-ingly (Supplementary Table S6).
Estimates of heritability in previously analysed data
Tables 1and 2show the medians and confidence
intervals of h2as estimated by multiple hypothesis testing (MHT). In the Swiss data, the confidence intervals exclude zero in several cases. In all of these instances, the randomization test was also signifi-cant. However, a significant randomization test did not always correspond to confidence intervals which excluded zero, because these are one- and two-tailed tests, respectively.
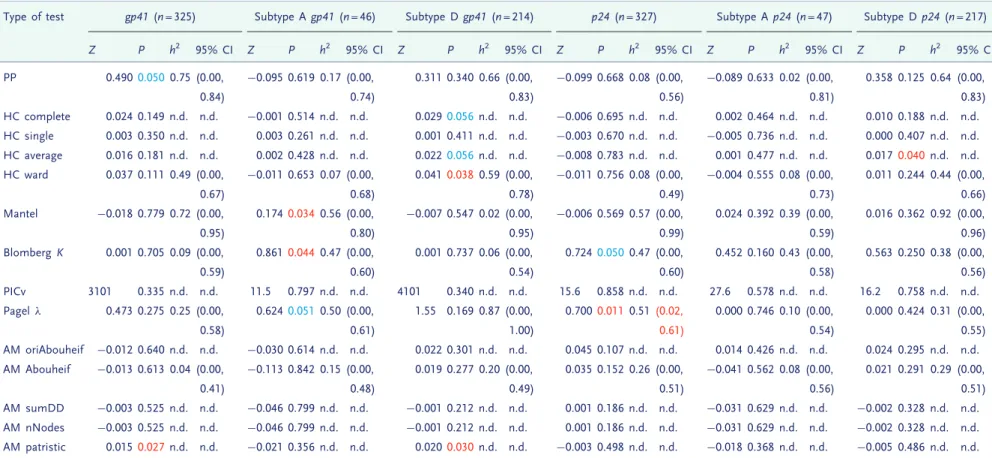
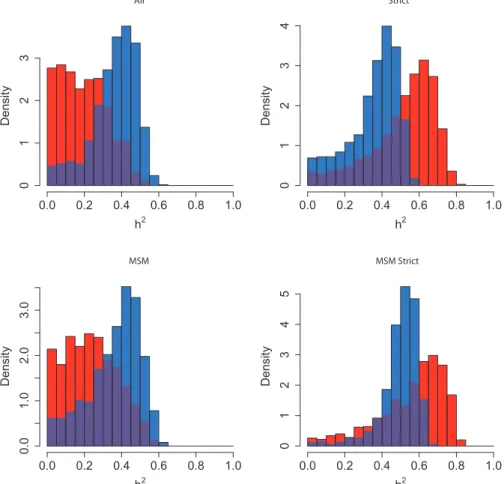
The distribution of true heritability was calculated by ABC using both PP (red) and Pagel’s ! (blue) for each subdivision in the Swiss and Rakai datasets
(Figs 1and2). In the Swiss figure, the MSM Strict
subdivision exhibits the distribution of h2 most removed from zero, which supports the results from the randomization test and lower confidence bounds (Table 2). The method using Pagel’s ! exhibits higher heritability in the larger subdivisions. Similarly in the Rakai cohort, the most significant result from the randomization test (Table 1) is the p24 subdivision analysed under Pagel’s !, and this is reflected in the results from ABC, in which the dis-tribution of estimated h2 is highly positive. Interestingly, the PP method finds that the most sig-nificant distribution visually is instead from the gp41 subdivision which is also confirmed by the randomization test.
We also tested an alternative method of simula-tion which accounted for differences in branch length and allowed multiple generations between two adjacent nodes. We applied this to the Rakai p24 subtype A data (Supplementary Table S7), and the alternative gave higher estimates of h2but wider confidence intervals.
Heritability was also measured in the Rakai and Swiss data using a phylogenetic mixed model, which assumes that the trait is determined by independent viral and host effects [62]. These results are given in
Supplementary Table S4.
Testing the sensitivity of each statistic
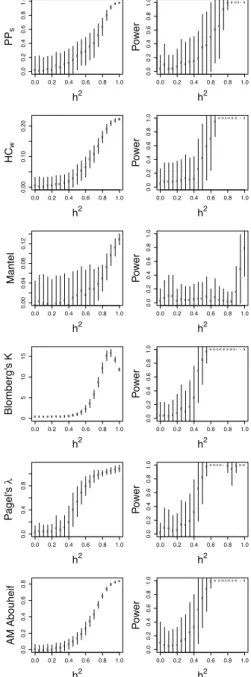
The sensitivity of each phylogenetic comparative statistic to simulated heritability was explored by visualizing the relationship between them, and measuring the power of the statistic to successfully detect an effect of that size, in the entire Swiss dataset and the MSM Strict subdivision (Figs 3and
4, respectively). None of the statistics had substan-tial power to detect heritability below h2= 0.4 on any subdivision, but most had the power to detect an effect above that level. The Mantel test performed poorly throughout. Blomberg’s K performed well in the MSM Strict subdivision, but was insensitive when applied to the entire Swiss dataset, with only values above h2= 0.6 being consistently detected. In the entire Swiss dataset, the AM statistic appeared the most sensitive, but in the MSM Strict subdiv-ision its performance matched that of Pagel’s !.
We also tested the power of variants of the HC and AM tests compared with their default methods
Table 1. The statistics (Z), P-values from a randomization test, medians and confidence intervals of h2 from MHT on the Rakai data
Type of test gp41 (n = 325) Subtype A gp41 (n = 46) Subtype D gp41 (n = 214) p24 (n = 327) Subtype A p24 (n = 47) Subtype D p24 (n = 217)
Z P h2 95% CI Z P h2 95% CI Z P h2 95% CI Z P h2 95% CI Z P h2 95% CI Z P h2 95% CI PP 0.4900.0500.75 (0.00, 0.84) %0.095 0.619 0.17 (0.00, 0.74) 0.311 0.340 0.66 (0.00, 0.83) %0.099 0.668 0.08 (0.00, 0.56) %0.089 0.633 0.02 (0.00, 0.81) 0.358 0.125 0.64 (0.00, 0.83) HC complete 0.024 0.149 n.d. n.d. %0.001 0.514 n.d. n.d. 0.0290.056n.d. n.d. %0.006 0.695 n.d. n.d. 0.002 0.464 n.d. n.d. 0.010 0.188 n.d. n.d. HC single 0.003 0.350 n.d. n.d. 0.003 0.261 n.d. n.d. 0.001 0.411 n.d. n.d. %0.003 0.670 n.d. n.d. %0.005 0.736 n.d. n.d. 0.000 0.407 n.d. n.d. HC average 0.016 0.181 n.d. n.d. 0.002 0.428 n.d. n.d. 0.0220.056n.d. n.d. %0.008 0.783 n.d. n.d. 0.001 0.477 n.d. n.d. 0.017 0.040n.d. n.d. HC ward 0.037 0.111 0.49 (0.00, 0.67) %0.011 0.653 0.07 (0.00, 0.68) 0.0410.0380.59 (0.00, 0.78) %0.011 0.756 0.08 (0.00, 0.49) %0.004 0.555 0.08 (0.00, 0.73) 0.011 0.244 0.44 (0.00, 0.66) Mantel %0.018 0.779 0.72 (0.00, 0.95) 0.1740.0340.56 (0.00, 0.80) %0.007 0.547 0.02 (0.00, 0.95) %0.006 0.569 0.57 (0.00, 0.99) 0.024 0.392 0.39 (0.00, 0.59) 0.016 0.362 0.92 (0.00, 0.96) Blomberg K 0.001 0.705 0.09 (0.00, 0.59) 0.8610.0440.47 (0.00, 0.60) 0.001 0.737 0.06 (0.00, 0.54) 0.7240.050 0.47 (0.00, 0.60) 0.452 0.160 0.43 (0.00, 0.58) 0.563 0.250 0.38 (0.00, 0.56) PICv 3101 0.335 n.d. n.d. 11.5 0.797 n.d. n.d. 4101 0.340 n.d. n.d. 15.6 0.858 n.d. n.d. 27.6 0.578 n.d. n.d. 16.2 0.758 n.d. n.d. Pagel ! 0.473 0.275 0.25 (0.00, 0.58) 0.6240.0510.50 (0.00, 0.61) 1.55 0.169 0.87 (0.00, 1.00) 0.7000.011 0.51(0.02, 0.61) 0.000 0.746 0.10 (0.00, 0.54) 0.000 0.424 0.31 (0.00, 0.55) AM oriAbouheif %0.012 0.640 n.d. n.d. %0.030 0.614 n.d. n.d. 0.022 0.301 n.d. n.d. 0.045 0.107 n.d. n.d. 0.014 0.426 n.d. n.d. 0.024 0.295 n.d. n.d. AM Abouheif %0.013 0.613 0.04 (0.00, 0.41) %0.113 0.842 0.15 (0.00, 0.48) 0.019 0.277 0.20 (0.00, 0.49) 0.035 0.152 0.26 (0.00, 0.51) %0.041 0.562 0.08 (0.00, 0.56) 0.021 0.291 0.29 (0.00, 0.51) AM sumDD %0.003 0.525 n.d. n.d. %0.046 0.799 n.d. n.d. %0.001 0.212 n.d. n.d. 0.001 0.186 n.d. n.d. %0.031 0.629 n.d. n.d. %0.002 0.328 n.d. n.d. AM nNodes %0.003 0.525 n.d. n.d. %0.046 0.799 n.d. n.d. %0.001 0.212 n.d. n.d. 0.001 0.186 n.d. n.d. %0.031 0.629 n.d. n.d. %0.002 0.328 n.d. n.d. AM patristic 0.0150.027n.d. n.d. %0.021 0.356 n.d. n.d. 0.0200.030n.d. n.d. %0.003 0.498 n.d. n.d. %0.018 0.368 n.d. n.d. %0.005 0.486 n.d. n.d. This table included from analysis of the gp41 and p24 genes in all the available Rakai data, or subtypes A or D separately. P-values showing borderline significance (P < 0.1) are in blue, and formal significance (P < 0.05) is in red, and confidence intervals in which the lower limit is above zero are also in red. n.d., not done.
214 | Shirreff et al. Evolution, Medicine, and Public Health
(‘ward’ and ‘Abouheif’, respectively)
(Supplementary Figs S5 and S6). The default
methods performed equally well or better than any of the variations.
Application to data from the Netherlands
Supplementary Figure S4shows the shape of the
phylogeny inferred from the Netherlands data. These data have not been previously analysed for heritability, and so to reduce the problem of multiple testing only two methods, Pagel’s ! and PP, were used to detect and measure heritability in each sub-division of the data.
Significant heritability was found only in one subdivision (MSM from the Netherlands with Strict viral loads) and using one statistic (Pagel’s !), which gave a heritability estimate of h2= 0.52 (Table 3). No effect was found when the PP method was used. None of the confidence inter-vals on h2excluded 0. The estimated distributions of
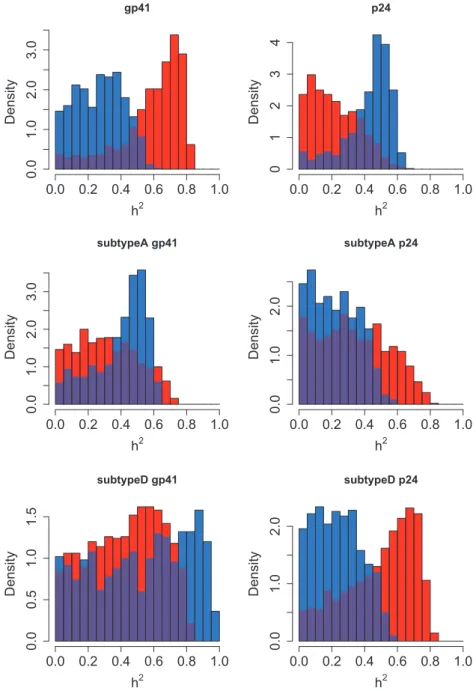
h2are shown inFig. 5.
DISCUSSION
In this study, we developed new methods for detect-ing and measurdetect-ing heritability of SPVL usdetect-ing phylo-genetic relationships and compared them with established methods on real and simulated data.
Which cohorts exhibit heritability?
Heritability was detected consistently in the MSM Strict subdivision of the Swiss cohort (Table 2), sup-porting the previous study of these data which found significant and high heritability in that subdivision [36]. Note that in that study, the level of significance was detected by randomizing the PICv rather than the K statistic, hence the strong result for PICv in the MSM Strict subdivision. We also found that several statistics uncovered significant heritability in all of the subdivisions of the Swiss data. In many such cases, the confidence intervals of h2also excluded zero, and the estimates for h2were high (0.44–0.68).
Table 2. The statistics (Z), P-values from a randomization test, medians and confidence intervals of h2
from MHT on the Swiss data
Type of test All (n = 661) Strict (n = 230) MSM (n = 404) MSM Strict (n = 134)
Z P h2 95% CI Z P h2 95% CI Z P h2 95% CI Z P h2 95% CI PP %0.089 0.817 0.08 (0.00, 0.48) 0.376 0.020 0.61 (0.01, 0.77) 0.009 0.492 0.18 (0.00, 0.53) 0.595 0.005 0.68 (0.12, 0.82) HC complete 0.008 0.214 n.d. n.d. 0.045 0.038 n.d. n.d. 0.020 0.096 n.d. n.d. 0.049 0.032 n.d. n.d. HC single 0.006 0.159 n.d. n.d. 0.030 0.038 n.d. n.d. 0.008 0.175 n.d. n.d. 0.034 0.040 n.d. n.d. HC average 0.004 0.315 n.d. n.d. 0.039 0.043 n.d. n.d. 0.016 0.113 n.d. n.d. 0.046 0.024 n.d. n.d. HC ward 0.008 0.315 0.36 (0.00, 0.52) 0.060 0.020 0.58 (0.28, 0.72) 0.036 0.036 0.44 (0.00, 0.61) 0.063 0.023 0.62 (0.34, 0.73) Mantel %0.014 0.712 0.00 (0.00, 0.80) 0.040 0.201 0.91 (0.00, 0.97) %0.005 0.516 0.00 (0.00, 0.76) 0.050 0.207 0.79 (0.00, 0.91) Blomberg K 0.002 0.305 0.50 (0.00, 0.67) 0.025 0.366 0.44 (0.00, 0.72) 0.091 0.038 0.71 (0.00, 0.82) 0.593 0.080 0.42 (0.00, 0.54) PICv 1594 0.307 n.d. n.d. 127 0.345 n.d. n.d. 40.2 0.052 n.d. n.d. 5.58 0.002 n.d. n.d. Pagel ! 0.105 0.016 0.44 (0.16, 0.57) 0.216 0.030 0.44 (0.00, 0.57) 0.153 0.025 0.45 (0.00, 0.59) 0.646 0.016 0.54 (0.32, 0.63) AM oriAbouheif %0.013 0.680 n.d. n.d. 0.016 0.361 n.d. n.d. 0.038 0.141 n.d. n.d. 0.127 0.023 n.d. n.d. AM Abouheif %0.014 0.671 0.01 (0.00, 0.32) 0.015 0.338 0.24 (0.00, 0.49) 0.037 0.138 0.31 (0.00, 0.48) 0.126 0.019 0.49 (0.03, 0.61) AM sumDD 0.000 0.166 n.d. n.d. 0.001 0.168 n.d. n.d. 0.001 0.136 n.d. n.d. 0.013 0.016 n.d. n.d. AM nNodes 0.000 0.166 n.d. n.d. 0.001 0.168 n.d. n.d. 0.001 0.136 n.d. n.d. 0.013 0.016 n.d. n.d. AM patristic 0.002 0.320 n.d. n.d. 0.002 0.155 n.d. n.d. 0.005 0.119 n.d. n.d. 0.000 0.054 n.d. n.d.
Individuals were subdivided according to variability of viral load (Strict), risk category (MSM) or both. P-values showing borderline significance (P < 0.1) are in blue, and formal significance (P < 0.05) is in red, and confidence intervals in which the lower limit is above zero are also in red. n.d., not done.
In spite of significant heritability being found in previous work on the Rakai data [34], we did not consistently find heritability in this cohort. Although they are not strictly comparable, the results from the previous studies of the Rakai and Swiss data suggest that heritability is higher in the latter cohort, and this may underlie the differences in our results. However, the best esti-mate for h2 from the Rakai data was high (0.51)
(Table 1).
Six different subdivisions of the Netherlands data were analysed using PP and Pagel’s !, and only a single positive result was found with one statistic (!) in one subdivision, suggesting that heritability is close to the detection borderline. It was estimated at h2= 0.52 (Table 3), which falls high within the range of previous estimates [30].
It is interesting that the Swiss cohort shows more apparent heritability than the Netherlands in spite of a similar transmission routes and genetic back-grounds. One potential explanation would be differ-ences in coverage. The prevalence in Switzerland is higher (0.4% compared with 0.2%) [63], but so is the
sample size (661 compared with 416) which sug-gests similar levels of coverage, which are reportedly high in both cohorts [47,64]. In the Swiss dataset, the mean SPVL of the Strict group is significantly higher than that of the rest (P = 0.0004), and the same is true of the MSM over non-MSM (P = 0.003) [36]. The same is not true of these two categories in the Netherlands cohort (data not shown), which suggests that viral virulence geno-types are less structured in this cohort and may explain lower heritability.
The exclusion of non-Strict individuals generally increased the level of significance, but this was dependent on the cohort and the method. In the Swiss cohort, the exclusion increased significance when using the PP and HC methods, but not other-wise (Table 2). In the Netherlands cohort, the exclu-sion increased significance markedly when using Pagel’s !, but not as much using PP (Table 3). Understanding why the Strict population exhibits higher heritability than whole sample may be an im-portant step in both estimating and understanding the mechanisms behind heritability. Simple models
0.0 0.2 0.4 0.6 0.8 1.0 0123 Density 0.0 0.2 0.4 0.6 0.8 1.0 01234 Density 0.0 0.2 0.4 0.6 0.8 1.0 0.0 1.0 2.0 3.0 Density 0.0 0.2 0.4 0.6 0.8 1.0 012345 Density
Figure 1. Heritability estimated by ABC in all subdivisions of the Swiss data. The subdivision is written above the plot. Results from the PP method are in red, and from Pagel’s ! in blue, with the overlap in purple
fitted to longitudinal viral load data within patients suggest that fluctuations do not just represent ran-dom noise [65]. Fluctuating viral load has been associated with untreated sexually transmitted co-infections [66] and this or other host-mediated effect may mask the effect of the viral genotype and justify the exclusion of individuals with highly variable viral loads.
The same gene pol was used to analyse the Swiss and Netherlands datasets, whereas the available genes from the Rakai cohort were env and gag. It has been shown that env and pol produce similar
trees [67], but there are topological differences, and our work also demonstrates different results be-tween gag and env (Fig. 2). The ABC method of esti-mation by simulation makes estiesti-mation of h2robust
to differences in gene usage and we do not expect systematic differences between the cohorts. There are also differences in transmission routes between the cohorts, and a higher diversity of HLA types in African than European populations [68]. Although these differences inhibit direct comparability be-tween the European and Ugandan datasets, they add to the general nature of this work.
Figure 2. Heritability estimated by ABC in all subdivisions of the Rakai data. The subdivision is written above the plot. Results from the PP method are in red, and from Pagel’s ! in blue, with the overlap in purple
Which method is best for detecting heritability?
The principle test of these statistics is the detection of an effect in real data. Pagel’s ! detected heritabil-ity in every subdivision of the Swiss data (Table 2), and also produced the strongest result of any statis-tic applied to the Rakai dataset (Table 1). The PP and HC statistics performed well on the Swiss data, par-ticularly on the Strict subdivisions. The AM statistics
were less successful at detecting an effect in the Swiss data. In the Rakai data, the AM ‘patristic’ vari-ant found a significvari-ant result in two subdivisions. However, in simulation studies it performed very poorly (Supplementary Fig. S6).
Testing the detection power by simulation relies on a simple model of trait evolution, but has the advantage that heritability is known. It revealed that the PP, HC, Pagel’s ! and AM statistics were com-parably sensitive, detecting an effect at greater than approximately 0.4 heritability in the Swiss data, with
λ
Figure 3. Comparison of the sensitivity of various statistics to heritability on the entire Swiss phylogeny. (Left side) The rela-tionship between heritability and six different statistics under comparison. The circles and bars represent the mean and standard deviation of the sample. (Right side) The power of each statistic to detect heritability at 5% significance. The bars represent the standard deviation of the proportion
λ
Figure 4. Comparison of the sensitivity of various statistics on the Swiss MSM Strict phylogeny. Left and right side as in
Figure 3
AM slightly more sensitive (Figs 3 and 4). The K statistic was as sensitive as other statistics when applied to the MSM Strict subdivision, but in the entire Swiss dataset its sensitivity was low.
Simulations suggest that none of the methods can detect heritability lower than approximately h2= 0.4, and this threshold is higher in some phylogenies. This threshold is confirmed by the finding that estimates of h2 are always above 0.4 when heritability was found to be significant. Most studies have estimated lower heritability than this [30], and previous modelling work has suggested that such low heritability is enough to produce a substantial rate of evolution [15]. This suggests that phylogenetic methods are not adequate to exclude the possibility of relevant heritability in HIV viru-lence in these datasets.
Interestingly, another study which took an analyt-ical and computational approach to comparing be-tween Blomberg’s K, the AM and the Mantel test found that K had a higher power to detect an effect than the AM statistic [69]. They also argue that these tests should all give the same significance as they are based on the cross-product of a phylogenetic simi-larity and trait simisimi-larity matrix. In contrast, we found marked differences between their perform-ances, with the AM, K and Mantel statistic having decreasing power to detect an effect. They found that the sensitivity of these methods was dependent on the shape of the phylogeny, so differences in the source of trees (simulated versus inferred) are a pos-sible source of discrepancy in the respective studies.
This is beyond the scope of this study but deserves to be the subject of future work.
The PP, along with the HC methods, is able to account for cofactors of SPVL: ignoring these may lead to overestimates or underestimates of heritabil-ity if they associate or dissociate on the tree, respect-ively. Indeed, an increase in signal when cofactors were taken into account was seen in previous ana-lysis of transmission pairs in the Rakai cohort [34]. However, in the absence of a method to include the effect of cofactors in simulations, this aspect of the PP or HC methods cannot be harnessed to measure h2. One possible method would be to calculate the fixed effects of the cofactors using a linear regres-sion, simulate only the residuals, and subsequently add the fixed effects, but this requires treating re-siduals as data, which is inappropriate in the likely event that there is correlation between the effects of cofactors and the SPVL [70]. The PP method pro-duces a dataset of couples, which is analogous to other couples studies [31–34]. The lack of sensitivity of the PP method and the other phylogenetic methods suggests that the phylogeny cannot (yet) tell us everything that the epidemiology does about the transmission network.
The ! statistic has the advantage that it incorpor-ates both topology and branch lengths, and analyses the entire sample. It is notable, therefore, that the PP method is relatively successful in spite of its analysing only a subset of individuals who form ap-parent transmission pairs (60%), and in particular ignores deep relationships within the phylogeny.
Table 3. The statistics (Z), P-values from a randomization test, medians and confidence intervals of h2
from MHT on the Netherlands data, when analyzed with PP and Pagel’s !
All Strict MSM MSM Strict MSM NL MSM NL Strict
n 416 246 348 211 286 174 PP Z %0.0627 0.2193 0.0763 0.2047 0.0633 0.2277 P-value 0.703 0.111 0.272 0.128 0.327 0.130 h2 0.02 0.01 0.08 0.09 0.29 0.40 95% CI (0.00, 0.45) (0.00, 0.56) (0.00, 0.53) (0.00, 0.47) (0.00, 0.63) (0.00, 0.67) Pagel’s ! Z 0.0001 0.0978 0.0001 0.0323 0.0001 0.2628 P-value 0.824 0.086 0.827 0.200 0.718 0.038 h2 0.19 0.44 0.01 0.38 0.10 0.52 95% CI (0.00, 0.50) (0.00, 0.60) (0.00, 0.51) (0.00, 0.60) (0.00, 0.55) (0.00, 0.63)
Individuals were subdivided according to variability of viral load (Strict), risk category (MSM) or whether they were from the Netherlands (NL). P-values showing borderline significance (P < 0.1) are in blue, and formal significance (P < 0.05) is in red, and confidence intervals in which the lower limit is above zero are also in red.
This suggests that most signal lies in the recent phylogenetic relationships. However, in unpub-lished work, Hodcroft et al. found SPVL heritability using pedigree analysis on UK data [71]. In contrast to our work, they found that collapsing poorly sup-ported nodes in the tree and thereby ignoring some of the shallow relationships in the phylogeny had a negligible effect on their results for some datasets. The AM method is also successful, which (with the exception of the ‘patristic’ variant) ignores branch lengths, indicating that topology may be more im-portant. Rigorously identifying which clades or levels of the phylogeny are responsible for heritability
would be an interesting direction for future research. This may differ for phylogenies which are less star-like than HIV. The use of longer sequences and bet-ter sampled datasets is likely to result in betbet-ter detection and estimation of heritability, as poorly resolved trees scramble the heritability signal. However, the detection threshold is unlikely to change even with improved sampling, as it was based on simulations which were blind to uncer-tainty in the tree.
It is noteworthy that the PP and Pagel’s ! each have their strengths in estimating the distributions of h2 in the different Rakai subdivisions. The PP
Figure 5. Heritability estimated by ABC in all subdivisions of the Netherlands data. The subdivision is written above the plot. Results from the PP method are in red, and from Pagel’s ! in blue, with the overlap in purple
method identifies a more strongly positive distribu-tion in subdivision gp41, which Pagel’s ! does not, but the latter detects a more positive distribution in p24 and subtype A gp41. This suggests that an ap-proach which combines these methods may be appropriate.
CONCLUSIONS AND IMPLICATIONS
In this study, we compare several phylogenetic com-parative methods to detect heritability, h2. Many methods detect heritability successfully in real and simulated data, but sensitivity drops off below h2= 0.4. We recommend the PP method and Pagel’s ! for use in detecting and estimating herit-ability, the former for its consideration of co-factors, and the latter for its marginally higher level of sensitivity.
Estimates of heritability were consistent with pre-vious studies on the Rakai and Swiss data, and con-firm that heritability can be very high, which has clinical and evolutionary implications. When applied to the Netherlands data, heritability was found only in the most homogeneous subdivision, MSM who originate in the Netherlands with Strict viral loads. Differences in heritability between cohorts, subdivisions and methods for estimation carry implications for the biology of heritability, which offer interesting avenues for future modelling work. Experimental and epidemiological research are also required to directly identify viral factors which contribute to variance in SPVL, as well as exploring the impact of treatment on virulence evolution.
supplementary data
Supplementary dataare available at EMPH online.
acknowledgements
For advice, discussions and technical help the authors would like to thank Luuk Gras, Frank de Wolf, Neil Ferguson, Andrew Rambaut, Simon Cauchemez, Lulla Opatowski, Oliver Rattman, Thibaut Jombart, Deirdre Hollingsworth, Federico Calboli, Jeff Eaton, Matthew Hartfield, Melissa Ward, Emma Hodcroft, Andrew Leigh Brown, Joshua Herbeck, Tanja Stadler, Roland Regoes and Sebastian Bonhoeffer. They also thank anonymous reviewers for their helpful comments which have helped strengthen this work.
Swiss HIV Cohort Study
The SHCS was supported by the Swiss National Science Foundation (SNF grant #33CS30–134277). Further support was provided by, SNF grant #324730–130865 (to H.F.G.) and the SHCS projects #470, 528, 569, 683, the SHCS Research Foundation, the Jacob-Stiftung, Zu¨rich (to H.F.G.), by an unrestricted research grant of the Union Bank of Switzerland, in the name of an anonymous donor to HFG, and an unrestricted research from Gilead, Switzerland (to H.F.G.), and by the University of Zurichs Clinical research Priority Program (CRPP) ‘Viral infectious diseases: Zurich Primary HIV Infection Study’ (to H.F.G.). The funders had no role in study design, data collection and analysis, decision to publish, or preparation of the manuscript.
The authors thank the patients who participate in the SHCS; the physicians and study nurses for excellent patient care; the resistance laboratories for high quality genotypic drug resistance testing; SmartGene, Zug, Switzerland for technical support; Brigitte Remy, Martin Rickenbach, MD, F. Scho ¨ni-Affolter and Yannick Vallet from the SHCS Data Center in Lausanne for the data management and Danie`le Perraudin and Mirijam Minichiello for administrative assistance. The members of the Swiss HIV Cohort Study are Aubert V, Barth J, Battegay M, Bernasconi E, Bo¨ni J, Bucher HC, Burton-Jeangros C, Calmy A, Cavassini M, Egger M, Elzi L, Fehr J, Fellay J, Francioli P, Furrer H (Chairman of the Clinical and Laboratory Committee), Fux CA, Gorgievski M, Gu¨nthard H (President of the SHCS), Haerry D (deputy of ‘Positive Council’), Hasse B, Hirsch HH, Hirschel B, Ho¨sli I, Kahlert C, Kaiser L, Keiser O, Kind C, Klimkait T, Kovari H, Ledergerber B, Martinetti G, Martinez de Tejada B, Metzner K, Mller N, Nadal D, Pantaleo G, Rauch A (Chairman of the Scientific Board), Regenass S, Rickenbach M (Head of Data Center), Rudin C (Chairman of the Mother and Child Substudy), Schmid P, Schultze D, Scho¨ni-Affolter F, Schu¨pbach J, Speck R, Taffe´ P, Tarr P, Telenti A, Trkola A, Vernazza P, Weber R, Yerly S.
Rakai Health Sciences Programme
The study was funded in part by the Department of Intramural Research, National Institute of Allergy and Infectious Diseases [NIAID], National
Institutes of Health [NIH] (to O.L.). The authors thank the participants and the study team of the Rakai Community Cohort Study, which was supported by (i) the Bill and Melinda Gates Foundation (22006.03), (ii) the National Institutes of Health (NIH), Division of Allergy and Infectious Diseases (U1AI51171 and 1UO1AI075115-O1A1), (iii) the Department of the Army, US Army Medical Research and Materiel Command Cooperative Agreement (DAMD17-98-2-8007), and (v) the Henry M. Jackson Foundation (5D43TW00010). They also thank the participants of the Rakai Health Sciences Program and the physicians, nurses, data managers and laboratory specialists who provide such excellent care.
The members of the Rakai Health Sciences Program are: Sewankambo N, Serwadda D, Kigozi G, Nalugoda F, Wabwire-Mangen F, Musoke R, Kagaayi J, Ssekubugu R, Lutalo T, Kiddugavu M, Makumbi F, Ssempijja V, Galiwango RM, Nantume B, Kiwanuka N, Boaz I, Kong X, Quinn TC, Reynolds SJ, Wawer MJ, Gray RH.
ATHENA National Observational Cohort, The Netherlands
This is a collaboration between the following treatment centres and individuals in the Netherlands. Director: Prof. Dr F. de Wolf. Data analysis group: Dr D. O. Bezemer, Dr L. A. J. Gras, Dr A. M. Kesselring, Dr A. I. van Sighem, Dr Ir. C. Smit. Data collection: Dr S. Zaheri. Participating centres (site coordinating physicians): Academisch Medisch Centrum bij de Universiteit van Amsterdam, Amsterdam: Prof. Dr J. M. Prins, Prof. Dr T. W. Kuijpers, Dr H. J. Scherpbier, Dr J. T. M. van der Meer, Dr F. W. M. N. Wit, Dr M. H. Godfried, Prof. Dr P. Reiss, Prof. Dr T. van der Poll, Dr F. J. B. Nellen, Prof. Dr J. M. A. Lange, Dr S. E. Geerlings, Dr M. van Vugt, Dr D. Pajkrt, Dr J. C. Bos, Dr M. van der Valk, Dr M. L. Grijsen, Dr W. J. Wiersinga. Academisch Ziekenhuis Maastricht, Maastricht: Dr S. Lowe, Dr G. Schreij, Dr A. Oude Lashof, Dr D. Posthouwer. Catharina-ziekenhuis, Eindhoven: Dr M. J. H. Pronk, Dr B. Bravenboer. Erasmus Medisch Centrum, Rotterdam: Dr M. E. van der Ende, Dr T. E. M. S. de Vries-Sluijs, Dr C. A. M. Schurink, Dr J. L. Nouwen, Dr M. H. Nispen tot Pannerden, Dr A. Verbon, Dr B. J. A. Rijnders, Dr E. C. M. van Gorp, Dr R. J. Hassing, Dr A. W. M. Smeulders. Erasmus Medisch Centrum, Sophia, Rotterdam: Dr N. G. Hartwig, Dr G. J. A. Driessen.
Flevoziekenhuis. Almere: Dr J. Branger. HagaZiekenhuis, Den Haag: Dr E. F. Schippers, Dr C. van Nieuwkoop, Dr E. P. van Elzakker. Isala Klinieken, Zwolle: Dr P. H. P. Groeneveld, Dr M. A. Alleman, Dr J. W. Bouwhuis. Kennemer Gasthuis: Dr R. Soetekouw, Prof. Dr R. W. ten Kate. Leids Universitair Medisch Centrum, Leiden: Dr F. P. Kroon, Prof. Dr J. T. van Dissel, Dr S. M. Arend, Dr M. G. J. de Boer, Dr H. Jolink, Dr H. J. M. ter Vollaard, Dr M. P. Bauer. Maasstadziekenhuis, Rotterdam: Dr J. G. den Hollander, Dr K. Pogany. Medisch Centrum Alkmaar, Alkmaar: Dr G. van Twillert, Dr W. Kortmann. Medisch Centrum Haaglanden, Den Haag: Dr E. M. S. Leyten, Dr L. B. S. Gelinck. Medisch Spectrum Twente, Enschede: Dr G. J. Kootstra, Dr C. E. Delsing. Onze Lieve Vrouwe Gasthuis, Amsterdam: Prof. Dr K. Brinkman, Dr W. L. Blok, Dr P. H. J. Frissen, Dr W. E. M. Schouten, Dr G. E. L. van den Berk. Sint Elisabeth Ziekenhuis, Tilburg: Dr M. E. E. van Kasteren. Sint Lucas Andreas Ziekenhuis, Amsterdam: Dr J. Veenstra, Dr K. D. Lettinga. Slotervaartziekenhuis, Amsterdam: Dr J. W. Mulder, Dr S. M. E. Vrouenraets, Dr F. N. Lauw. Stichting Medisch Centrum Jan van Goyen, Amsterdam: Dr A. van Eeden, Dr D. W. M. Verhagen. Universitair Medisch Centrum Groningen, Groningen: Dr H. G. Sprenger, Dr R. Doedens, Dr E. H. Scholvinck, Dr S. van Assen, Dr W. F. W. Bierman. Universitair Medisch Centrum Sint Radboud, Nijmegen: Dr P. P. Koopmans, Dr M. Keuter, Dr A. J. A. M. van der Ven, Dr H. J. M. ter Hofstede, Dr A. S. M. Dofferhoff, Dr A. Warris, Dr R. van Crevel. Universitair Medisch Centrum Utrecht, Utrecht: Prof. Dr A. I. M. Hoepelman, Dr T. Mudrikova, Dr M. M. E. Schneider, Dr P. M. Ellerbroek, Dr J. J. Oosterheert, Dr J. E. Arends, Dr M. W. M. Wassenberg, Dr R. E. Barth. Vrije Universiteit Amsterdam, Amsterdam: Dr M. A. van Agtmael, Dr R. M. Perenboom, Dr F. A. P. Claessen, Dr M. Bomers, Dr E. J. G. Peters. Wilhelmina Kinderziekenhuis, Utrecht: Dr S. P. M. Geelen, Dr T. F. W. Wolfs, Dr L. J. Bont. Ziekenhuis Rijnstate, Arnhem: Dr C. Richter, Dr J. P. van der Berg, Dr E. H. Gisolf. Admiraal De Ruyter Ziekenhuis, Vlissingen: Dr M. van den Berge, Dr A. Stegeman. Medisch Centrum Leeuwarden, Leeuwarden: Dr M. G. A. van Vonderen, Dr D. P. F. van Houte. Medisch Centrum Zuiderzee, Lelystad: Dr S. Weijer, Dr R. el Moussaoui. Sint Elisabeth Hospitaal, Willemstad – Curac¸ao: Dr C. Winkel, Dr F. Muskiet, Dr Durand, Dr R. Voigt.
funding
The authors were funded by the European Research Council (ERC), Imperial College London, the Medical Research Council (MRC) Centre for Outbreak Research and Modelling, le Centre National de la Recherche Scientifique (CNRS), l’Institute National de la Sante´ et de la Recherche Me´dicale (INSERM), l’Institut de Recherche pour le De´veloppement (IRD), Division of Intramural Research of the National Institute of Allergy and Infectious Diseases (NIAID), National Institutes of Health (NIH), the Dutch Ministry of Health, and the Royal Society.
Conflict of interest: None declared.
references
1. Ji JP, Loeb LA. Fidelity of HIV-1 reverse-transcriptase copying a hypervariable region of the HIV-1 Env gene. Virology 1994;199:323–30.
2. Alizon S et al. Virulence evolution and the trade-off hypoth-esis: history, current state of affairs and the future. J Evol Biol 2009;22:245–59.
3. Ho DD et al. Rapid turnover of plasma virions and Cd4 lymphocytes in HIV-1 infection. Nature 1995;373:123–6. 4. Wei X et al. Viral dynamics in human immunodeficiency
virus type 1 infection. Nature 1995;373:117–22. 5. Wolfs TFW et al. Naturally-occurring mutations within
HIV-1 V3 genomic RNA lead to antigenic variation de-pendent on a single amino-acid substitution. Virology 1991;185:195–205.
6. Borrow P et al. Antiviral pressure exerted by HIV-1-specific cytotoxic T lymphocytes (CTLs) during primary infection demonstrated by rapid selection of CTL escape virus. Nat Med 1997;3:205–11.
7. Nowak MA et al. Antigenic diversity thresholds and the development of AIDS. Science 1991;254:963–9.
8. Richman D et al. Human-immunodeficiency-virus type-1 mutants resistant to nonnucleoside inhibitors of reverse-transcriptase arise in tissue-culture. Proc Natl Acad Sci U S A 1991;88:11241–5.
9. Schuurman R et al. Rapid changes in human-immunodefi-ciency-virus type-1 RNA load and appearance of drug-resistant virus populations in persons treated with lamivudine (3TC). J Infect Dis 1995;171:1411–9. 10. Leslie AJ et al. HIV evolution: CTL escape mutation and
reversion after transmission. Nat Med 2004;10:282–9. 11. Poon AFY et al. Adaptation to human populations is
re-vealed by within-host polymorphisms in HIV-1 and hepa-titis C virus. PLoS Pathog 2007;3:e45.
12. Yerly S et al. Transmission of antiretroviral-drug-resistant HIV-1 variants. Lancet 1999;354:729–33.
13. Herbeck JT et al. Is the virulence of HIV changing? A meta-analysis of trends in prognostic markers of HIV disease progression and transmission. AIDS 2012;26:193–205.
14. Fraser C et al. Variation in HIV-1 set-point viral load: epi-demiological analysis and an evolutionary hypothesis. Proc Natl Acad Sci U S A 2007;104:17441–6.
15. Shirreff G et al. Transmission selects for HIV-1 strains of intermediate virulence: a modelling approach. PLoS Comput Biol 2011;7:e1002185.
16. Dieckmann U et al. Adaptive Dynamics of Infectious Diseases: In Pursuit of Virulence Management. Cambridge: Cambridge University Press, 2002.
17. Gandon S et al. Imperfect vaccines and the evolution of pathogen virulence. Nature 2001;414:751–6.
18. Wolf F et al. AIDS prognosis based on HIV-1 RNA, CD4+ T-cell count and function: markers with reciprocal predict-ive value over time after seroconversion. AIDS 1997;11: 1799–806.
19. Korenromp EL et al. Clinical prognostic value of RNA viral load and CD4 cell counts during untreated HIV-1 infec-tion—a quantitative review. PLoS One 2009;4:e5950. 20. Mellors JW et al. Prognosis in HIV-1 infection predicted by
the quantity of virus in plasma. Science 1996;272:1167–70. 21. Henrard DR et al. Natural history of HIV-1 cell-free viremia.
JAMA 1995;274:554–8.
22. Geskus RB et al. The HIV RNA setpoint theory revisited. Retrovirology 2007;4:65.
23. Carrington M, O’Brien SJ. The influence of HLA genotype on AIDS. Annu Rev Med 2003;54:535–51.
24. Donnelly CA et al. Gender difference in HIV-1 RNA viral loads. HIV Med 2005;6:170–8.
25. Vu¨ller M et al. Increasing clinical virulence in two decades of the Italian HIV epidemic. Plos Pathog 2009;5:e1000454. 26. Richardson BA et al. Comparison of human immunodefi-ciency virus type 1 viral loads in Kenyan women, men, and infants during primary and early infection. J Virol 2003;77: 7120–3.
27. Abu-Raddad LJ, Patnaik P, Kublin JG. Dual infection with HIV and malaria fuels the spread of both diseases in sub-Saharan Africa. Science 2006;314:1603–6.
28. Jones LE, Perelson AS. Transient viremia, plasma viral load, and reservoir replenishment in HIV-Infected patients on antiretroviral therapy. J AIDS 2007;45:483–93. 29. Fellay J et al. Common genetic variation and the control of
HIV-1 in humans. Plos Genet. 2009;5:e1000791. 30. Vu¨ller M, Fraser C, Herbeck JT. A strong case for viral
gen-etic factors in HIV virulence. Viruses (Basel) 2011;3:204–16. 31. Tang JM et al. HLA allele sharing and HIV type 1 viremia in seroconverting Zambians with known transmitting part-ners. AIDS Res Hum Retroviruses 2004;20:19–25. 32. Hecht FM et al. HIV RNA level in early infection is
pre-dicted by viral load in the transmission source. AIDS 2010; 24:941–5.
33. van der Kuyl AC et al. HIV RNA levels in transmission sources only weakly predict plasma viral load in recipients. AIDS 2010;24:1607–8.
34. Hollingsworth TD et al. HIV-1 transmitting couples have similar viral load set-points in Rakai, Uganda. Plos Pathog 2010;6:e1000876.
35. Fisher RA. The correlation between relatives on the sup-position of Mendelian inheritance. Trans R Soc Edinb 1918; 52:399–433.
36. Alizon S et al. Phylogenetic approach reveals that virus genotype largely determines HIV set-point viral load. Plos Pathog 2010;6:e1001123.
37. Wawer MJ et al. A randomized, community trial of inten-sive sexually transmitted disease control for AIDS preven-tion, Rakai, Uganda. AIDS 1998;12:1211–25.
38. Wawer MJ et al. Control of sexually transmitted diseases for AIDS prevention in Uganda: a randomised community trial. Lancet 1999;353:525–35.
39. Stamatakis A. RAxML-VI-HPC: maximum likelihood-based phylogenetic analyses with thousands of taxa and mixed models. Bioinformatics 2006;22:2688–90. 40. Tavare´ S. Some Probabilistic and Statistical Problems in
the Analysis of DNA Sequences. American Mathematical Society: Lectures on Mathematics in the Life Sciences, Vol. 17. American Mathematical Society, 1986, 57–86.
41. Yang ZH. Among-site rate variation and its impact on phylogenetic analyses. Trends Ecol Evol 1996;11:367–72. 42. Posada D, Crandall KA. MODELTEST: testing the model of
DNA substitution. Bioinformatics 1998;14:817–8. 43. Etherington GJ, Dicks J, Roberts IN. Recombination
Analysis Tool (RAT): a program for the high-throughput detection of recombination. Bioinformatics 2005;21:278–81. 44. Novitsky V et al. Intra-host evolutionary rates in HIV-1C env and gag during primary infection. Infect Genet Evol 2013;19:361–8.
45. Ledergerber B et al. The Swiss HIV Cohort Study—ration-ale, organization and selected base-line characteristics. Soz Praventivmed 1994;39:387–94.
46. Schoeni-Affolter F et al. Cohort profile: the Swiss HIV co-hort study. Int J Epidemiol 2010;39:1179–89.
47. Kouyos RD et al. Molecular epidemiology reveals long-term changes in HIV type 1 subtype B transmission in Switzerland. J Infect Dis 2010;201:1488–97.
48. von Wyl V et al. Emergence of HIV-1 drug resistance in previously untreated patients initiating combination anti-retroviral treatment: a comparison of different regimen types. Arch Intern Med 2007;167:1782–90.
49. Guindon S, Gascuel O. A simple, fast, and accurate algo-rithm to estimate large phylogenies by maximum likeli-hood. Syst Biol 2003;52:696–704.
50. Sundberg K et al. Incomparability of results between phylo-genetic search programs. http://www.ncbi.nlm.nih.gov/ CBBresearch/Fellows/Carroll/pubs/sundberg2008in-comparability.pdf (8 October 2013, date last accessed), 81–4.
51. Gras L et al. Viral load levels measured at set-point have risen over the last decade of the HIV epidemic in the Netherlands. PLoS One 2009;4:e7365.
52. Bezemer D et al. Transmission networks of HIV-1 among men having sex with men in the Netherlands. AIDS 2010; 24:271–82.
53. Paradis E, Claude J, Strimmer K. APE: analyses of phylo-genetics and evolution in R language. Bioinformatics 2004; 20:289–90.
54. R Core Team. R: A language and environment for statistical computing. Vienna/Austria, http://www.R-project.org/ (8 October 2013, date last accessed).
55. Mantel N. The detection of disease clustering and a generalized regression approach. Cancer Res 1967;27: 209–20.
56. Blomberg SP, Garland T, Ives AR. Testing for phylogenetic signal in comparative data: behavioral traits are more la-bile. Evolution 2003;57:717–45.
57. Freckleton RP, Harvey PH, Pagel M. Phylogenetic analysis and comparative data: a test and review of evidence. Am Nat 2002;160:712–26.
58. Pavoine S et al. Testing for phylogenetic signal in pheno-typic traits: new matrices of phylogenetic proximities. Theor Popul Biol 2008;73:79–91.
59. Uhlenbeck GE, Ornstein LS. On the theory of the Brownian motion. Phys Rev 1930;36:823–41.
60. Felsenstein J. Phylogenies and quantitative characters. Annu Rev Ecol Syst 1988;19:445–71.
61. Falconer DS. Introduction to Quantitative Genetics. Edinburgh/London: Oliver & Boyd, 1960.
62. Housworth EA, Martins EP, Lynch M. The phylogenetic mixed model. Am Nat 2004;163:84–96.
63. UNAIDS. HIV and AIDS Estimates. http://www.unaids. org/en/regionscountries/countries/ (8 October 2013, date last accessed).
64. Bezemer D et al. 27 years of the HIV epidemic amongst men having sex with men in the Netherlands: an in depth mathematical model-based analysis. Epidemics 2010;2: 66–79.
65. Masel J et al. Fluctuations in HIV-1 viral load are correlated to CD4(+) T-lymphocyte count during the natural course of infection. J AIDS 2000;23:375–9.
66. Atkins MC et al. Fluctuations of HIV load in semen of HIV positive patients with newly acquired sexually transmitted diseases. Br Med J 1996;313:341–2.
67. Rieder P et al. HIV-1 transmission after cessation of early antiretroviral therapy among men having sex with men. AIDS (London, England) 2010;24:1177–83.
68. Sanchez-Mazas A. African diversity from the HLA point of view: influence of genetic drift, geography, linguistics, and natural selection. Hum Immunol 2001;62:937–48. 69. Pavoine S, Ricotta C. Testing for phylogenetic signal in
biological traits: the ubiquity of cross-product statistics. Evolution 2013;67:828–40.
70. Freckleton RP. The seven deadly sins of comparative ana-lysis. J Evol Biol 2009;22:1367–75.
71. Hodcroft H et al. Population-based study indicates viral genetic effect on HIV virulence is small but significant, Conference on Retroviruses and Opportunistic Infections, Seattle, 2012.